Canada's Renewable Power – Yukon

Yukon
Yukon is the only territory with an electrical grid that connects most communities. The majority of the electricity produced in the territory is hydro, with diesel and natural gas used for back-up and demand peaks.
Generation Trends
In 2018, Yukon generated 93.9% of its electricity from hydro. Two wind turbines (installed in 1993 and 2000) on Haeckel Hill are no longer in operation and are scheduled for decommissioning. New wind turbines may be installed again on Haeckel Hill or on nearby Mount Sumanik. Total renewable generation in 2018 was 419 gigawatt-hours (GW.h).
Yukon faces unique challenges in ensuring a reliable, year-round supply of electricity. The second largest hydro plant (Aishihik) stores water in the summer when demand is lower, and releases it during the winter and at other times when demand is higher. This energy storage is crucial because Yukon’s largest hydro plant in Whitehorse loses nearly half of its generation potential in the winter because of flow reductions on the Yukon River.
Diesel-fired generators are used to provide peaking and emergency back-up supply to the main Yukon grid, and for power in several remote communities in the territory. Liquefied natural gas (LNG) is used in Whitehorse, also for peaking and back-up power. Total thermal generation in 2018 was 27 GW.h, or 6.1% of total generation.
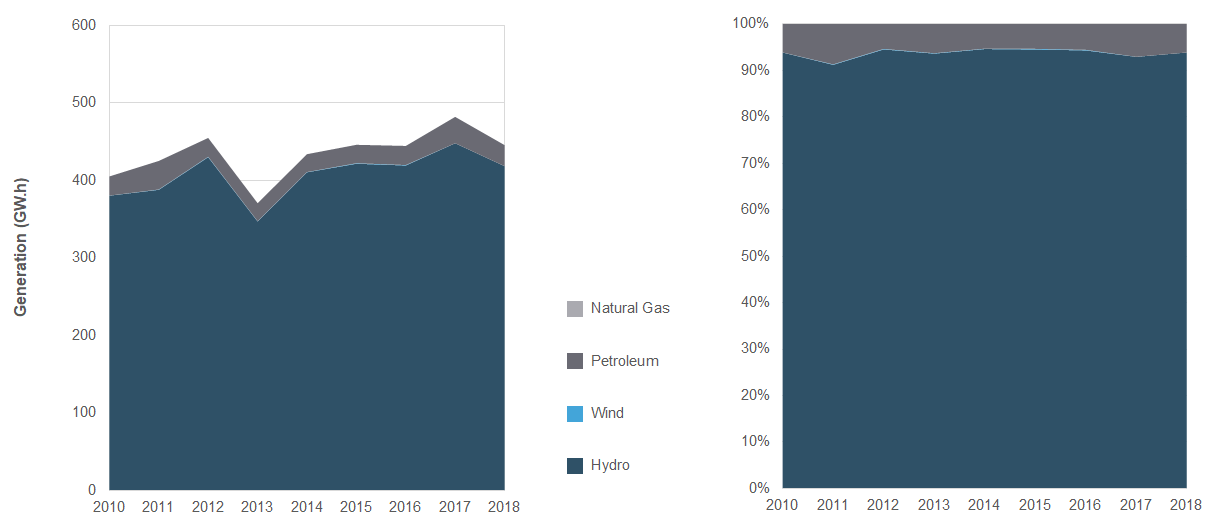
Total electricity generation in Yukon increased from 405 GW.h in 2010 to 446 GW.h in 2018. Changes in Yukon’s electricity generation mix are illustrated in Figure 1.
Figure 1. Electricity Generation in Yukon
Source and Description
Source: CER – Canada’s Energy Future 2020 (EF2020)
Description: This graph illustrates electricity generation from 2010 to 2018 in Yukon. In 2010, Yukon’s total generation was 405 GW.h (93.9% renewable). In 2018, total generation was 446 GW.h (93.9% renewable).
GHG Emissions from Electricity Generation
In 2018, Yukon’s electricity sector emitted 0.03 megatonnes of carbon dioxide equivalent (MT of CO2e). Yukon’s generation intensity was 69 grams of CO2e per kilowatt-hour.
Yukon produced 0.1% of Canada’s total greenhouse gas emissions from electricity generation in 2018.
Recent and Projected Capacity Changes for Renewables
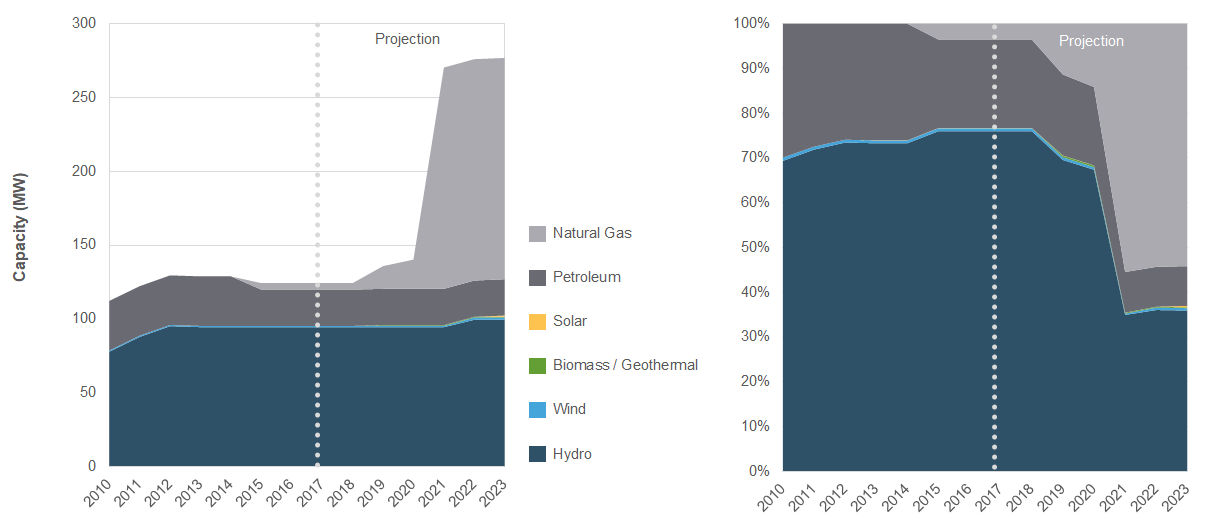
Between 2010 and 2017, Yukon added a net 16.6 megawatts (MW) of renewable capacity, entirely in the form of hydro. Between 2017 and 2023, Yukon is projected to add 6.2 MW of new net hydro, wind, and biomass capacity. These capacity changes are illustrated in Figure 2 with data provided in Table 1.
Starting in 2017, Yukon Energy rented several diesel generators for use as an emergency back-up for peak winter demand. In 2019/20, nine units were rented for a total of 18 MW. Yukon Energy is expecting to rent diesel generators until the end of the decade.
The proposed Casino mine, located northwest of Carmacks, will involve the construction of a 150 MW natural gas-fired power plant. The natural gas will be delivered to the mine by LNG tank trucks.
To address Yukon’s current and future capacity gap, Yukon Energy released a draft 10-year Renewable Energy Plan in 2019. Key elements of this plan include: the construction of a pumped storage hydro facility on Moon Lake; a connection to the planned expansion of the hydro plant in Atlin, British Columbia; battery storage; demand-side management; and a micro-generation program.
Figure 2. Electricity Capacity and Future Changes in Yukon
Source and Description
Source: CER – EF2020
Description: This graph illustrates historical electricity capacity from 2010 to 2017 in Yukon and the CER’s projection of future capacity changes from 2018 to 2023. In 2010, Yukon’s total installed electricity capacity was 112 MW (70.1% renewable). In 2017, capacity had grown to 124 MW (76.7% renewable). By 2023, total capacity is projected to grow to 276 MW (36.8% renewable).
Table 1. Electricity Capacity (2010 – 2023) and Generation (2010 and 2018) in Yukon
| Capacity in MW and % | Generation in GW.h and % | ||||||
|---|---|---|---|---|---|---|---|
| 2010 | 2017 | 2018 | 2020 | 2023 | 2010 | 2018 | |
| ---------- Projected ---------- | |||||||
| Hydroelectricity | 78 | 95 | 95 | 95 | 100 | 380 | 419 |
| 69.4% | 76.0% | 76.0% | 67.4% | 36.1% | 93.9% | 93.9% | |
| Wind | 0.8 | 0.8 | 0.8 | 0.8 | 1.5 | 0.1 | 0.0 |
| 0.7% | 0.7% | 0.7% | 0.6% | 0.5% | 0.0% | 0.0% | |
| Biomass / Geothermal | 0.0 | 0.0 | 0.0 | 0.5 | 0.5 | 0.0 | 0.0 |
| 0.0% | 0.0% | 0.0% | 0.4% | 0.2% | 0.0% | 0.0% | |
| All Renewable Sources | 79 | 95 | 95 | 96 | 101 | 381 | 419 |
| 70.1% | 76.7% | 76.7% | 68.3% | 36.8% | 93.9% | 93.9% | |
| Natural Gas | 0 | 4 | 4 | 20 | 150 | 0 | 0 |
| 0.0% | 3.5% | 3.5% | 14.1% | 54.3% | 0.0% | 0.0% | |
| Oil and Diesel | 34 | 25 | 25 | 25 | 25 | 25 | 27 |
| 29.9% | 19.8% | 19.8% | 17.5% | 8.9% | 6.1% | 6.1% | |
| All Thermal Sources | 34 | 29 | 29 | 44 | 174 | 25 | 27 |
| 29.9% | 23.3% | 23.3% | 31.7% | 63.2% | 6.1% | 6.1% | |
| All Sources | 112 | 124 | 124 | 140 | 276 | 405 | 446 |
- Date modified: