Canada's Renewable Power – New Brunswick

New Brunswick
Approximately one-third of New Brunswick’s electricity comes from renewable sources. Taking into account the Point Lepreau nuclear reactor, 70% of the province’s electricity is from non-emitting sources.
Generation Trends
New Brunswick’s electricity is generated by a diverse mix: roughly one-third renewables, one-third nuclear, and one-third fossil fuels.
In 2018, the Point Lepreau Nuclear Generating Station generated 4 874 gigawatt-hours (GW.h), or 39.3% of New Brunswick’s total generation. Point Lepreau is the only nuclear reactor for electricity generation in operation outside of Ontario. Generation from fossil fuels is primarily from coal and natural gas. Several oil and diesel generating stations exist in the province, but generation from these facilities has declined considerably in recent years. Total thermal generation in 2018 was 8 600 GW.h, or 69.4% of total generation.
Hydro is the largest source of renewable electricity in New Brunswick, followed by wind and biomass. A combination of spring flooding and a dry summer brought NB Power’s hydro production in the province to a 30-year low in 2018. Total renewable generation in 2018 was 3 797 GW.h, or 30.6% of total generation.
New Brunswick also provides roughly three-quarters of Prince Edward Island’s electricity. In 2017, two new sub-sea cables were installed across the Northumberland Strait, increasing New Brunswick’s export capacity to PEI from 200 megawatts (MW) to 560 MW.
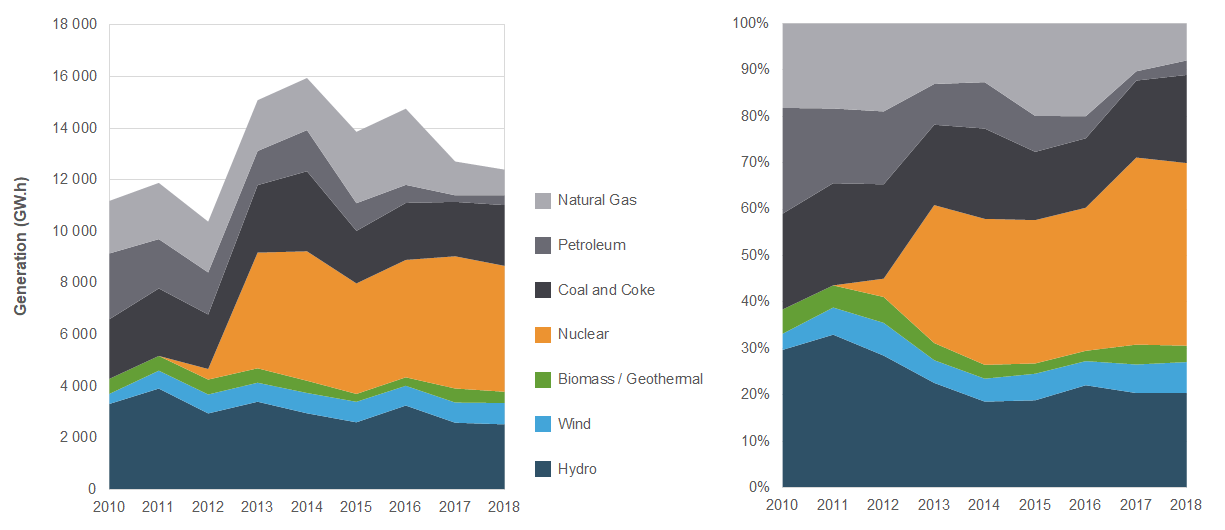
Total electricity generation in New Brunswick grew from 11 188 GW.h in 2010 to 12 397 GW.h in 2018. Changes in New Brunswick’s electricity generation mix are illustrated in Figure 1.
Figure 1. Electricity Generation in New Brunswick
Source and Description
Source: CER – Canada’s Energy Future 2020 (EF2020)
Description: This graph illustrates electricity generation from 2010 to 2018 in New Brunswick. In 2010, New Brunswick’s total generation was 11 188 GW.h (38.4% renewable). In 2018, total generation was 12 397 GW.h (30.6% renewable).
GHG Emissions from Electricity Generation
In 2018, New Brunswick’s electricity sector emitted 3.7 megatonnes of carbon dioxide equivalent (MT of CO2e). New Brunswick’s generation intensity was 290 grams of CO2e per kilowatt-hour.
New Brunswick produced 5.3% of Canada’s total greenhouse gas emissions from electricity generation in 2018.
Recent and Projected Capacity Changes for Renewables
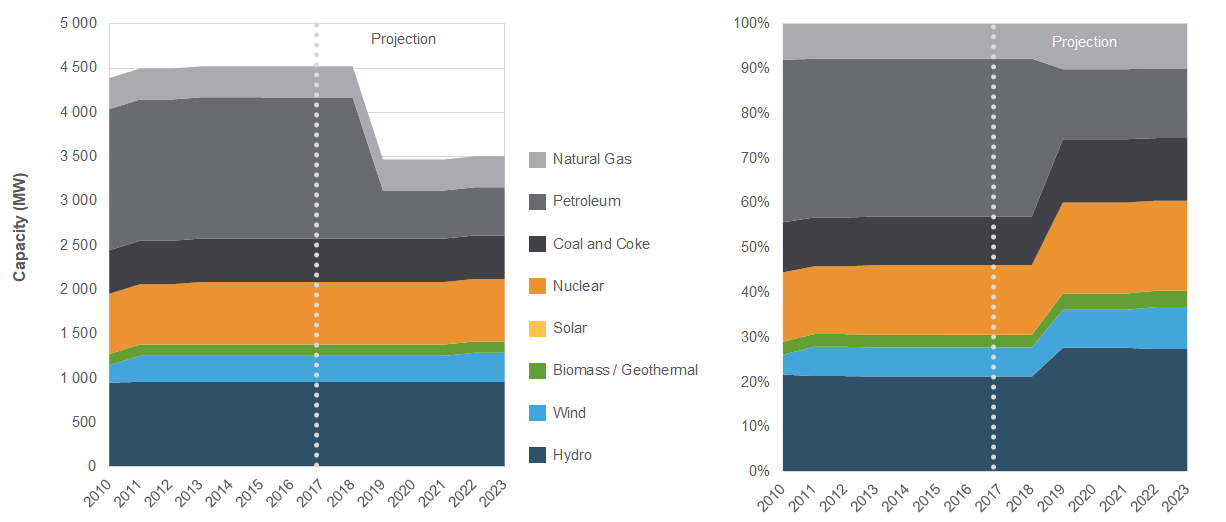
Between 2010 and 2017, New Brunswick added a net 107 MW of renewable capacity, primarily in the form of wind (99 MW). Between 2017 and 2023, New Brunswick is expected to add 35 MW of new net renewable capacity with the Burchill Wind Project. These capacity changes are illustrated in Figure 2 with data provided in Table 1.Footnote 1
Figure 2. Electricity Capacity and Future Changes in New Brunswick
Source and Description
Source: CER – EF2020
Description: This graph illustrates historical electricity capacity from 2010 to 2017 in New Brunswick and the CER’s projection of future capacity changes from 2018 to 2023. In 2010, New Brunswick’s total installed electricity capacity was 4 389 MW (29.1% renewable). In 2017, capacity had grown to 4 520 MW (30.6% renewable). By 2023, total capacity is projected to decline to 3 505 MW (40.4% renewable).Footnote 1
Table 1. Electricity Capacity (2010 – 2023) and Generation (2010 and 2018) in New Brunswick
| Capacity in MW and % | Generation in GW.h and % | ||||||
|---|---|---|---|---|---|---|---|
| 2010 | 2017 | 2018 | 2020 | 2023 | 2010 | 2018 | |
| ---------- Projected ---------- | |||||||
| Hydroelectricity | 953 | 961 | 961 | 961 | 961 | 3 325 | 2 535 |
| 21.7% | 21.3% | 21.3% | 27.7% | 27.4% | 29.7% | 20.4% | |
| Wind | 195 | 294 | 294 | 294 | 329 | 389 | 825 |
| 4.4% | 6.5% | 6.5% | 8.5% | 9.4% | 3.5% | 6.7% | |
| Biomass / Geothermal | 127 | 127 | 127 | 127 | 127 | 585 | 438 |
| 2.9% | 2.8% | 2.8% | 3.7% | 3.6% | 5.2% | 3.5% | |
| Solar | 0.0 | 0.2 | 0.2 | 0.2 | 0.2 | 0.0 | 0.0 |
| 0.0% | 0.0% | 0.0% | 0.0% | 0.0% | 0.0% | 0.0% | |
| All Renewable Sources | 1 275 | 1 382 | 1 382 | 1 382 | 1 417 | 4 299 | 3 797 |
| 29.1% | 30.6% | 30.6% | 39.8% | 40.4% | 38.4% | 30.6% | |
| Nuclear | 680 | 705 | 705 | 705 | 705 | 0 | 4 874 |
| 15.5% | 15.6% | 15.6% | 20.3% | 20.1% | 0.0% | 39.3% | |
| Coal and Coke | 490 | 490 | 490 | 490 | 490 | 2 308 | 2 352 |
| 11.2% | 10.8% | 10.8% | 14.1% | 14.0% | 20.6% | 19.0% | |
| Natural Gas | 350 | 350 | 350 | 350 | 350 | 2 035 | 988 |
| 8.0% | 7.7% | 7.7% | 10.1% | 10.0% | 18.2% | 8.0% | |
| Oil and Diesel | 1 593 | 1 593 | 1 593 | 543 | 543 | 2 546 | 386 |
| 36.3% | 35.2% | 35.2% | 15.6% | 15.5% | 22.8% | 3.1% | |
| All Thermal Sources | 3 113 | 3 138 | 3 138 | 2 088 | 2 088 | 6 889 | 8 600 |
| 70.9% | 69.4% | 69.4% | 60.2% | 59.6% | 61.6% | 69.4% | |
| All Sources | 4 389 | 4 520 | 4 520 | 3 470 | 3 505 | 11 188 | 12 397 |
- Date modified: