Canada's Renewable Power – Manitoba

Manitoba
Manitoba is a hydroelectricity powerhouse. While some new wind and solar projects are expected in the near future, the Keeyask Project will add up to 695 MW of new hydroelectricity capacity when completed by 2021.
Generation Trends
Manitoba generates the vast majority of its electricity from its 15 hydro stations. In 2018, hydro generated 30 732 gigawatt-hours (GW.h), or 97.0% of Manitoba’s total electricity production. Hydro generation in Manitoba fell below the long-term average for the first time in 14 years in 2018 because of less favourable water conditions. Wind energy accounted for 873 GW.h, or 2.8% of Manitoba’s total energy production. In addition, with a very small amount from biomass, total renewable generation in 2018 was 31 651 GW.h, or 99.9% of total generation.
Manitoba is also a significant exporter of electricity to the United States (U.S.). In 2018, approximately 17% of Manitoba’s electricity generation was exported where it can displace the coal-fired generation that dominates the U.S. Midwest.
Manitoba’s non-renewable thermal generation is primarily natural gas-fired. Two natural gas facilities are used for peak demand in winter or emergency back-up generation. Diesel-fired facilities are located in remote communities in northern Manitoba that are not connected to the provincial electricity grid or a natural gas distribution line. Total thermal generation in 2018 was 44 GW.h, or 0.1% of total generation.
Total electricity generation in Manitoba declined from 33 757 GW.h in 2010 to 31 695 GW.h in 2018. Changes in Manitoba’s electricity generation mix are illustrated in Figure 1.
Figure 1. Electricity Generation in Manitoba
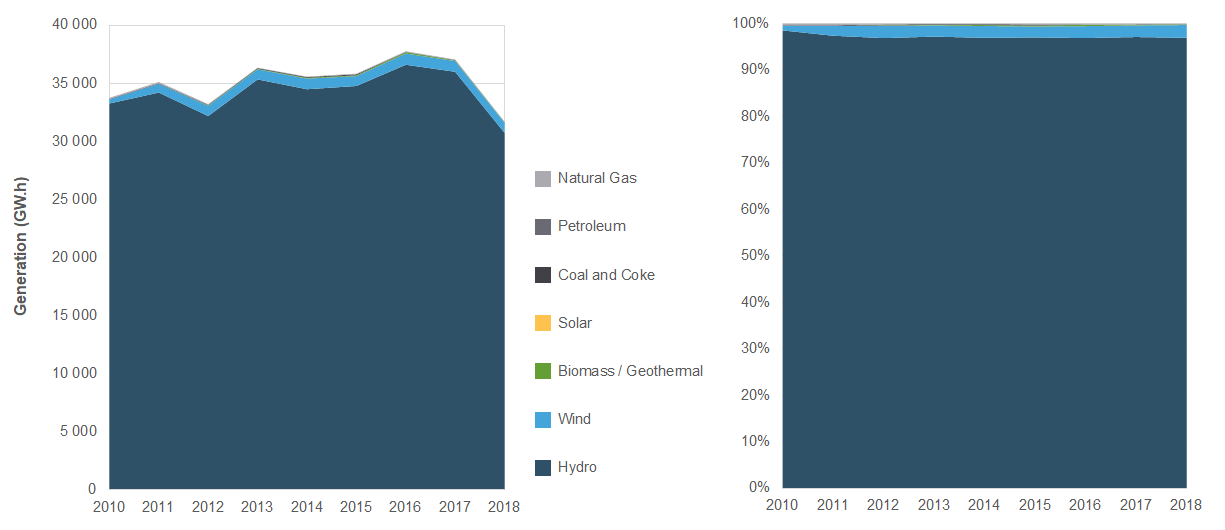
Source and Description
Source: CER – Canada’s Energy Future 2020 (EF2020)
Description: This graph illustrates electricity generation from 2010 to 2018 in Manitoba. In 2010, Manitoba’s total generation was 33 757 GW.h (99.6% renewable). In 2018, total generation was 31 695 GW.h (99.9% renewable).
GHG Emissions from Electricity Generation
In 2018, Manitoba’s electricity sector emitted 0.04 megatonnes of carbon dioxide equivalent (MT of CO2e). Manitoba’s generation intensity was 1.3 grams of CO2e per kilowatt-hour, tied with Quebec for the lowest in Canada.
Manitoba produced 0.1% of Canada’s total greenhouse gas emissions from electricity generation in 2018.
Recent and Projected Capacity Changes for Renewables
Between 2010 and 2017, Manitoba added a net 455 megawatts (MW) of renewable capacity, primarily in the form of hydro (296 MW). Between 2017 and 2023, Manitoba is projected to add 746 MW of new net renewable capacity. These capacity changes are illustrated in Figure 2 with data provided in Table 1.
Recent and future projects included in the projection are:
- Keeyask, a hydro project that is expected to add 695 MW in 2021.
- Fisher River Cree Nation Solar Farm, which added 1 MW in 2020.
- Provincial government mandates and targets of new wind add up to 60 MW by 2022.
In August 2018, the last coal-fired generating unit in Manitoba (Unit 5 at the Brandon Generating Station) ceased operation and is being used as a synchronous condenser. A synchronous condenser does not create electricity of its own, but rather it regulates grid voltage and helps stabilize the grid.
Figure 2. Electricity Capacity and Future Changes in Manitoba
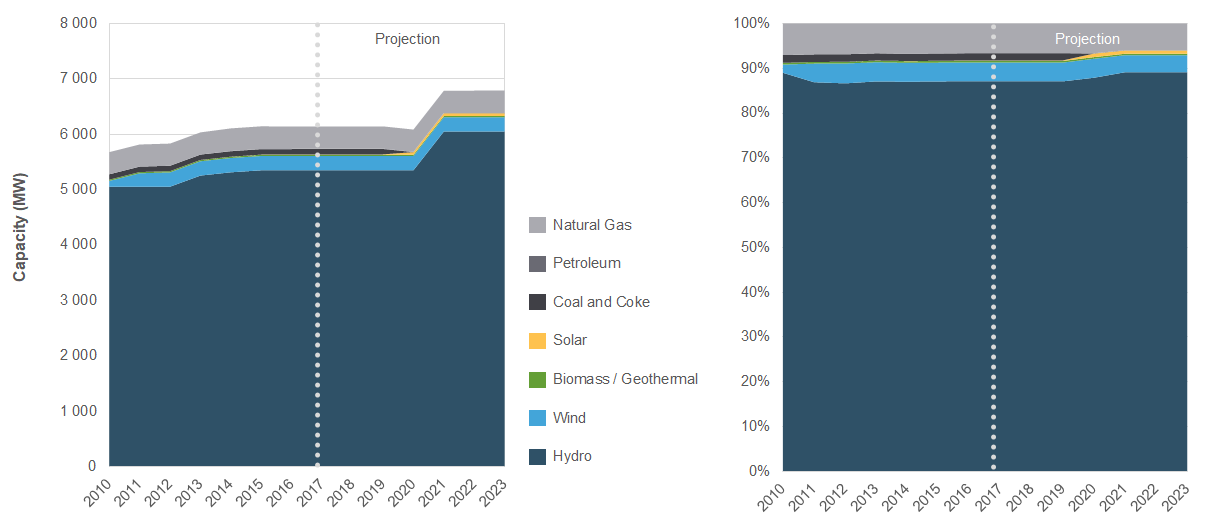
Source and Description
Source: CER – EF2020
Description: This graph illustrates historical electricity capacity from 2010 to 2017 in Manitoba and the CER’s projection of future capacity changes from 2018 to 2023. In 2010, Manitoba’s total installed electricity capacity was 5 677 MW (91.2% renewable). In 2017, capacity had grown to 6 140 MW (91.8% renewable). By 2023, total capacity is projected to grow to 6 788 MW (94.0% renewable).
Table 1. Electricity Capacity (2010 – 2023) and Generation (2010 and 2018) in Manitoba
| Capacity in MW and % | Generation in GW.h and % | ||||||
|---|---|---|---|---|---|---|---|
| 2010 | 2017 | 2018 | 2020 | 2023 | 2010 | 2018 | |
| ---------- Projected ---------- | |||||||
| Hydroelectricity | 5 054 | 5 349 | 5 349 | 5 349 | 6 049 | 33 269 | 30 732 |
| 89.0% | 87.1% | 87.1% | 87.9% | 89.1% | 98.6% | 97.0% | |
| Wind | 104 | 258 | 258 | 258 | 258 | 343 | 873 |
| 1.8% | 4.2% | 4.2% | 4.2% | 3.8% | 1.0% | 2.8% | |
| Biomass / Geothermal | 22 | 22 | 22 | 22 | 22 | 0 | 46 |
| 0.4% | 0.4% | 0.4% | 0.4% | 0.3% | 0.0% | 0.1% | |
| Solar | 0.0 | 5.0 | 6.0 | 48.0 | 51.0 | 0.0 | 0.0 |
| 0.0% | 0.1% | 0.1% | 0.8% | 0.8% | 0.0% | 0.0% | |
| All Renewable Sources | 5 180 | 5 635 | 5 636 | 5 678 | 6 381 | 33 612 | 31 651 |
| 91.2% | 91.8% | 91.8% | 93.3% | 94.0% | 99.6% | 99.9% | |
| Coal and Coke | 98 | 98 | 98 | 0 | 0 | 44 | 5 |
| 1.7% | 1.6% | 1.6% | 0.0% | 0.0% | 0.1% | 0.0% | |
| Natural Gas | 400 | 403 | 403 | 403 | 403 | 99 | 37 |
| 7.0% | 6.6% | 6.6% | 6.6% | 5.9% | 0.3% | 0.1% | |
| Oil and Diesel | 0 | 5 | 5 | 5 | 5 | 2 | 2 |
| 0.0% | 0.1% | 0.1% | 0.1% | 0.1% | 0.0% | 0.0% | |
| All Thermal Sources | 498 | 505 | 505 | 408 | 408 | 145 | 44 |
| 8.8% | 8.2% | 8.2% | 6.7% | 6.0% | 0.4% | 0.1% | |
| All Sources | 5 677 | 6 140 | 6 141 | 6 085 | 6 788 | 33 757 | 31 695 |
- Date modified: