Canada's Renewable Power – Ontario

Ontario

Ontario is a leader in renewables and nuclear. In 2018, over one-third of Ontario’s electricity generation was from renewables and over 92% was from non-emitting sources. Slower growth in new renewable capacity is expected over the medium-term, while substantial nuclear refurbishments are planned over the next decade.
Generation Trends
In 2010, Ontario generated roughly a quarter of its electricity from renewable sources (primarily hydro). By 2018, Ontario’s generation from renewables had grown by over 50%. Total renewable generation in 2018 was 54 732 gigawatt-hours (GW.h), or 34.8% of total generation.
Hydro remains the largest source of renewable electricity in Ontario, followed by wind, solar, and biomass. Combined, non-hydro renewables account for 16 451 GW.h, the largest in any province, and the second largest on a percentage of total generation basis (10.5%) after Prince Edward Island.
Ontario’s largest source for electricity is from its 18 nuclear reactors. Coal, once a significant source of electricity in the province, was phased out completely in 2014. Natural gas-fired generation is used primarily for peak periods, while diesel generators are used in remote communities in the northern and northwestern parts of the province. Total thermal generation in 2018 was 102 511 GW.h, or 65.2% of total generation.
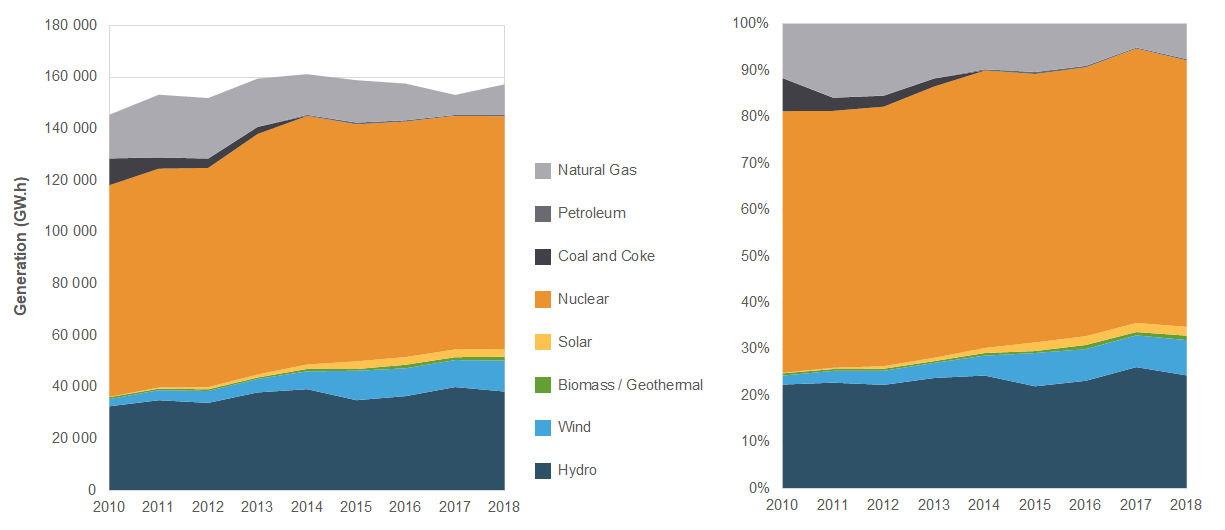
Total electricity generation in Ontario grew from 145 484 GW.h in 2010 to 157 243 GW.h in 2018. Changes in Ontario’s electricity generation mix are illustrated in Figure 1.
Figure 1. Electricity Generation in Ontario
Source and Description
Source: CER – Canada’s Energy Future 2020 (EF2020)
Description: This graph illustrates electricity generation from 2010 to 2018 in Ontario. In 2010, Ontario’s total generation was 145 484 GW.h (24.9% renewable). In 2018, total generation was 157 243 GW.h (34.8% renewable).
GHG Emissions from Electricity Generation
In 2018, Ontario’s electricity sector emitted 4.4 megatonnes of carbon dioxide equivalent (MT of CO2e). Ontario’s generation intensity was 29 grams of CO2e per kilowatt-hour.
Ontario produced 6.4% of Canada’s total greenhouse gas emissions from electricity generation in 2018.
Recent and Projected Capacity Changes for Renewables
Between 2010 and 2017, Ontario added a net 7 152 megawatts (MW) of renewable capacity, primarily in wind (3 668 MW) and solar (2 299 MW). Between 2017 and 2023, Ontario is projected to add 466 MW of new net renewable capacity. This is a significant slowdown in the pace of development for new renewables in the province. These capacity changes are illustrated in Figure 2 with data provided in Table 1.
Recent and future projects included in the projection are:
- Belle River Wind, which added 100 MW in 2017.
- North Kent Wind, which added 100 MW in 2017.
- Amherst Island Wind Project, which added 75 MW in 2017.
- Henvey Inlet Wind Project, which added 300 MW in 2019.
- Nations Rise Wind Farm, which is expected to add 100 MW in 2021.
- Peter Sutherland Sr. Hydro Station, which added 28 MW in 2017.
- Provincial government mandates and targets that added up to 180 MW of new FIT solar by 2017.
- Nanticoke Solar, which added 44 MW in 2019.
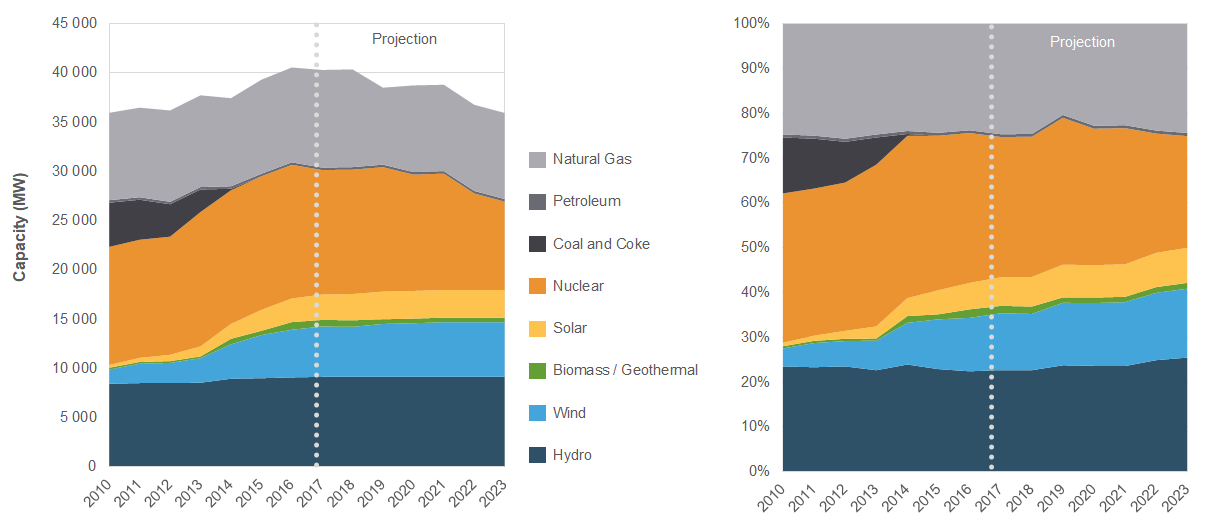
Figure 2. Electricity Capacity and Future Changes in Ontario
Source and Description
Source: CER – EF2020
Description: This graph illustrates historical electricity capacity from 2010 to 2017 in Ontario and the CER’s projection of future capacity changes from 2018 to 2023. In 2010, Ontario’s total installed electricity capacity was 35 968 MW (28.8% renewable). In 2017, capacity had grown to 40 325 MW (43.5% renewable). By 2023, total capacity is projected to decline to 35 957 MW (50.0% renewable).
Ontario has the most installed solar capacity in Canada with 2 771 MW in 2017. This represents 6.8% of total installed capacity in the province. Growth of 235 MW is projected in solar between 2017 and 2023, a sharp contrast from the rapid growth of 2 299 MW that occurred between 2010 and 2017.
Ontario also has the largest fleet of nuclear reactors in Canada with an estimated installed capacity of 12 633 MW in 2017. Ontario’s reactors provide reliable, non-emitting baseload generation for the province. Significant nuclear refurbishments are occurring at Darlington over the next 10 years. Bruce Power also began its Major Component Replacement Project in 2020 that will involve the replacement of key reactor components in six of its units. This refurbishment project is expected to last until 2033.
The Pickering Nuclear Generating Station is expected to retire in the mid-2020s. Pickering is Canada’s oldest commercial nuclear generating facility and the retirement will result in the loss of over 3 100 MW of nuclear generating capacity for Ontario.
In total, Ontario’s nuclear generating capacity is projected to decline 3 665 MW between 2017 and 2023. A longer term projection of Ontario’s nuclear generating capacity can be found in Canada’s Energy Future 2020.
Table 1. Electricity Capacity (2010 – 2023) and Generation (2010 and 2018) in Ontario
| Capacity in MW and % | Generation in GW.h and % | ||||||
|---|---|---|---|---|---|---|---|
| 2010 | 2017 | 2018 | 2020 | 2023 | 2010 | 2018 | |
| ---------- Projected ---------- | |||||||
| Hydroelectricity | 8 463 | 9 161 | 9 161 | 9 171 | 9 171 | 32 555 | 38 281 |
| 23.5% | 22.7% | 22.7% | 23.7% | 25.5% | 22.4% | 24.3% | |
| Wind | 1 447 | 5 115 | 5 076 | 5 436 | 5 536 | 2 800 | 11 964 |
| 4.0% | 12.7% | 12.6% | 14.0% | 15.4% | 1.9% | 7.6% | |
| Biomass / Geothermal | 180 | 665 | 665 | 465 | 465 | 735 | 1 500 |
| 0.5% | 1.7% | 1.6% | 1.2% | 1.3% | 0.5% | 1.0% | |
| Solar | 281 | 2 580 | 2 669 | 2 815 | 2 815 | 123 | 2 988 |
| 0.8% | 6.4% | 6.6% | 7.3% | 7.8% | 0.1% | 1.9% | |
| All Renewable Sources | 10 371 | 17 523 | 17 573 | 17 888 | 17 988 | 36 213 | 54 732 |
| 28.8% | 43.5% | 43.5% | 46.2% | 50.0% | 24.9% | 34.8% | |
| Nuclear | 11 990 | 12 633 | 12 633 | 11 808 | 8 968 | 81 975 | 90 155 |
| 33.3% | 31.3% | 31.3% | 30.5% | 24.9% | 56.3% | 57.3% | |
| Coal and Coke | 4 487 | 0 | 0 | 0 | 0 | 10 337 | 0 |
| 12.5% | 0.0% | 0.0% | 0.0% | 0.0% | 7.1% | 0.0% | |
| Natural Gas | 8 871 | 9 919 | 9 919 | 8 804 | 8 751 | 16 886 | 11 893 |
| 24.7% | 24.6% | 24.6% | 22.7% | 24.3% | 11.6% | 7.6% | |
| Oil and Diesel | 249 | 250 | 250 | 250 | 250 | 73 | 463 |
| 0.7% | 0.6% | 0.6% | 0.6% | 0.7% | 0.1% | 0.3% | |
| All Thermal Sources | 25 597 | 22 802 | 22 802 | 20 862 | 17 969 | 109 271 | 102 511 |
| 71.2% | 56.5% | 56.5% | 53.8% | 50.0% | 75.1% | 65.2% | |
| All Sources | 35 968 | 40 325 | 40 375 | 38 750 | 35 957 | 145 484 | 157 243 |
- Date modified: