ARCHIVED – National Energy Board – 2017–18 Departmental Results Report – Analysis of trends in spending and human resources
This page has been archived on the Web
Information identified as archived is provided for reference, research or recordkeeping purposes. It is not subject to the Government of Canada Web Standards and has not been altered or updated since it was archived. Please contact us to request a format other than those available.
Actual expenditures
Departmental spending trend graph
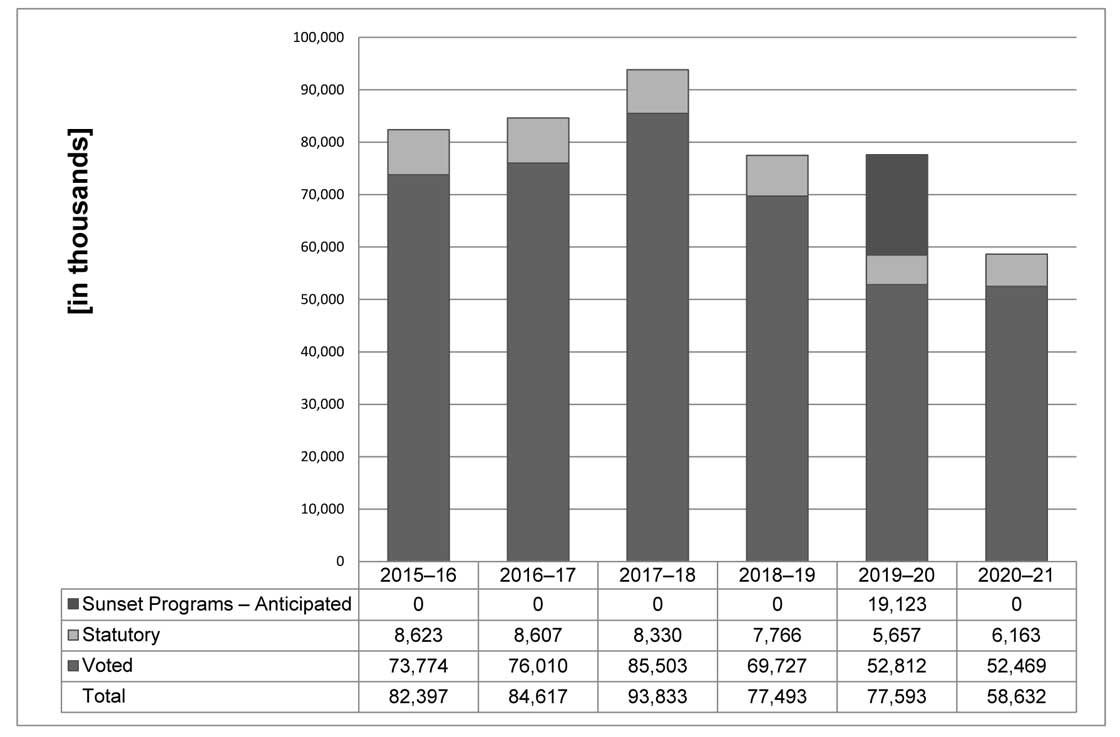
Fiscal years 2015–16 to 2017–18 reflect the department’s actual expenditures as reported in the Public Accounts. Fiscal years 2018–19 to 2020–21 represent planned spending.
The overall trend in the graph above illustrates a decrease in spending from 2015–16 to 2020–21 with an increase for 2016–17 and 2017–18. The spending in 2016–17 reflects enhanced safety and oversight activity, including enhanced engagement, announced in Budget 2015. The spending in 2017–18 primarily reflects the increased cost of the collective agreement and retro payments and Budget 2017 Pipeline Safety Lifecycle Oversight.
From 2018–19 to 2019–20, overall departmental spending is planned to increase by $100,000 which is attributed to a transfer for fiscal years 2017–18 through 2018–19 from the National Energy Board to the Department of Natural Resources to support a contribution for research on promoting a safety culture in regulatory bodies. From 2019–20 to 2020–21, overall departmental spending is planned to decrease by $19.0M which is attributed to the expiration of temporary (sunsetting) funding. This includes a:
- Decrease of $13.3M in funding related to Budget 2015 Energy Transportation Infrastructure;
- Decrease of $5.3M in funding related to Budget 2017 Pipeline Safety Lifecycle Oversight;
- Decrease of $0.6M in funding related to Budget 2017 Communication and Access to Information Capacity.
The NEB is funded through Parliamentary appropriations. The Government of Canada currently recovers approximately 97% of the appropriation from the industry the Board regulates. All collections from cost recovery invoices are deposited to the account the Receiver General for Canada and credited to the Consolidate Revenue Fund.
Pipeline and power line companies regulated by the NEB (authorized under the NEB Act) are subject to cost recovery. Applications before the Board for new facilities are not subject to cost recovery until the facility is placed into service, unless the company does not have any prior facilities regulated by the Board in which case a one-time levy is assessed following the authorization of construction.
Cost recovery is carried out on a calendar year basis.
| Core Responsibilities and Internal Services | 2017–18 Main Estimates |
2017–18 Planned spending |
2018–19 Planned spending |
2019–20 Planned spending |
2017–18 Total authorities available for use |
2017–18 Actual spending (authorities used) |
2016–17 Actual spending (authorities used) |
2015–16 Actual spending (authorities used) |
|---|---|---|---|---|---|---|---|---|
| Energy RegulationTable Note a | 0 | 0 | 0 | 0 | 0 | 0 | 40,961,325 | 45,842,289 |
| Energy Adjudication | 28,225,875 | 28,333,982 | 20,000,175 | 20,000,175 | 31,553,311 | 24,293,849 | 0 | 0 |
| Safety and Environment Oversight | 22,559,815 | 22,807,608 | 26,151,718 | 26,151,718 | 31,877,647 | 23,004,346 | 0 | 0 |
| Energy Information | 5,365,717 | 7,289,921 | 4,931,394 | 4,931,394 | 8,311,633 | 10,444,458 | 6,125,216 | 7,190,780 |
| Engagement | 3,727,165 | 2,528,944 | 6,462,601 | 6,462,601 | 4,640,405 | 4,898,235 | 0 | 0 |
| Subtotal | 59,878,572 | 60,960,455 | 57,545,888 | 57,545,888 | 76,382,996 | 62,640,888 | 47,086,541 | 53,033,069 |
| Internal Services | 19,961,413 | 18,879,531 | 19,946,812 | 20,046,812 | 22,187,323 | 31,192,102 | 37,530,277 | 29,363,499 |
| Total | 79,839,985 | 79,839,986 | 77,492,700 | 77,592,700 | 98,570,319 | 93,832,990 | 84,616,818 | 82,396,568 |
Variance between 2017–18 Planned Spending and 2017–18 Actual Spending
The NEB’s Actual Spending for fiscal year 2017–18 was $14.0M higher than the Planned Spending. The increase is primarily due to the following:
- an increase of $6.6M for the wage increase in the collective agreement and retro payments;
- an Operating Budget Carry Forward of $3.8M;
- an increase of $7.3M in Supplementary Estimates primarily for Pipeline Safety Lifecycle Oversight (Budget 2017);
- a decrease of $2.9M in participant funding for the Energy East hearings.
Variance between 2016–17 Actual Spending and 2015–16 Actual Spending
The NEB’s Actual Spending for 2016–17 was $2.2M higher than the prior fiscal year primarily due to increased spending on activities supported by temporary funding announced for safety and enhanced public engagement activities.
Variance between 2017–18 Actual Spending and 2016–17 Actual Spending
The NEB’s Actual Spending for fiscal year 2017–18 was $9.2M higher than the prior fiscal year due, in large part, to the wage increase in the collective agreement and retro payments, and the Pipeline Safety Lifecycle Oversight (Budget 2017).
Actual human resources
| Core Responsibilities and Internal Services |
2015–16 Actual |
2016–17 Actual |
2017–18 Planned |
2017–18 Actual |
2018–19 Planned |
2019–20 Planned |
|---|---|---|---|---|---|---|
| Energy RegulationTable Note a | 251.5 | 276.7 | 0 | 0 | 0 | 0 |
| Energy Adjudication | 0 | 0 | 121.2 | 125.7 | 118.3 | 118.3 |
| Safety and Environment Oversight | 0 | 0 | 141.2 | 124.5 | 143.2 | 143.2 |
| Energy Information | 48.1 | 37.3 | 41.4 | 55.5 | 36.9 | 36.9 |
| Engagement | 0 | 0 | 15.5 | 24.0 | 23.0 | 23.0 |
| Subtotal | 299.6 | 314.0 | 319.3 | 329.7 | 321.4 | 321.4 |
| Internal Services | 157.9 | 160.5 | 133.6 | 151.6 | 143.1 | 143.1 |
| Total | 457.5 | 474.5 | 452.9 | 481.3 | 464.5 | 464.5 |
Expenditures by vote
For information on the NEB’s organizational voted and statutory expenditures, consult the Public Accounts of Canada 2017–2018.
Government of Canada spending and activities
Information on the alignment of the NEB’s spending with the Government of Canada’s spending and activities is available in the GC InfoBase.
Financial statements
The NEB’s financial statements for the year ended March 31, 2018, are available on the NEB websiteFootnote 1.
Financial statements highlights
The National Energy Board operates on a full accrual accounting basis according to Treasury Board’s policy for reporting based on generally accepted accounting principles (GAAP). The tables below provide highlights from the NEB’s Statement of Operations and Statement of Financial Position, as presented in its 2017–18 financial statements. As such, differences do exist between these tables and those presented in other sections of the Departmental Results Report, which are prepared on the modified cash basis of accounting.
| Financial information | 2017–18 Planned results |
2017–18 Actual results |
2016–17 Actual results |
Difference (2017–18 Actual results minus 2017–18 Planned results) |
Difference 2017–18 Actual results minus 2016–17 Actual results) |
|---|---|---|---|---|---|
| Total expenses | 96,328,839 | 107,121,711 | 97,987,071 | 10,792,872 | 9,134,640 |
| Total revenues | – | – | – | – | – |
| Net cost of operations before government funding and transfers |
96,328,839 | 107,121,711 | 97,987,071 | 10,792,872 | 9,134,640 |
Difference between 2017–18 actual and 2017–18 planned
The department's actual net cost of operations before Government funding and transfer in 2017–18 was $10.79M more than the planned results for the same fiscal year. The net increase is primarily due to an increase of $5.2M related to retroactive payments as a result of collective agreement renewal, an increase of $1.9M related to Employee Benefit Plan, an increase of $6.3M related to Budget 2017, along with a decrease of $2.9M related to Participation Funding Program from Budget 2016.
Difference between 2017–18 actual and 2016–17 actual
The department's actual net cost of operations before Government funding and transfer in 2017–18 was $9.1M more than the previous year. The increase is primarily due to an increase of $1.8M in Participate Funding Program (related to Energy East); an increase of $3.9M in retroactive payments as a result of collective agreement renewal, an increase of $1.0M related to severance and leave allowance provision; an increase of $1.5M in professional services mainly related to data visualization, applications and a business process review; and, an increase of $0.7M amortization mainly related to IT hardware and software.
| Financial Information | 2017–18 | 2016–17 | Difference (2017–18 minus 2016–17) |
|---|---|---|---|
| Total net liabilities | 34,687,036 | 34,259,052 | 427,984 |
| Total net financial assets | 24,924,941 | 22,656,539 | 2,268,402 |
| Departmental net debt | 9,762,095 | 11,602,513 | (1,840,418) |
| Total non-financial assets | 20,733,080 | 22,793,552 | (2,060,472) |
| Departmental net financial position | 10,970,985 | 11,191,039 | (220,054) |
Total net financial assets has an increase of $2.3M compared to 2016–17. The increases are mainly attributed to $3.9M related to retroactive payment accrual and a $1M inter-government transaction due to year end employee benefit plan payable set up; these increases were offset by a decrease of $2.0M related to billing adjustment and a decrease of $0.5M mainly related to OGD accounts payable. Total non-financial assets have a decrease of $2.1M compared to 2016–17, primarily due to net decrease of leasehold improvement.
- Date modified: