Canada Energy Regulator – 2023–24 Departmental Plan – Planned spending and human resources
This section provides an overview of the department’s planned spending and human resources for the next three fiscal years and compares planned spending for 2023–24 with actual spending for the current year and the previous year.
Planned spending
Departmental spending 2020–21 to 2025–26
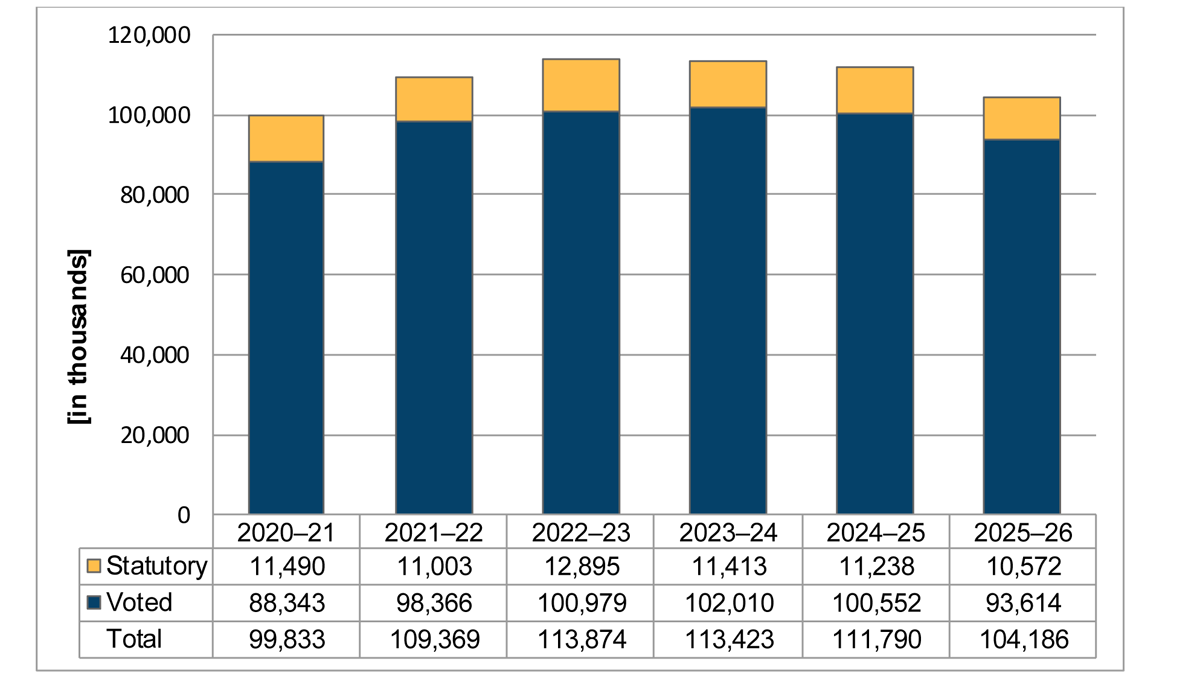
The following graph presents planned spending (voted and statutory expenditures) over time.
Description of this graph
Departmental Spending 2020–21 to 2025–26
This bar chart shows the Canada Energy Regulator’s six-year spending trend. It includes actual spending for the fiscal years 2020–21 and 2021–22, forecast spending for the year 2022–23 and planned spending for the years 2023–24 to 2025–26.
Actual Spending by period is as follows:
- 2020–21: $99,833
- 2021–22: $109,369
Forecast Spending by period is as follows:
- 2022–23: $113,874
Planned Spending by period is as follows:
- 2023–24: $113,423
- 2024–25: $111,790
- 2025–26: $104,186
This bar chart shows the Canada Energy Regulator’s six-year spending trend. It includes actual spending for the fiscal years 2020–21 and 2021–22, forecast spending for the year 2022–23 and planned spending for the years 2023–24 to 2025–26. Amounts are depicted by Voted and Statutory amounts. An explanation of spending variances follows below the Budgetary planning summary for core responsibilities and internal services table.
Budgetary planning summary for core responsibilities and internal services (dollars)
The following table shows information on spending for each of the CER’s core responsibilities and for its internal services for 2023–24 and other relevant fiscal years.
Core responsibilities and internal services |
2020–21 |
2021–22 |
2022–23 |
2023–24 budgetary spending |
2023–24 |
2024–25 |
2025–26 |
|---|---|---|---|---|---|---|---|
Energy Adjudication |
20,864,381 |
17,722,847 |
23,944,189 |
27,016,679 |
27,016,679 |
26,705,288 |
26,705,288 |
Safety and Environment Oversight |
23,152,134 |
24,544,585 |
26,689,580 |
23,671,971 |
23,671,971 |
23,087,801 |
22,735,465 |
Energy Information |
5,934,378 |
8,716,482 |
7,550,398 |
8,607,939 |
8,607,939 |
8,607,939 |
5,276,489 |
Engagement |
9,611,208 |
8,732,565 |
9,167,132 |
10,149,308 |
10,149,308 |
9,413,045 |
9,413,046 |
Subtotal |
59,562,101 |
59,716,479 |
67,351,299 |
69,445,897 |
69,445,897 |
67,814,073 |
64,130,288 |
Internal services |
39,028,902 |
49,652,874 |
46,522,538 |
43,976,647 |
43,976,647 |
43,976,306 |
40,055,231 |
Internal Services – GIC Remission LevyTable Note a |
1,241,925 |
– |
– |
– |
– |
– |
– |
Total |
99,832,928 |
109,369,353 |
113,873,837 |
113,422,544 |
113,422,544 |
111,790,379 |
104,185,519 |
Variance between 2020–21 actual expenditures and 2021–22 actual expenditures
The 2021–22 actual spending is $9.54 million higher than the 2020–21 actual spending, and the variance is primarily due to:
- an increase of $4.58 million related to compensation adjustments to reflect changes to terms and conditions of service or employment in the federal public administration;
- an increase of $2.98 million mainly related to a Budget 2020 initiative to improve the CER’s ability to interpret and make data available digitally to Canadians;
- an increase of $2.10 million related to a Budget 2018 initiative to transition to new impact assessment and regulatory processes;
- an increase of $0.76 million related to employee benefit plan costs;
- an increase of $0.29 million mainly related to the SAP implementation project;
- an increase of $0.07 million related to Budget 2017 Indigenous Advisory and Monitoring Committees as well as communications and access to information capacity; and
- a decrease of $1.24 million mainly related to the remission of a levy to Vector Pipeline Limited Partnership in fiscal year 2020–21.
Variance between 2021–22 actual expenditures and 2022–23 forecast spending
The 2022–23 forecast spending is $4.50 million higher than the 2021–22 actual expenditures mainly due to:
- an increase of $2.69 million related to Budget 2022 funding to continue to enable data-driven, evidence-based impact assessments, as well as Indigenous Advisory and Monitoring Committees;
- an increase of $2.24 million related to compensation adjustments to reflect changes to terms and conditions of service or employment in the federal public administration;
- an increase of $1.89 million related to employee benefit plans;
- an increase of $0.95 million related to Participant Funding Program;
- a decrease of $1.41 million related to a Budget 2018 initiative to transition to new impact assessment and regulatory processes;
- a decrease of $1.21 million related to a Budget 2020 initiative to improve the CER’s ability to interpret and make data available digitally to Canadians; and
- a decrease of $0.65 million related to Budget 2017 Indigenous Advisory and Monitoring Committees as well as communications and access to information capacity.
Variance between 2022–23 forecast spending and 2023–24 planned spending
The 2023–24 planned spending is $0.45 million lower than the 2022–23 forecast spending mainly due to:
- a decrease of $11.47 million mainly related to compensation adjustments to reflect changes to terms and conditions of service or employment in the federal public administration;
- a decrease of $1.48 million related to employee benefit plans;
- an increase of $5.86 million related to Budget 2022 funding to continue to enable data-driven, evidence-based impact assessments;
- an increase of $3.05 million related to a Budget 2018 initiative to transition to new impact assessment and regulatory processes;
- an increase of $2.44 million related to a Budget 2020 initiative to improve the CER’s ability to interpret and make data available digitally to Canadians; and
- an increase of $1.15 million related to Budget 2022 Indigenous Advisory and Monitoring Committees as well as communications and access to information capacity.
Variance between 2023–24 planned spending and 2024–25 planned spending
The 2024–25 planned spending is $1.63 million lower than the 2023–24 planned spending primarily related to Budget 2022 Indigenous Advisory and Monitoring Committees.
Variance between 2024–25 planned spending and 2025–26 planned spending
The 2025–26 planned spending is $7.60 million lower than the 2024–25 planned spending primarily related to Budget 2020 initiative to improve the CER’s ability to interpret and make data available digitally to Canadians.
The CER is funded through Parliamentary appropriations. The Government of Canada currently recovers a large majority of the appropriation from the industry the CER regulates. All collections from cost recovery invoices are deposited to the account of the Receiver General for Canada and credited to the Consolidated Revenue Fund.
Pipeline and power line companies that hold authorizations under the CER Act are subject to cost recovery. Applications before the CER for new facilities are not subject to cost recovery until the facility is placed into service, unless the company does not have any prior facilities regulated by the CER in which case a one-time levy is assessed following the authorization of construction.
Cost recoveryFootnote 46 is carried out on a calendar year basis.
Planned human resources
The following table shows information on human resources, in full-time equivalents (FTEs), for each of the CER’s core responsibilities and for its internal services for 2023–24 and the other relevant years.
Human resources planning summary for core responsibilities and internal services
Core responsibilities and internal services |
2020–21 |
2021–22 |
2022–23 |
2023–24 |
2024–25 |
2025–26 |
|---|---|---|---|---|---|---|
Energy Adjudication |
129.4 |
104.1 |
114.5 |
126.5 |
124.5 |
124.5 |
Safety and Environment Oversight |
142.5 |
150.7 |
162.1 |
135.0 |
131.0 |
128.0 |
Energy Information |
30.4 |
48.2 |
46.3 |
56.1 |
56.1 |
31.1 |
Engagement |
56.9 |
51.4 |
59.5 |
51.1 |
48.1 |
48.1 |
Subtotal |
359.2 |
354.4 |
382.4 |
368.7 |
359.7 |
331.7 |
Internal services |
162.4 |
204.3 |
215.8 |
188.3 |
187.3 |
181.3 |
Total |
521.6 |
558.7 |
598.2 |
557.0 |
547.0 |
513.0 |
Variance between 2020–21 actual full-time equivalents and 2021–22 actual full-time equivalents
The increase of 37.1 2021–22 actual full-time equivalents from 2020–21 actual full-time equivalents is primarily due to:
- an increase of 19.0 full-time equivalents related to changes across the organization to meet operational requirements;
- an increase of 14.9 full-time equivalents related to a Budget 2020 initiative to improve the CER’s ability to interpret and make data available digitally to Canadians;
- an increase of 4.3 full-time equivalents related to a Budget 2018 initiative to transition to new impact assessment and regulatory processes; and
- a decrease of 1.1 full-time equivalents related to Budget 2017 Indigenous Advisory and Monitoring Committees.
Variance between 2021–22 actual full-time equivalents and 2022–23 forecast full-time equivalents
The increase of 39.5 2022–23 forecast full-time equivalents from 2021–22 actual full-time equivalents is primarily due to:
- an increase of 22.5 related to Budget 2022 funding to continue to enable data-driven, evidence-based impact assessments;
- an increase of 9.2 full-time equivalents related to a Budget 2018 initiative to transition to new impact assessment and regulatory processes;
- an increase of 5.2 full-time equivalents related to a Budget 2020 initiative to improve the CER’s ability to interpret and make data available digitally to Canadians; and
- an increase of 2.6 full-time equivalents related to Budget 2022 Indigenous Advisory and Monitoring Committees.
Variance between 2022–23 forecast full-time equivalents and 2023–24 planned full-time equivalents
The decrease of 41.2 2023–24 planned full-time equivalents from 2022–23 forecast full-time equivalents is primarily due to a Budget 2018 initiative to transition to new impact assessment and regulatory processes and changes across the organization to meet operational requirements.
Variance between 2023–24 planned full-time equivalents and 2024–25 planned full-time equivalents
The decrease of 10 2024–25 planned full-time equivalents from 2023–24 planned full-time equivalents is primarily related to Budget 2017 Indigenous Advisory and Monitoring Committees.
Variance between 2024–25 planned full-time equivalents and 2025–26 planned full-time equivalents
The decrease of 2025–26 planned 34 full-time equivalents from 2024–25 planned full-time equivalents is primarily related to Budget 2020 initiative to improve the CER’s ability to interpret and make data available digitally to Canadians.
Estimates by vote
Information on the CER’s organizational appropriations is available in the 2023–24 Main Estimates.Footnote 47.
Future-oriented condensed statement of operations
The future-oriented condensed statement of operations provides an overview of the CER’s operations for 2022–23 to 2023–24.
The forecast and planned amounts in this statement of operations were prepared on an accrual basis. The forecast and planned amounts presented in other sections of the Departmental Plan were prepared on an expenditure basis. Amounts may therefore differ.
A more detailed future-oriented statement of operations and associated notes, including a reconciliation of the net cost of operations with the requested authorities, are available on the CER’s websiteFootnote 48.
Future oriented condensed statement of operations for the year ending March 31, 2024 (dollars)
Financial information |
2022–23 |
2023–24 |
Difference |
|---|---|---|---|
Total expenses |
132,657,892 |
132,206,601 |
(451,291) |
Total revenues |
– |
– |
– |
Net cost of operations before government funding and transfers |
132,657,892 |
132,206,601 |
(451,291) |
Variance between 2022–23 forecast results and 2023–24 planned results
The 2023–24 planned results are $0.45 million lower than the 2022–23 forecast results mainly due to:
- a decrease of $11.47 million mainly related to compensation adjustments to reflect changes to terms and conditions of service or employment in the federal public administration;
- a decrease of $1.48 million related to employee benefit plans;
- an increase of $5.86 million related to Budget 2022 funding to continue to enable data-driven, evidence-based impact assessments;
- an increase of $3.05 million related to a Budget 2018 initiative to transition to new impact assessment and regulatory processes;
- an increase of $2.44 million related to a Budget 2020 initiative to improve the CER’s ability to interpret and make data available digitally to Canadians; and
- an increase of $1.15 million related to Budget 2022 Indigenous Advisory and Monitoring Committees as well as communications and access to information capacity.
- Date modified: