ARCHIVED - Canada’s Energy Transition: Historical and Future Changes to Energy Systems – Update – An Energy Market Assessment

5. Trends in Canada’s Energy Transition
Canada’s energy transition is occurring in many different areas of the economy and is influenced by various technologies, policies, and market trends. This chapter will discuss three fundamental components of the transition with respect to how Canadians produce and consume energy:Footnote 29
- The decarbonization of electricity – phasing out carbon-emitting electricity generation and increasing non-emitting sources, such as renewables, biofuels, nuclear, and carbon capture and storage.
- Electrification, fuel-switching, and improving the transportation sector – switching carbon-intensive end uses to less intensive or non-emitting fuels, especially in the transportation sector.
- Improving energy efficiency and behavioural changes – improvements to how and when we use energy, and shifting to less energy-intensive activities.
The Decarbonization of Electricity
THE CHALLENGE OF RENEWABLES
Is it possible for an electricity sector to be 100% renewable based? It is a frequently raised issue.
While some regions and nations, such as Yukon, B.C., Quebec, Costa Rica, and Iceland have virtually all of their power coming from renewables, that power is primarily from reservoir hydroelectricity – a consequence of climate and geography. Reservoir hydro is reliable, storable, and incredibly efficient at converting stored energy into electricity.
By contrast, new renewables, such as power from solar and wind, are not as easily (or economically) stored and are not as reliable. Wind speeds often do not match demand periods, and solar only generates when the sun is shining. Run-of-the-river hydro (common in the Northwest Territories) also has limited storage capabilities, and outputs cannot be scaled to meet demand.
A diverse energy supply mix with traditional thermal generation for back-up, battery storage, a modern grid, and grid connections to other regions can mitigate or eliminate many of the challenges associated with new renewables.
Canada’s electricity generating sector greatly benefits from geography. For a country of its size and population, nearly 80% of generation can be considered non-emitting. Hydroelectricity forms the backbone of the electricity sectors in many provinces and regions, including Yukon, British Columbia (B.C.), Manitoba, Quebec, and Newfoundland and Labrador. In Ontario, nuclear and hydroelectricity dominate.
The OECD average generation intensity was 448 grams of CO2 per kilowatt hour (kW.h) in 2012. By comparison, Canada’s average generation intensity was 160 grams of CO2 per kW.h.Footnote 30 However, Canada’s relatively low national average blurs many of the details of provincial-level generation intensity.
Several provinces, including Alberta, Saskatchewan, Nova Scotia, and New Brunswick, generate a significant amount of their electricity from the combustion of fossil fuels.Footnote 31 In 2017, these four provinces together generated 93% of Canada’s GHG emissions from electricity while generating only 20% of Canada’s electricity. Figure 10 illustrates the large variability in generation intensity between provinces and territories. In 2017, Quebec averaged 1.3 grams of CO2 per kW.h while Alberta averaged 750 grams of CO2 per kW.h.
Figure 10 also illustrates that between 1990 and 2016, nearly all jurisdictions in Canada have increased their electricity generation. However, nearly all jurisdictions have managed to lower their generation intensity at the same time. This trend is expected to continue as emissions from coal are either phased out or captured through carbon capture and storage (CCS), and renewable energy growth continues.
Figure 10: Total Electricity Generation and Generation Intensity by Province, 1990 vs. 2017
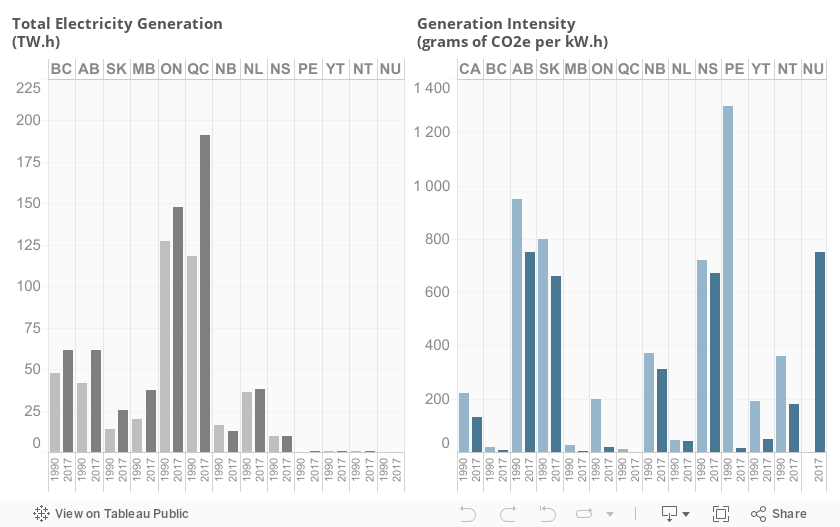
Source: ECCC – National Inventory Report 1990-2017
Description:
These two column charts illustrate trends in Canada’s electricity generation sector. In the first chart, all jurisdictions (with the exception of New Brunswick and Yukon) had higher generation in 2017 from 1990 levels. The top three generating provinces in 2017 were Quebec, Ontario, and Alberta.
The second chart illustrates the generate intensity in grams of CO2e per kW.h between 1990 and 2017. All jurisdictions decreased their generation intensity between 1990 and 2017. Most notably, Ontario’s phase-out of coal resulted in its emissions intensity declining from 200 grams of CO2e per kW.h in 1990 to 17 grams of CO2e per kW.h in 2017. This resulted in Ontario’s GHG emissions from electricity generation declining from 25.8 MT of CO2e in 1990 to 2.5 MT of CO2e in 2017.
Notes: Nunavut separated from Northwest Territories (NWT) in 1999, therefore no separate data for Nunavut exists prior to that date. Data from NWT in 1990 includes Nunavut. Prince Edward Island’s generation data from 1990 includes diesel-fired generation that results in a very high generation intensity figure. By 2017, 25% of PEI’s electricity needs were met by local (primarily wind-based) production. The remaining 75% was imported from New Brunswick, which generates primarily from a mix of nuclear, coal, hydro, and natural gas.
WHAT IS CARBON CAPTURE AND STORAGE?
The OECD notes that Canada has become a world leader in CCS technology. CCS is a method of capturing CO2 emissions from a large emitting power plant or industrial facility and injecting a pure stream of it into an underground reservoir at high pressure. These underground reservoirs can be a depleted oil or gas field, or a salt cavern. In some instances, the injected CO2 may aid in the recovery of crude oil (known as enhanced oil recovery).
CCS technology has been used in Canada since 2014 with the development of SaskPower’s Boundary Dam coal-fired project in Estevan, Saskatchewan. Since Boundary Dam, CCS has been used in Alberta with Shell’s Quest project, which captures CO2 from oil sands upgrading processes. Lastly, the Alberta Carbon Trunk Line (ACTL) is expected to begin operation in late 2019. ACTL will pipe and store CO2 from the newly constructed Sturgeon Refinery and the Nutrien fertilizer plant, both located near Redwater, Alberta.
The combined capacity of major CCS projects in Canada has the potential to reduce Canada’s CO2 emissions by 6.4 million tonnes per year, representing 3% of the reduction needed to meet Canada’s 2030 target.
Though coal and natural gas still dominate Alberta and Saskatchewan’s electricity mix, both provinces have been steering away from coal and towards natural gas for new thermal generation. Both provinces have also increased non-hydro renewable generation too. Alberta’s total generation from wind increased from 1.1% in 2005 to 5.4% in 2017. Alberta has the third-highest wind generation in Canada after Quebec and Ontario. Wind power has also grown in Saskatchewan, from 0.5% of total generation in 2005 to 3.8% in 2017. Additionally, southern Saskatchewan and southern Alberta have some of the highest photovoltaic (PV) potential in Canada. Saskatchewan has committed to 60 MW of solar power by 2021.Footnote 32 Alberta has 17 MW of utility-scale solar PV installed, with over 500 MW proposed for completion by 2020. With the cost of solar PV modules continuing to decline, there could be a strong future ahead for solar as a resource in Saskatchewan and Alberta.Footnote 33
The growth of non-hydro renewables for Canada as a whole over the past decade has been notable, as shown in Figure 11.Footnote 34 Between 2005 and 2017, roughly 16 gigawatts (GW) of non-hydro renewable capacity has been added to Canada’s electricity mix. The key drivers behind this have been a combination of policy changes and market forces (for example, declining costs).
Figure 11: Installed Electricity Capacity in Canada, 2005 – 2017
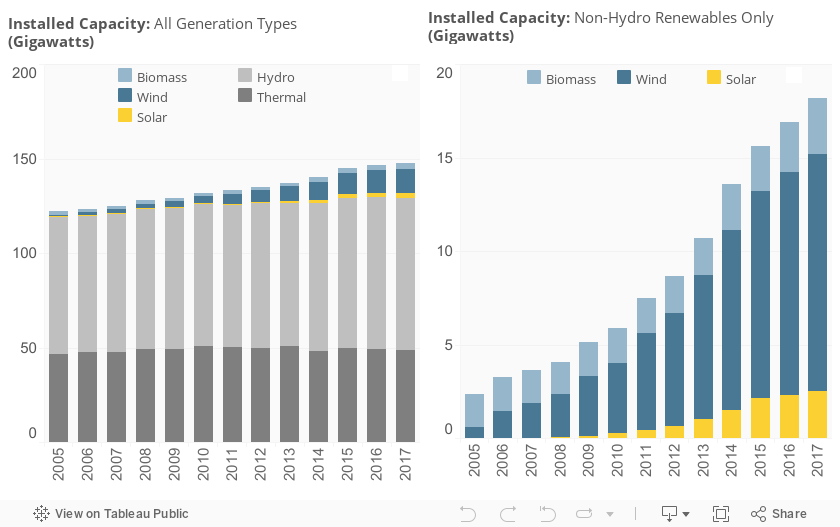
Source: NEB – Canada’s Energy Future 2018
Description:
These two graphs illustrate Canada’s installed electricity capacity from 2005 to 2017. The stacked column graph at left illustrates installed capacity for all types while the stacked column at right illustrates the growth of installed capacity in non-hydro renewables. Between 2005 and 2017, non-hydro renewable capacity grew from 2.4 GW to 18.1 GW, an increase of 654%. Growth of non-emitting capacity (nuclear, hydro, wind, and solar) grew from 86.3 GW to 109.2 GW, an increase of 27%. Thermal capacity grew from 46.8 GW to 48.6 GW, an increase of 4%.
Note: Thermal includes nuclear, coal and coke, and natural gas.
Switching of End Uses and Improving the Transportation Sector
In addition to growth of non-emitting electricity generation, the transition to a low-carbon future will require fuel switching from carbon-based fuels to electricity to take advantage of Canada’s low carbon-intensity generation.
Electricity currently provides 17% of Canada’s end-use energy needs, as shown in Figure 12. Hydrocarbons—natural gas and products that have been refined from crude oil—provide the majority of the remaining 83%. These hydrocarbons are used primarily in the transportation sector (as fuel), in the industrial sector (for heating and as a feedstock), and the residential and commercial sectors (for space and water heating).
Figure 12: Canadian End-Use Energy Demand and Electricity Generation by Fuel, 2017
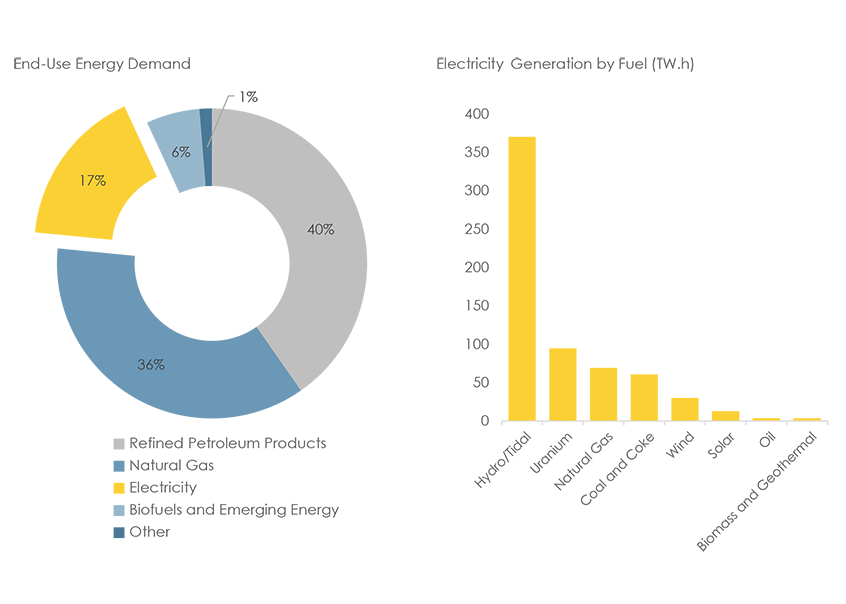
Source: NEB – Canada’s Energy Future 2018
Description:
The donut chart illustrates Canada’s end-use energy demand by source. The largest source is refined petroleum products (for example, gasoline, diesel, and heating oil) at 40%, followed by natural gas at 36%. Electricity accounts for just 17% of end-use demand, while biofuels and emerging energy accounts for 6%.
The column chart illustrates where Canada’s demand for electricity comes from in terawatt hours (TW.h). Hydro, wave, and tidal energy account for the largest share with 370 TW.h. Uranium for nuclear energy accounts for 95 TW.h, followed by natural gas at 69 TW.h, coal and coke at 61 TW.h. Non-hydro renewables in the form of wind account for 30 TW.h, followed by biomass and geothermal at 13 TW.h and solar at 3.9 TW.h. Lastly, generation from oil and petroleum products accounts for the remaining 3.5 TW.h.
Note: Other includes coal, coke, and coke oven gas.
The transportation sector in Canada is the second largest for emissions after the oil and gas sector, and accounted for roughly one-quarter (or 174.4 MT of CO2e) of Canada’s total emissions in 2017. Nearly the entire transportation sector runs on refined petroleum products: gasoline, diesel, jet fuel, and bunker fuel (for ships). These two points suggest that transportation has the most potential for emissions reductions through improved fuel and efficiency standards, the integration of sustainable biofuels, and electrification.
The sector can be divided primarily into two categories: the movement of freight and the movement of people. As shown in Figure 13, the largest growth in emissions from the transportation sector has been from the movement of freight (trucks, aviation, rail, and marine), which has increased 121% between 1990 and 2017. Most notably, emissions from freight trucks have increased 209%, the largest increase in any of the transportation subcategories. Population and GDP growth, as well as stronger international and interprovincial trade and customers’ demands to receive goods quickly, have been the primary drivers of the growth in demand for freight movement. Trends including just-in-time delivery (small, rapid deliveries) and an increase in “empty kilometres” on backhaul trips have also contributed to the demand growth, and consequently, emissions growth.Footnote 35
Figure 13: Growth of Transportation Sector GHG Emissions, 1990 and 2017
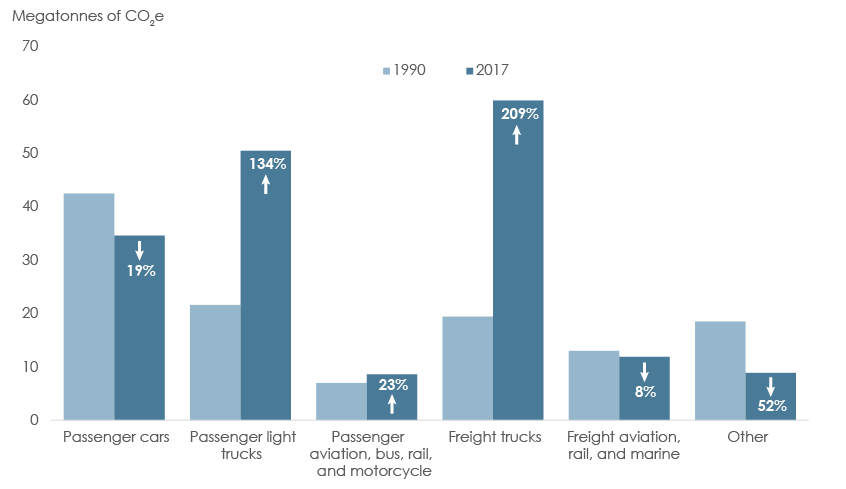
Source: ECCC – National Inventory Report 1990-2017
Description:
This column chart illustrates the growth in GHG emissions in transportation sub-sectors between 1990 and 2017. Emissions from passenger cars fell 19% over this 27 year period, while emissions from passenger light trucks increased 134%. Emissions from passenger aviation, bus, rail, and motorcycle have increased 23%. Emissions from freight trucks have increased 209%, while emissions from freight aviation, rail, and marine have decreased 8%. Other emissions (including recreational, commercial, and residential uses) have decreased 52%.
Between 1990 and 2017, emissions from passenger cars and light trucks combined have increased 33%. Total emissions from passenger cars alone have declined 19% as shown in Figure 13, partially because of improved fuel efficiency standards, but primarily because of the declining popularity of cars relative to light trucks and sport utility vehicles. Total emissions from passenger light trucks (including sport utility vehicles, vans, and light-duty trucks) have increased 138%. Between 1990 and 2016, the number of light trucks on the road have increased from four million to over 11 million.
Reducing emissions from passenger and freight transportation would have a significant positive effect towards Canada’s climate change commitments. One area where Canada is starting to see significant change is with respect to vehicle electrification. As shown in Figure 14, electric vehicle (EV)Footnote 36 sales in Canada have displayed strong momentum in recent years.
The Pan-Canadian Framework includes standards for EV sales and deployment in Canada. Federal, provincial, and territorial governments continue to work collaboratively amongst themselves, and with industry and other stakeholders, to develop a Canada-wide zero-emission vehicle (ZEV) strategy. Collectively, they have made strides towards accelerating the adoption of ZEVs and alternative fuel vehicles. The EVs will still need to compete with traditional internal combustion engines with respect to price and range. Automakers will also need to adjust production of EVs to account for a growing preference from consumers for light trucks and SUVs. Lastly, EVs will require power from a low carbon-intensive electricity grid to achieve a noticeable reduction in GHG emissions.Footnote 37
Figure 14: Growth of Electric Vehicles in Canada, 2012 – 2018
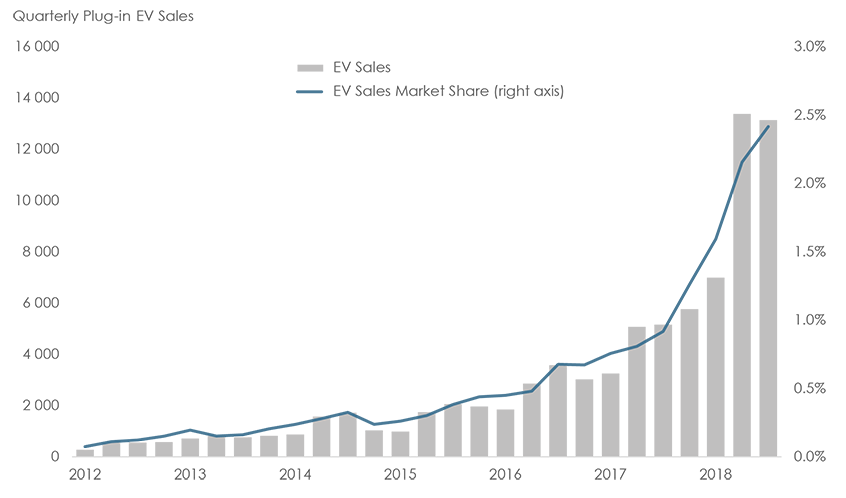
Source: Statistics Canada (Table 20-10-0001-01), Fleet Carma, Canada EV Sales Data (Matthew Klippenstein), NEB calculations
Description:
This column chart and line chart illustrates quarterly EV sales and the market share of EV sales in Canada from 2012 to 2018. EV sales have grown from an average of 492 each quarter in 2012 (equalling a market share of 0.1% of total car sales) to an average 11 452 per quarter in 2018 (equalling a market share of 2.1%).
Policy changes and programs, such as governments developing public transit networks and mandating fuel economy standards, can also result in emissions reductions. Individuals can also take measures to reduce their energy consumption and emissions. This can be accomplished by taking alternative forms of transportation, purchasing a more fuel-efficient vehicle,Footnote 38 changing driving techniques, choosing not to drive during hours of peak traffic congestion, and driving less.
The Pan-Canadian Framework focuses primarily on the electrification of personal vehicles. However, the Framework also introduces new regulations with respect to heavy-duty vehicles (HDVs), including freight transport and buses. In 2018, the Government of Canada published final amended regulations designed to reduce GHG emissions in Canada from new on-road HDVs. The Government of Canada also created a federal-provincial-territorial working group on HDV retrofits to support the Pan-Canadian Framework commitment to develop new requirements for heavy-duty trucks to install fuel-saving devices.Footnote 39 Starting in 2020, emission reduction regulations will become increasingly stringent for HDVs in Canada. The Government of Canada expects that the new standards will reduce annual emissions from HDVs by 6 MT of CO2e by 2030.
Increasing Energy Efficiency
Energy efficiency plays a key role in Canada’s energy transition and is a component of the Pan-Canadian Framework. The Generation Energy Council report highlighted that wasting less energy is a fundamental pathway for Canada to pursue a low-carbon future. The report notes that “[f]ully one-third of our Paris emissions commitment could be achieved by improving energy efficiency…”.Footnote 40
The IEA reported that through energy efficiency, Canada has the potential to keep primary and end-use energy demand on a steady decline for decades, even with growing economic activity.Footnote 41 The Conference Board of Canada reported that increasing energy efficiency in Canada could reduce energy demand by as much as 15% by 2035 from 2017 levels.Footnote 42
Industrial Sector
Canada’s largest and most energy-intensive sector is the industrial sector. Industry accounted for 28% of Canada’s GDP and 52% of Canada’s energy demand in 2016. The sector is also emission-intensive, accounting for 39% of Canada’s GHG emissions in 2016.
Energy demand from the industrial sector increased by 26% between 1990 and 2016. The industrial sector has undergone substantial structural changes during that time with some industries declining in relative importance (primarily pulp and paper, and manufacturing), and other industries (primarily energy) growing in relative importance. Figure 15 compares the share of energy use and the share of GHG emissions from aggregated industries in Canada. The figure also shows how these shares changed between 1990 and 2016.

ENERGY EFFICIENCY AS A RESOURCE?
When electricity demand exceeds supply, either supply can be increased or demand can be reduced to bring balance. Meeting short-term demand spikes with new supply often involves generating electricity through older and less efficient power units. Meeting long-term demand growth often involves upgrading, refurbishing, or building new generation facilities.
Alternatively, investments can be made in energy efficiency and conservation efforts to reduce demand during peaks, and over the long term.
Studies have found that investments in energy efficiency programs are among the lowest cost solutions for meeting future energy needs.
A measure for energy efficiency is the “negawatt”; a theoretical unit of power that measures electrical consumption that has been avoided or saved.
Figure 15: Share of Energy Use and GHG Emissions from Industry, 1990 and 2016
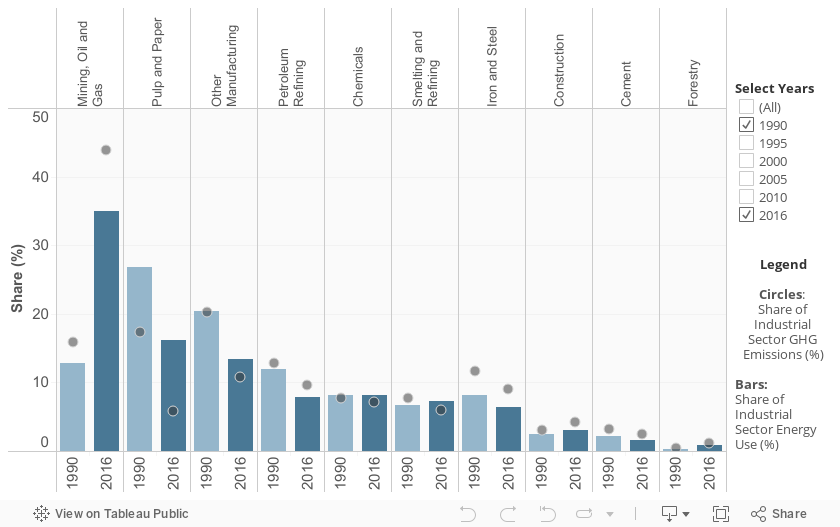
Source: Natural Resources Canada (NRCan) – National Energy Use Database
Description:
This column chart illustrates the share of energy use and the share of GHG emissions from industrial sub-sectors in Canada, and compares these shares between 1990 and 2016.
The largest energy consuming and GHG emitting subsector in Canada is mining (including upstream oil and gas). In 2016, the mining subsector accounted for 35% of energy consumed and 44% of the GHGs emitted in the industrial sector. Energy use and emissions from this subsector increased substantially since 1990, when mining’s energy use share was 13% and GHG emission’s share was 16%.
Canada’s growth in upstream oil and gas since 1990 has largely been from in situ oil sands production. The extraction of bitumen from in situ oil sands deposits is made possible with steam, and the two most common processes are known as steam-assisted gravity drainage (SAGD) and cyclic steam stimulation (CSS). Both SAGD and CSS use natural gas for the production of steam and the process is energy and emissions intensive.Footnote 43
A key metric for calculating the energy intensity and efficiency of oil sands operations is from its steam-to-oil ratio (SOR). The SOR is the ratio of the volume of steam required to produce one unit of oil. Oil sands innovations have helped improve SOR numbers in recent years, and SOR numbers are expected to continue declining into the future. Reducing GHG emissions remains an area of focus for the oil sands, and producing cleaner oil and gas is a key pathway for transition, as established by the Generation Energy Council report. As new technologies like solvent injectionsFootnote 44 instead of steam-driven bitumen extraction are being explored, additional energy efficiency and emissions efficiency gains are expected.
Energy intensity and emissions intensity do not necessarily need to go hand-in-hand. For example, the smelting process of turning bauxite into aluminium is highly electricity-intensive.Footnote 45,Footnote 46 Consequently, smelters tend to be located near inexpensive electricity sources. It follows then, that nine of Canada’s aluminium smelters are located in Quebec and one in B.C. where abundant and low-cost hydroelectricity allows the smelting industry to lower its costs and emissions.
Between 1990 and 2015, Canada’s aluminium production increased 123%. Over the same period, absolute carbon emissions declined 38%, and carbon intensity (as measured by tonnes of CO2e per tonne of aluminium) declined 66%.Footnote 47 These efforts made to reduce emissions have resulted in Canada’s aluminium smelting sector having the lowest carbon footprint in the world.Footnote 48 Furthermore, new processes being advanced in Canada could eliminate all carbon emissions from smelters.
In addition to improving energy efficiency and emissions reductions in industry, the Pan-Canadian Framework includes commitments to reducing emissions of methane from the oil and gas sector by 40 to 45% below 2012 levels by 2025.Footnote 49 Methane has a global warming potential 25 times that of CO2 that can unintentionally be released into the atmosphere from oil and gas well leaks, or by venting.
Residential and Commercial Sectors
Canada’s residential sector accounted for 14% of our energy use in 2016, while the commercial and institutional sector accounted for 12% of our energy use.
In the average Canadian household, the largest uses of energy are for space heating (62.4% of total end-use demand) and water heating (18.7% of total end-use demand). Energy use for appliances, lighting, and space cooling account for the remaining 18.9%.Footnote 50
As Figure 16 illustrates, just over half of Canadian households heat with natural gas or heating oil. The remaining households heat with electric, dual systems, or other (heat pumps, wood, coal, and propane). Dual systems include wood and oil, oil and electric, and gas and electric.
Of those households that heat with natural gas, high efficiency furnaces account for 62% while mid-efficiency furnaces account for 37%, and normal efficiency furnaces the remaining 1%. In 1990, normal efficiency gas furnaces accounted for the vast majority in operation at 89%.Footnote 51 Similarly for heating oil, normal efficiency furnaces accounted for 98% share in 1990. By 2016, the share held by normal efficiency furnaces had declined to 1% as mid- and high efficiency furnaces took hold.
Figure 16: Residential Space Heating System Stock Share, 1990 – 2016
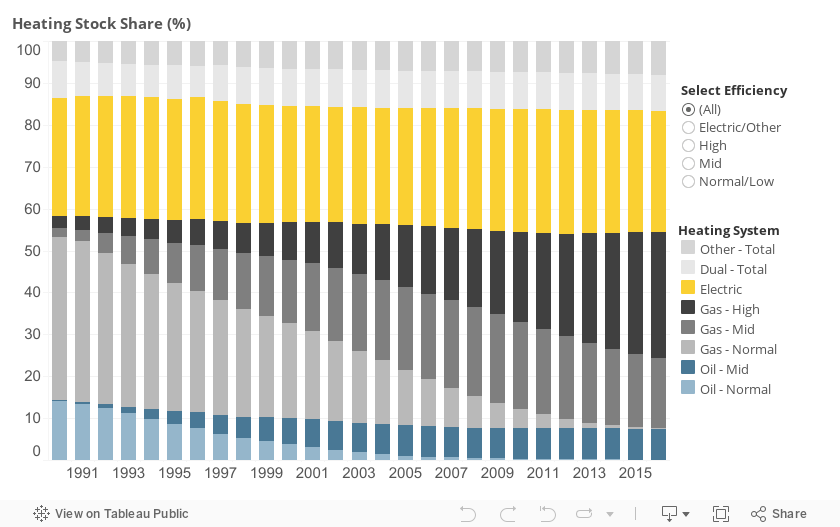
Source: NRCan – National Energy Use Database: Residential Space Heating System Stock Share
Description:
This stacked column chart illustrates residential space heating systems by stock share. Between 1990 and 2016, heating oil’s share had declined from 14.3% to 7.5%. By 2016, nearly all oil-fired furnaces in Canada were mid-efficiency.
Over the same time frame, natural gas’ share had grown slightly from 44.0% to 46.8%. In 1990, only 11% of all natural gas furnaces were mid- or high efficiency. By 2016, 99% of all natural gas furnaces were mid- or high efficiency.
The share of residences heating with electricity grew from 28.1% in 1990 to 28.9% in 2016. The share of residences heating with other sources grew from 4.9% in 1990 to 7.9% in 2016, while the share of residences heating with dual sources remained the same at 8.7% in 1990 and in 2016.
Note: Other – Total includes heat pump (5% of total stock share in 2016), wood (1.9%), and coal/propane (1.0%). Dual systems include wood/electric (4.7% of total stock share in 2016), wood/oil (2.2%), oil/electric (1.3%), and gas/electric (0.5%).
Recent developments in lighting provide another notable example of improved energy efficiency. Compact fluorescent lights (CFL) and light-emitting diode (LED) lights consume 80% to 85% less energy per lumen emitted when compared against a traditional incandescent bulb. Modern front-loading clothes washers consume up to 80% less electricity versus older, large capacity, top-loading washers. Developments in windows and insulation are increasing the energy efficiency of newer homes, and of older homes through retrofit projects. These advancements in consumer appliances have been fundamental in reducing household energy use, and in saving consumers money.
NRCan’s Office of Energy Efficiency estimates that between 1990 and 2015, the energy efficiency effect in the residential sector has reduced energy consumption by 656 PJ—a substantial reduction for a sector that consumed 1 544 petajoules (PJ) in 2015. By comparison, the energy efficiency effect in the commercial/institutional sector resulted in a reduction of 169 PJ between 1990 and 2015. In 2015, the commercial/institutional sector consumed 1 009 PJ.
The diverse commercial/institutional sector consists of the offices, retail spaces, warehouses, and institutional buildingsFootnote 52 that play a fundamental role in our society and economy. Similar to residential buildings, the majority of energy consumed in the commercial sector in Canada is for space heating (54.7%). The running of auxiliary equipment accounts for 14.4% of the energy consumed by the sector, followed by lighting at 11.1%, and water heating at 7.8%. Energy use in the commercial sector increased 35% between 1990 and 2015.
The fragmented and diverse nature of the commercial/institutional sector results in barriers that limit the adoption of energy efficiency technologies.Footnote 53 Figure 17 illustrates the slow decline in energy intensity (as measured in gigajoules (GJ) per square metre of floor space) for commercial buildings constructed in Canada. The energy intensity of commercial buildings, measured in units of energy consumed per square metre of floor space, is highest for buildings constructed between 1920 and 1959. Commercial buildings constructed after 1960 show small reductions in energy intensity.
Figure 17: Commercial Building Energy Use and Intensity by Age of Construction, 2014
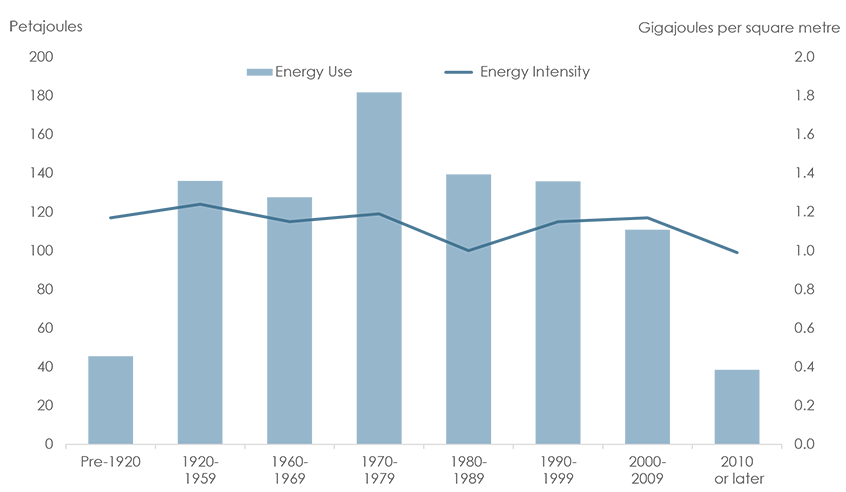
Source: NRCan – National Energy Use Database: Survey of Commercial and Institutional Energy Use
Description:
This combined column and line chart illustrates energy use and energy intensity for commercial buildings in Canada, grouped by year of construction. Energy use was highest at 181.7 PJ, for buildings constructed between 1970 and 1979. Energy use was the lowest for buildings constructed in 2010 or later at 38.5 PJ, but this number reflects only four years of construction. Energy intensity was highest for buildings constructed between 1920 and 1959, at 1.25 GJ per square metre. Energy intensity was the lowest for buildings constructed in 2010 or later, at 0.99 GJ per square metre.
Advancements in building standards and certifications such as the LEED certification processFootnote 54 have contributed towards a reduction in the energy intensity of commercial buildings. Buildings constructed after 2009 are 15% less energy intensive, on average, than buildings constructed between 2000 and 2009.
Canada’s Buildings Strategy is a component of the Pan-Canadian Framework that commits federal, provincial, and territorial governments to develop and adopt building codes with increasing levels of energy efficiency.
Canada’s Building Strategy includes pathways for improving the efficiency of new buildings, modelling Net-Zero Energy Ready homes and commercial buildings,Footnote 55 retrofitting existing buildings, collecting and sharing energy-use data, and improving the energy efficiency of appliances, equipment, and windows. Starting in 2020, governments in Canada will develop and adopt more stringent building codes with the ultimate goal of a Net-Zero Energy Ready building code for the provinces and territories starting by 2030.
ECCC estimates that the adoption of the pathways in Canada’s Building Strategy by all provinces and territories could amount to a potential emissions reduction of 21.6 MT of CO2e per year—an 11% contribution towards Canada’s 2030 commitment to the Paris Agreement.
- Date modified: