ARCHIVED – Canada’s Energy Future 2017 Supplement: Oil Sands Production
This page has been archived on the Web
Information identified as archived is provided for reference, research or recordkeeping purposes. It is not subject to the Government of Canada Web Standards and has not been altered or updated since it was archived. Please contact us to request a format other than those available.
Canada’s Energy Future 2017 Supplement: Oil Sands Production [PDF 3109 KB]
Report Data and Figures [EXCEL 266 KB]
Appendix Data and Figures [EXCEL 4911 KB]
January 2018
Copyright/Permission to Reproduce
ISSN 2369-1479
Table of Contents
Chapter 1: Background
The National Energy Board’s (NEB) Energy Futures (EF) series explores how possible energy futures might unfold for Canadians over the long term. EF analysis considers a range of impacts across the entire Canadian energy system. In order to cover all aspects of Canadian energy in one supply and demand outlook, crude oil and natural gas production analysis can only be addressed at a relatively high level. Supplemental crude oil and natural gas production analyses address impacts specific to the supply sector, creating an opportunity to provide additional detail and to expand the number of cases to cover greater volatility in crude oil and natural gas prices and in supply-side technology assessment.
Future oil prices are a key driver of future oil production and a key uncertainty to the projections in the Canada’s Energy Future 2017: Energy Supply and Demand Projections to 2040 (EF2017). Crude oil prices could be higher or lower depending on demand, technology, geopolitical events, and the pace at which nations enact policies to reduce GHG emissions.
EF analysis assumes that over the long term all energy produced, given the pricing conditions of the case, will find markets and infrastructure will be built as needed to move that energy to markets. The timing and extent to which particular markets emerge, whether demand growth over/undershoots local production, whether export/import opportunities arise, and whether new infrastructure for crude oil is built, are difficult to predict. This is why simplifying assumptions are made. The analysis in this supplemental report continues the EF tradition of assuming these short-term disconnects are resolved over the longer term.
EF series Natural Gas and Crude Oil Production Supplemental Reports include six cases: the three EF2017 cases, and three additional cases that further analyze oil and gas production in Canada.Table 1.1 EF2017 Natural Gas and Crude Oil Production Supplements Assumptions/Cases etc.
| Variables | EF2017 | Additional Cases | ||||
|---|---|---|---|---|---|---|
| Reference | Higher Carbon Price | Higher Carbon Price + Technology | Reference + Technology | High Price | Low Price | |
| Oil Price | Moderate | Moderate | Moderate | Moderate | High | Low |
| Gas Price | Moderate | Moderate | Moderate | Moderate | High | Low |
| Carbon Price | Fixed nominal C$50/t | Increasing CO2 cost reaching nominal C$140/t in 2040 | Increasing CO2 cost reaching nominal C$140/t in 2040 | Fixed nominal C$50/t | Fixed nominal C$50/t | Fixed nominal C$50/t |
| Technology Advances | Reference assumption | Reference assumption | Accelerated | Accelerated | Reference assumption | Reference assumption |
| Notes | Based on a current economic outlook and a moderate view of energy prices | Considers the impact on the Canadian energy system of higher carbon pricing | Considers the impact of greater adoption of select emerging energy technologies on the Canadian energy system, including technological advances in oil sands production | Since price is one of the most influential factors in oil and gas production, and does vary over time, these two cases look at the effects of significant price differences on production | ||
Alberta’s oil sands will be responsible for the majority of crude oil production growth in Canada through 2040 in all six cases, with nearly all of that growth because of increasing in situFootnote 1 production. This supplemental report provides additional analysis of the Reference Case as well as data and results from all six cases. Differences in the production forecasts between the cases are attributable to differences in oil price assumptions and the application of new technologies related to in situ development.
The Appendix includes a description of the methods and assumptions used to derive the production projections, and numerous detailed data sets for all cases. These include; average annual steam to oil ratios (SOR), natural gas usage, solvent requirements, monthly production by oil sands region, method of extraction and whether the production is from existing, expansion or new projects. The Appendix , data from the Appendix [EXCEL 141 KB], and Chart data [EXCEL 11159 KB] are available.
Chapter 2: Results – Reference Case
2.1 Production by Oil Sands Region
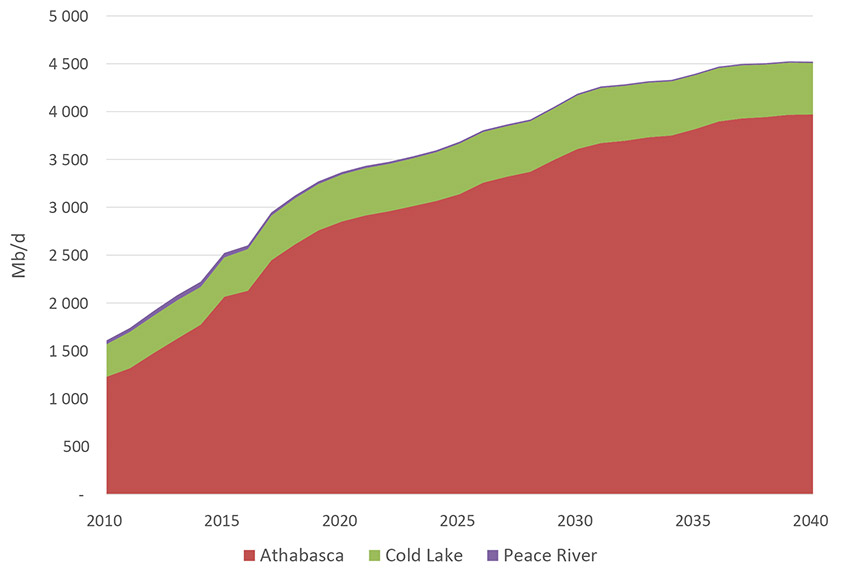
Figure 2.1 Raw Bitumen Production by Region
Description:
This graph presents raw bitumen production for the Reference Case in each of the three oil sands areas, Athabasca, Cold Lake and Peace River. The Athabasca region continues to be the largest contributor to total oil sands output, reaching 4.0 MMb/d or 88% by 2040. Cold Lake continues to increase production over the projection period reaching 0.54 MMb/d or 12% by 2040 while Peace River production falls to .01 MMb/d or 0.3% by 2040.
- Despite persistently low oil prices, production has continued to increase in recent years largely because of projects coming online that were under construction prior to the start of the mid-2014 crude oil price collapse. This trend will continue into the early 2020s after which time production growth will be somewhat slower. In 2017, Brent oil prices are assumed to average US $53.10 per barrel which, when netted back to western Canada is a price level sufficient to cover ongoing costs of operations and in some cases spur investment in new projects. As Brent prices begin to rise, reaching US $80.00 per barrel by 2027, additional investment in oil sands projects occurs leading to higher growth rates in the second half of the next decade. Production in 2016 was just under 2.6 million barrels per day (MMb/d) and reaches just over 4.5 MMb/d in 2040, a 73% increase.
- The Athabasca region is responsible for the majority of oil sands production, both historically and throughout the projections as seen in Figure 2.1. Averaging 2.1 MMb/d in 2016 the Athabasca region accounted for 82% of all raw bitumen production, with Cold Lake and Peace River responsible for 16% per cent and 2% respectively.
- Most of the mined bitumen as well as some in situ production is upgraded in Alberta into synthetic crude oil. There are exceptions however. Fort Hills which comes online later this year, and Kearl both produce diluted bitumen which is transported to end-use markets by pipeline or rail.
- The May 2016 wildfires near Fort McMurray were responsible for taking over 1 MMb/d of oil sands production offline, with some of that production taking months to regain full capacity.
2.2 Production by Extraction Method
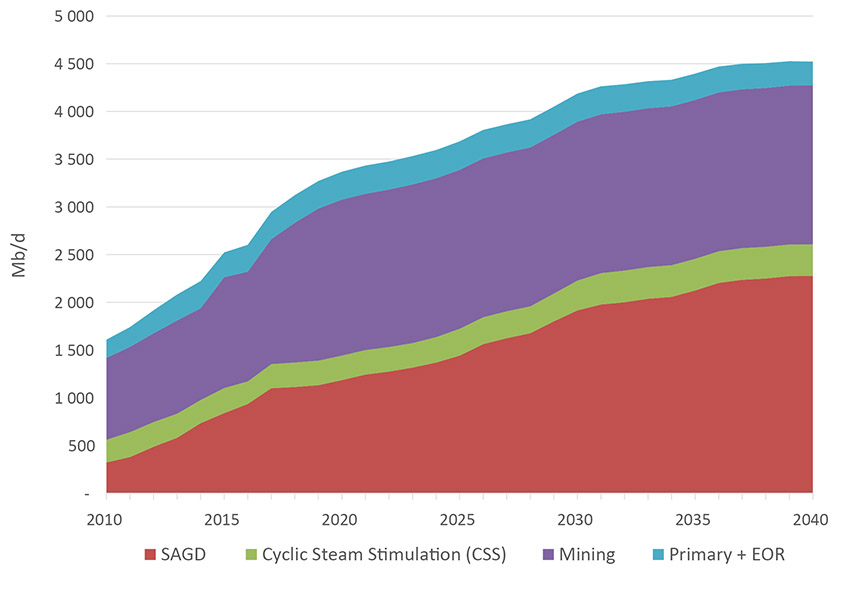
Figure 2.2 Raw Bitumen Production by Extraction Method
Description:
This graph shows the proportion of raw bitumen production attributable to each of four main extraction methods; Mining, SAGD, CSS, Mining and Primary/EOR. Production from both SAGD and CSS continue to grow reaching 2.6 MMb/d by 2040 while primary and EOR production increases early in the projection to 0.30 MMb/d by 2025 before declining to 0.25 MMb/d by 2040. Mined production reaches 1.7 MMb/d in 2022 and remains relatively stable for the remainder of the projection period.
- Bitumen is produced in Alberta in one of three ways:
- Surface mining using trucks and excavators (referred to as “truck and shovel”).
- In situ which primarily uses steam to heat the reservoir allowing the bitumen to be pumped to the surface through horizontal wells. This can be either Steam Assisted Gravity Drainage (SAGD)Footnote 2 or Cyclic Steam Stimulation (CSS)Footnote 3.
- Primary production and enhanced oil production (EOR) which produces the bitumen in a method most similar to conventional oil wells and requires no steam.
- Mining is currently used to develop oil sands deposits up to a depth of about 70 meters. For much of the history of oil sands development in Alberta, mining was the largest form of extraction. However, only about 20% of oil sands deposits can be accessed this way.
- The remaining 80% of oil sands deposits are only accessible using in situ methods. In 2012 in situ production surpassed mining as the dominant extraction method and this trend is expected to continue, with in situ accounting for 62% of all raw bitumen production by 2040.
- Figure 2.2 shows that production from mining is expected to plateau after the current slate of projects are completed and ramped up to their full expected production capacity which is typically 85% of nameplate capacity. Mined production reaches 1.7 MMb/d in 2022 and remains relatively stable for the remainder of the projection period. Typically producers access the best parts of their project areas first, stepping out into portions of their land-base with lower quality reservoir as the operation ages. This is the case with oil sands mines as well. It is assumed that companies will continue to improve processes and technologies that will offset declines in bitumen production related to poorer quality reservoir over the projection period, keeping overall mined production levels relatively stable.
- Continued improvements in the cost to operate or expand existing facilities and also to build new ones leads to growth of in situ operations. In situ production from both SAGD and CSS methods reaches 2.6 MMb/d by 2040.
- Primary and EOR production remains relatively stable throughout the forecast, peaking in 2025 at 0.30 MMb/d before declining to 0.25 MMb/d by 2040.
2.3 New and Legacy Bitumen Production
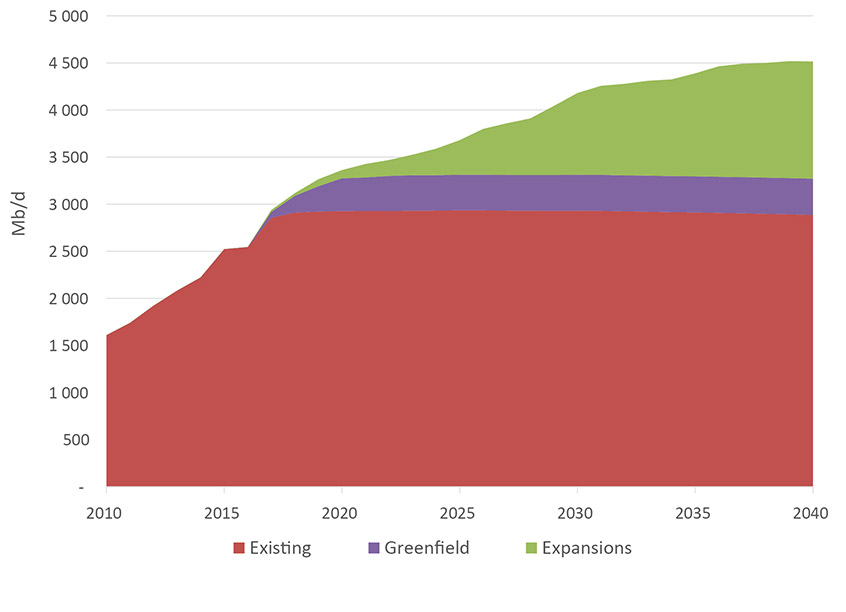
Figure 2.3 New and Legacy Production
Description:
This graph shows production of raw bitumen by existing, expansion and entirely new or greenfield projects for the projection period. Production from existing projects increases slightly over the projection period because of process and technology improvements and the ramp-up in production from projects that have yet to reach full capacity, reaching 2.9 MMb/d by 2040. Expansions will account for 28% or 1.2 MMb/d by 2040 while 0.4 MMb/d or 9% of total production will come from greenfield projects.
- Due to its near-zero decline rate, nearly all of the bitumen production that is currently online, whether mined or in situ, will remain so for the majority of the forecast period.
- Production in 2016 averaged just under 2.6 MMb/d from mining, in situ and primary/EOR. Figure 2.3 shows that the volume from current projects increases slightly over the projection period because of process and technology improvements and the ramp-up in production from projects that have yet to reach full capacity, reaching 2.9 MMb/d by 2040.
- The largest contributor to growth in the oil sands will be expansions to existing in situ facilities. At 1.2 MMb/d, expansions will account for 28% of all oil sands production by 2040.
- Entirely new projects (greenfield projects) will also contribute to growth, although they are more costly to construct than expansions and as such are expected to account for a much smaller share of the growth, reaching only 0.4 MMb/d or 9% of all production by 2040.
2.4 Production by Project
Figure 2.4 Raw Bitumen Production by Project
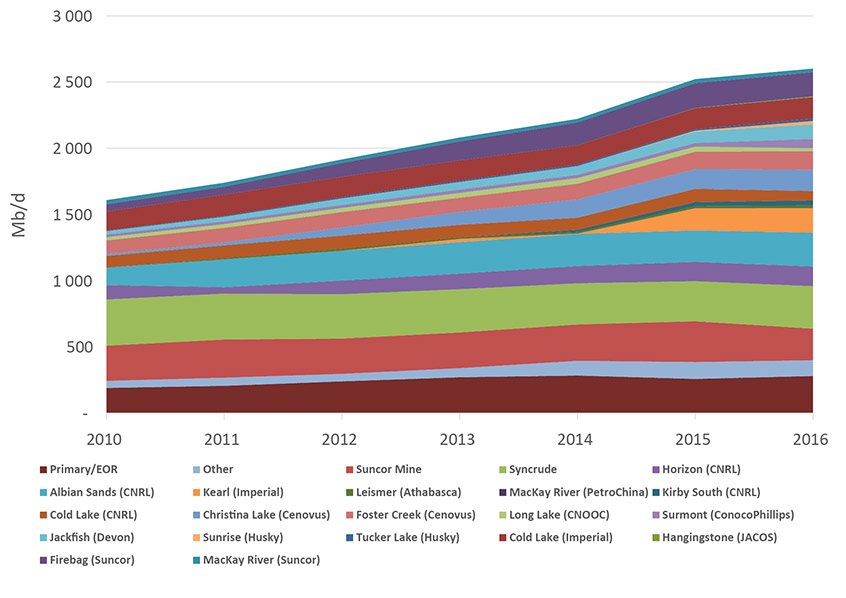
Description:
Historical production (2010-2016) from each project is shown in this graph. Average annual production rose from 1.6 MMb/d in 2010 to 2.6 MMb/d in 2016. Mining accounted for over 51% of all production in 2010 falling to 42% in 2016 with the remaining production coming from in situ and primary/EOR methods.
- Projects individually shown in Figure 2.4 are those that have a capacity exceeding
20 000 barrels per day. All other projects are grouped into “Other” - Average annual production rose from 1.6 MMb/d in 2010 to over 2.6 Mb/d in 2016.
- Mining accounted for over 51% of all production in 2010 falling to 42% in 2016 with the remaining production coming from in situ and primary/EOR methods.
2.5 Steam to Oil Ratios (SORs)
Figure 2.5 Steam to Oil Ratios
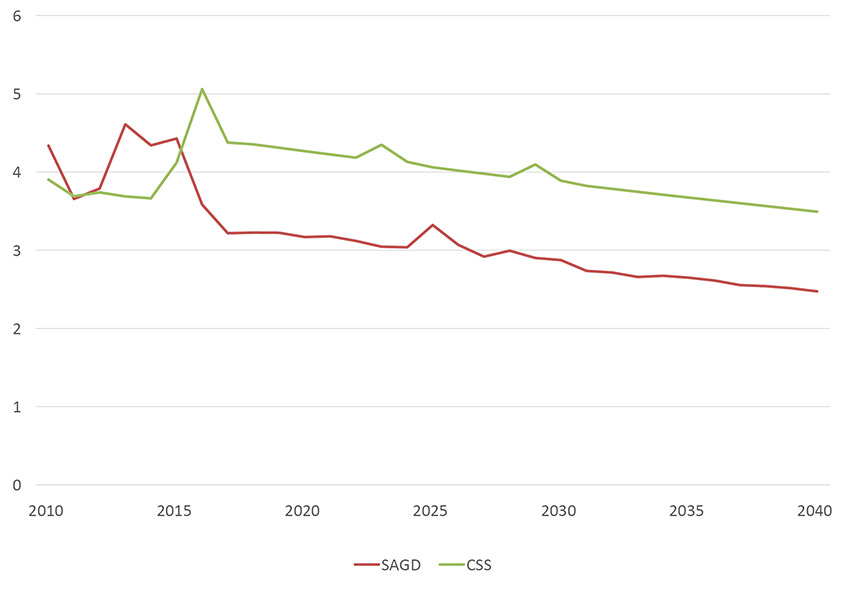
Description:
This graph shows steam to oil ratios for each of the two main types of in situ production methods, SAGD and CSS. Average SORs were 3.58 for SAGD and 5.06 for CSS projects in 2016. This drops to 2.47 and 3.49 for SAGD and CSS respectively by 2040. Increases in SORs in a particular year are due to new projects or expansions to existing ones coming online.
- Figure 2.5 shows that SORs for both SAGD and CSS are expected to trend lower over the projection period as new technologies are developed and improvements to existing ones continue to advance. In the Reference Case, this includes the adoption of steam solvents by a small number of producers. In the High Technology Case, steam solvents are used more extensively and have a noticeable effect on SORs and also on bitumen production (Appendix A). SORs in the Athabasca region are roughly 20% lower as a result of solvent adoption in the High Technology Case.
- Figure 2.3 shows average SORs which were 3.58 for SAGD and 5.06 for CSS projects in 2016. This drops to 2.47 and 3.49 for SAGD and CSS respectively by 2040. Companies tend to develop their best assets first and as production expands to lower quality reservoirs there can be a tendency for SORs to increase. The development and adoption of new technologies is more than adequate to make up for reservoir quality declines in the Reference Case.
- Increases in SORs in a particular year are due to new projects or expansions to existing ones coming online. SORs tend to be higher during the initial stages of bitumen production due to the increased production of steam to continue heating the reservoir with only a gradual increase in bitumen production.
2.6 Steam Solvents and Solvent Demand
Figure 2.6 Solvent Demand
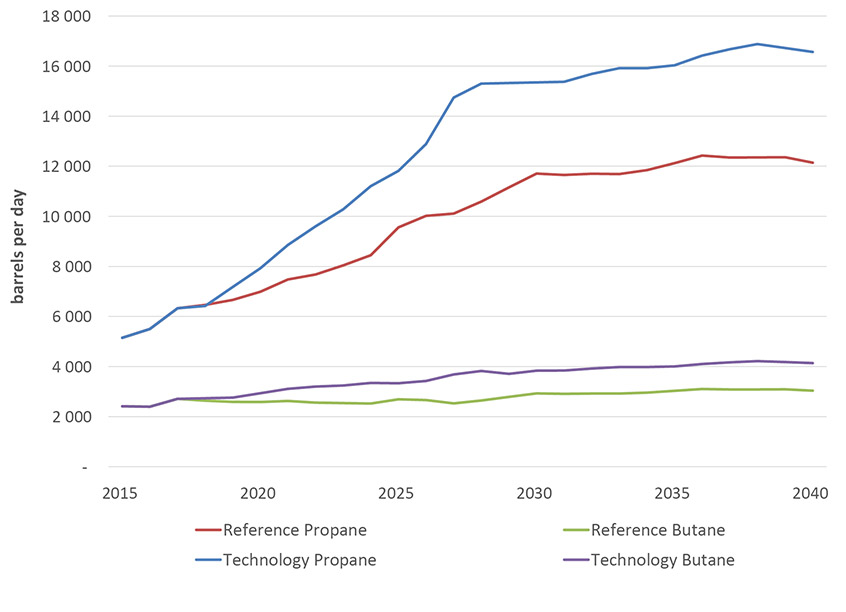
Description:
This graph shows the demand for solvents, propane and butane, in both the Reference and Technology cases. Companies have increasingly experimented with the addition of solvents to the steam injected into their in situ wells. This has a number of effects, notably; it decreases the amount of steam needed to produce a barrel of bitumen, and also lowers the carbon footprint of that same barrel of oil by requiring less natural gas to produce the steam. Propane demand for solvent use is expected to more than double in the Reference Case from an average of 5 Mb/d in 2016 to over 12 Mb/d in 2040. In the High Technology Case demand for propane for solvent use increases to over 16 Mb/d.
- Companies have increasingly experimented with the addition of solvents to the steam injected into their in situ wells. This has a number of effects, notably; it decreases the amount of steam needed to produce a barrel of bitumen, and also lowers the carbon footprint of that same barrel of oil by requiring less natural gas to produce the steam.
- Though the technology is not widely used yet, demand for propane and butane, the two natural gas liquids primarily used as solvents in pilot projects, has potential to significantly increase as shown in Figure 2.6.
- In the Reference Case the use of steam solvents is modest. It is assumed that the production technique is not widespread and, when it is used, applies primarily to new or expansion projects. In the Technology Case steam solvents have a much higher implementation rate with a noticeable effect on SORs and also bitumen production (Appendices A, B).
- Propane demand for solvent use is expected to more than double in the Reference Case from an average of 5 thousand barrels per day (Mb/d) in 2016 to over 12 Mb/d in 2040. In the High Technology Case demand for propane for solvent use increases to over 16 Mb/d.
Chapter 3 – All Cases
Figure 3.1 Raw Bitumen Production from all six EF 2017 Cases
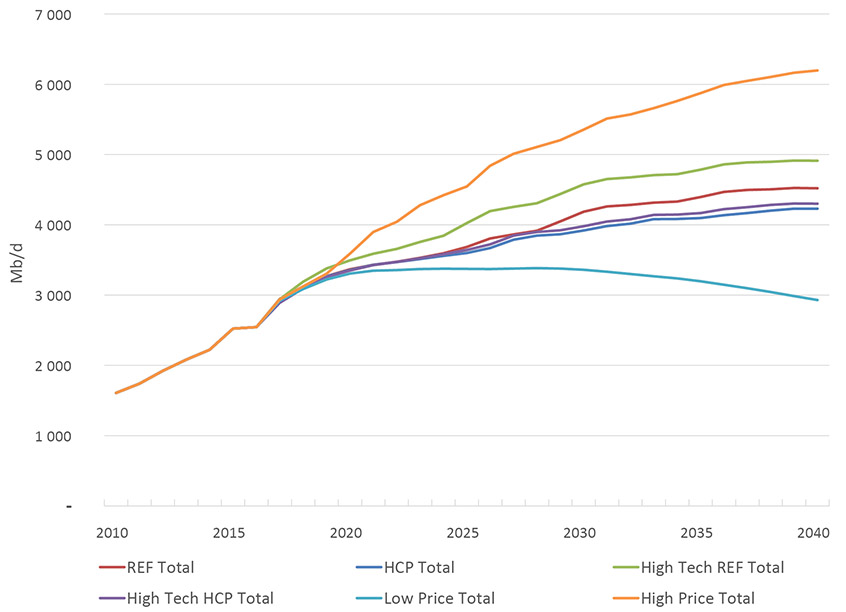
Description:
The graph shows production from all six EF2017 cases. The results vary widely in some cases because of differences in assumptions of the future price of a barrel of oil, ranging from C$40 in the Low Price case to C$120 in the High Price Case. In order of volume of raw bitumen production in 2040, the results of the analysis are as follows: 2.9 MMb/d in the Low Price case, 4.19 MMb/d in the High Carbon Price case, 4.23 MMb/d in the High Carbon Price Technology case, 4.5 MMb/d in the Reference Price case, 4.9 MMb/d in the Reference Price Technology case and, 6.2 MMb/d in the High Price Case.
- To capture the uncertainty inherent in the projections a wide range in future pricing assumptions was employed. Brent prices reach C$120 in the High Price Case and decline to C$40 in the Low Price Case. Figure 3.1 shows the corresponding bitumen production levels which in 2040 are 6.2 MMb/d and 2.9 MMb/d respectively.
- Price assumptions between the other four cases are more subtle with much of the difference in production outcomes being driven by differing technological innovation and carbon pricing assumptions between the cases. For instance, technologies like flow control devices, wedge wells and steam solvents lead to increased production in the technology cases relative to the Reference and High Carbon Price cases.
- Similarly, higher carbon prices in the High Carbon Price and High Technology Carbon Price Case lead to forecasts of lower production relative to the cases where lower carbon prices are assumed.
- The Reference and High Technology Reference Price cases reach 4.5 MMb/d and 4.9 MMb/d respectively. In both cases, growth is a result of increasing to in situ production with mining staying relatively similar between the cases. Owing to greater application of new technologies, the growth rate in the Technology Case is higher early in the forecast before slowing near the end of the next decade due to lower price assumptions.
- The application of technology is also the main driver of differences between the High Carbon Price and High Carbon Price Technology cases. The High Carbon Price reaches 4.19 MMb/d while the High Carbon Price Technology Case reaches 4.23 MMb/d by the end of the projection period.
Chapter 4 – Final Thoughts
- Future oil prices are a key driver of future oil production and a key uncertainty to the projections in EF2017. Crude oil prices could be higher or lower depending on demand trends, technological developments, geopolitical events, and the pace at which nations enact policies to reduce GHG emissions.
- This analysis assumes that over the long term, all energy production will find markets and infrastructure will be built as needed. However, availability of pipeline infrastructure will impact pricing of Canadian crude oil and the economics of production.
- The higher carbon price cases assume that global crude oil prices are lower than in the Reference Case. This price impact is uncertain and depends on the robustness of concerted global climate action, the responsiveness of oil demand to higher carbon costs, and the availability of alternatives to existing technologies.
- Efforts to increase efficiency and decrease costs and environmental footprints in the oil sands are another key uncertainty in our projections. Should technologies advance at a different pace than currently assumed in our models then projections of bitumen production would change accordingly.
- Date modified: