ARCHIVED – Canada’s Adoption of Renewable Power Sources – Energy Market Analysis
This page has been archived on the Web
Information identified as archived is provided for reference, research or recordkeeping purposes. It is not subject to the Government of Canada Web Standards and has not been altered or updated since it was archived. Please contact us to request a format other than those available.
Costs and Trade-Offs
The financial cost of generating power from different sources or fuels varies. For example, power generated by PV solar tends to cost more than power generated by reservoir hydro. In addition, costs vary greatly between different solar projects and different hydro projects.
Generation projects can have vastly different sizes, power outputs, efficiency levels, and other operational variables. Financially, the cost of initial investment, ongoing operations, maintenance, and fuel vary greatly. Tax regimes and subsidies also affect project costs.
One measure used to directly compare costs between technologies with such different characteristics is the levelized cost of electricity. This is the average price an electricity generator must receive for each unit it generates over its lifetime to financially break even. The levelized cost is often presented in cents per kW.h and calculated in today’s dollars.
Figure 18 – Levelized Cost of Electricity
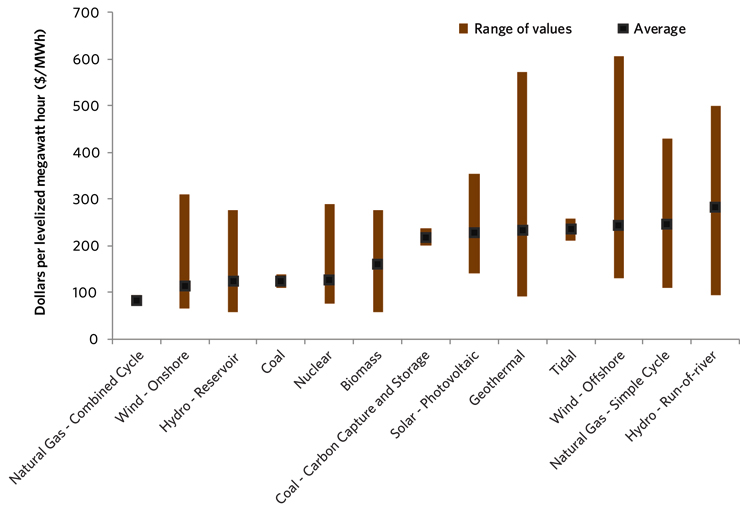
Sources: NB Power,AESO,Nova Scotia Power,OPG,IESO, Manitoba Hydro and BC Hydro
Description:
The chart shows levelized costs of various types of power plants. The levelized cost is the average price an electricity generator must receive for each unit it generates over its lifetime to financially break even. For each type of electricity generation, a column indicates the range of values reported in the provincial sources and the square indicates the average value. Combined cycle natural gas plants, onshore wind farms and reservoir hydro projects have the lowest average levelized costs. Offshore wind farms, simple cycle natural gas plants and run-of-river hydro plants have the highest average levelized costs.
Most utility boards are concerned about the total cost consumers pay for electricity, including the impact on low-income consumers. Price is a large factor in decisions about which sources of generation to build or to run on a given day, and system operators typically build or run low-cost generators first.
Many additional factors must be balanced when making decisions about what sources to use to generate electricity. Reliability is a major concern, as system operators are mandated to ensure supply meets demand at all times. Intermittent sources of power, such as wind and solar, must be backed up by other sources of generation.
Different electricity sources also have different environmental costs. The world is currently focused on carbon emissions and greenhouse gasses (GHGs), often presented in tonnes of CO2 equivalent. Operating hydro, wind, and solar generation create few or no emissions, whereas other types of generation can produce substantially more.
Figure 19 – Emissions by Fuel Type
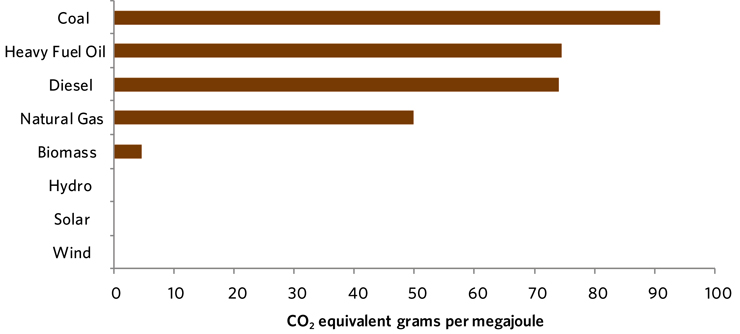
Sources: Canada’s Energy Future 2016: Update – Energy Supply and Demand Projections to 2040
or Environment and Climate Change Canada
Note: Greenhouse gases include: carbon dioxide (CO2), methane (CH4), nitrous oxide (N2O), sulphur hexafluoride (SF6), perfluorocarbons (PFCs), hydrofluorocarbons (HFCs) and nitrogen trifluoride (NF3).
Description:
This chart shows estimated CO2 emissions by fuel type, where emissions are presented in CO2 equivalent grams per megajoule (g/MJ). Emissions from coal contribute the most at 90.87g/MJ, followed by heavy fuel oil at 74.58g/MJ, diesel at 74.08g/MJ, natural gas at 49.88g/MJ, and then biomass at 4.59g/MJ. There are no emissions from operating hydro, wind, or solar.
Every method of generating electricity has an environmental cost, even if there are no emissions from generation. Emissions are produced throughout the lifecycle of facilities. Raw materials must be gathered or mined and manufactured into the required components, which must then be transported to the generating site and assembled. Emissions are also generated by ongoing operations and maintenance. Beyond emissions, the construction, operation, and decommissioning of power facilities can have significant environmental impacts on the land, air, and water ecosystems around them.
Power generation policies balance these various costs and trade-offs in different ways. Current encouragement of wind, solar, and hydro reflects the prioritization of low emission generation. As technologies, costs, and environmental concerns evolve, the relative strengths and weaknesses of various fuels may shift.
Data challenges
Data in this report was derived from:
- Statistics Canada
- Open Government (a portal that provides access to the Government of Canada’s searchable open data and open information)
- Provincial agencies
- Provincial utilities and system operators
Accurate and detailed data on renewables is difficult to obtain. When values are small, the data might be aggregated for ease of reporting or omitted from reports for confidentiality.
For example, when only one or two biomass facilities or wind facilities operate in an area, the generation data is not published.
The NEB used the best available data for this report, but it is likely that some data is absent. When necessary, estimates or older data was used.
The NEB is working with other federal and provincial organizations to reconcile and improve the quality of renewable power Canada.
For data questions or suggestions, please e-mail renewables@cer-rec.gc.ca

- Date modified: