ARCHIVED – Canada’s Renewable Power Landscape 2017 – Energy Market Analysis
This page has been archived on the Web
Information identified as archived is provided for reference, research or recordkeeping purposes. It is not subject to the Government of Canada Web Standards and has not been altered or updated since it was archived. Please contact us to request a format other than those available.

Saskatchewan
Saskatchewan decreased its generation from coal by 6.5% in just one year. It generated 49.3% of its total electricity from coal in 2016, down from 54.8% in 2015. Natural gas increased its share from 27.7% to 33.7%. Renewables accounted for 17.1% of total generation in 2016.
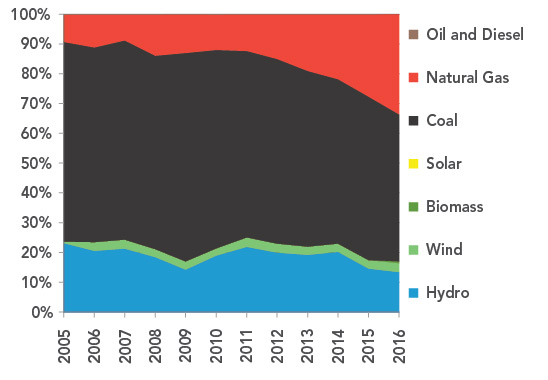
FIGURE 11 Electricity Generation by Source in Saskatchewan
Description
This graph shows the composition of Saskatchewan’s electricity generation between 2005 and 2016. Hydro’s share fluctuated between 13.4% and 23.2% of generation. Wind averaged 2.7%. Coal decreased from 67.0% in 2005 to 49.3% in 2016. Natural gas’ share increased from 9.3% in 2005 to 33.7% in 2016.
TABLE 4 Electric Capacity and Generation in Saskatchewan
| Capacity in MW and % | Generation in GW.h and % | |||||
|---|---|---|---|---|---|---|
| 2005 | 2015 | 2016 | 2005 | 2015 | 2016 | |
| Oil and Diesel | 1 | 17 | 17 | 18 | 16 | 0 |
| <0.1% | 0.4% | 0.4% | 0.1% | 0.1% | <0.1% | |
| Natural Gas | 1 053 | 1 710 | 1 860 | 1 827 | 6 498 | 8 221 |
| 28.2% | 39.1% | 40.8% | 9.3% | 27.7% | 33.7% | |
| Coal | 1 799 | 1 535 | 1 535 | 13 227 | 12 871 | 12 040 |
| 48.2% | 35.1% | 33.6% | 67.0% | 54.8% | 49.3% | |
| Biomass | 0 | 2 | 36 | 0 | 0 | 152 |
| 0.0% | <0.1% | 0.8% | 0.0% | 0.0% | 0.6% | |
| Wind | 16 | 221 | 221 | 92 | 684 | 730 |
| 0.4% | 5.1% | 4.8% | 0.5% | 2.9% | 3.0% | |
| Hydro | 864 | 889 | 889 | 4 573 | 3 425 | 3 285 |
| 23.1% | 20.3% | 19.5% | 23.2% | 14.6% | 13.4% | |
| All renewable sources | 880 | 1 112 | 1 146 | 4 665 | 4 109 | 4 167 |
| 23.6% | 25.4% | 25.1% | 23.6% | 17.5% | 17.1% | |
| All sources | 3 733 | 4 374 | 4 558 | 19 737 | 23 494 | 24 428 |
Generation Trends
Fossil fuels are the primary source of Saskatchewan’s electricity due to a relative abundance of coal and natural gas. Coal remains the largest source of generation, but declined from 67.0% to 49.3% between 2005 and 2016. Natural gas generation increased more than four-fold over the same period, due to both lower natural gas prices and a shift towards less GHG–intensive generation.
From 2005 to 2016, hydro generation in Saskatchewan fluctuated between 23.2% and 13.4% of total electricity generation. These fluctuations were primarily due to varying annual precipitation and corresponding river flow levels.
Wind, the only non-hydro renewable in Saskatchewan, grew from 0.5% to 3.0% between 2005 and 2016. Saskatchewan is one of the sunniest provinces in Canada; however, they have no utility-scale solar facilities as of 2016.
Capacity Changes in 2016
Saskatchewan added an estimated 150 MW of natural gas-fired capacity, primarily from upgrades to the Queen Elizabeth Power Station.
More Information
Canada’s Renewable Power Landscape 2016 – Energy Market Analysis provides additional information on renewable power in Saskatchewan.
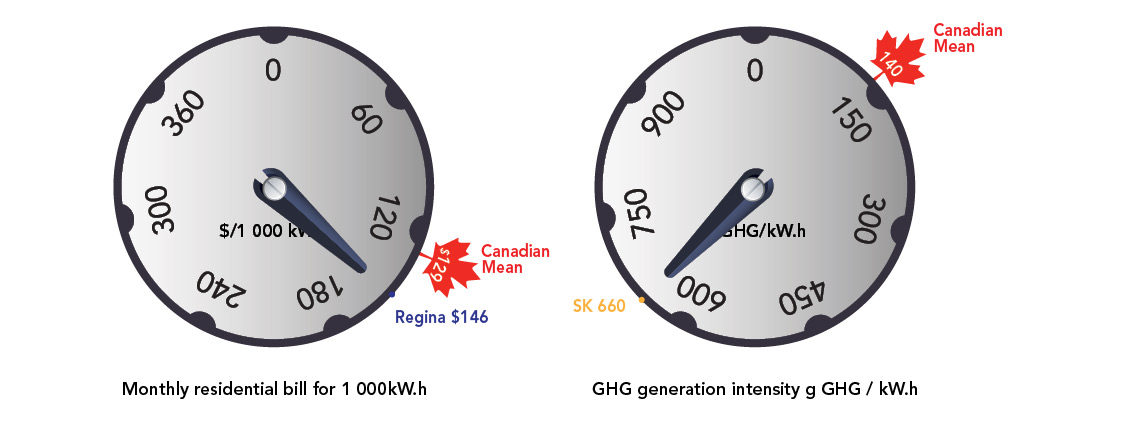
Residential Bills and Greenhouse Gas Generation Intensity
Saskatchewan’s capital city, Regina, has a residential electricity bill of $146 for 1 000 kW.h which is slightly higher than the Canadian mean of $129 per 1 000 kW.h. Saskatchewan’s GHG generation intensity is almost five times higher than average in Canada, emitting 660 grams of GHGs per kW.h compared to the Canadian mean of 140 g GHG/kW.h.
FIGURE 12
Source and Description
Source:
Hydro-Québec, National Inventory Report
Description:
Two dials indicate the monthly residential electricity bill for 1 000 kW.h and the GHG generation intensity in grams of GHG per kW.h. Saskatchewan’s capital city, Regina, has a residential electricity bill of $146 for 1 000 kW.h, which is slightly higher than the Canadian mean of $129 per 1 000 kW.h. Saskatchewan’s GHG generation intensity is almost five times higher than the average in Canada, emitting 660 grams of GHGs per kW.h compared to the mean of 140 g GHG/kW.h.
- Date modified: