ARCHIVED – Canada’s Renewable Power Landscape 2017 – Energy Market Analysis
This page has been archived on the Web
Information identified as archived is provided for reference, research or recordkeeping purposes. It is not subject to the Government of Canada Web Standards and has not been altered or updated since it was archived. Please contact us to request a format other than those available.

Manitoba
Manitoba generated 99.6% of its electricity from renewable sources in 2016. This is the second highest share of renewable generation after Quebec. Hydro was the primary source of electricity, accounting for 97.3% of generation.
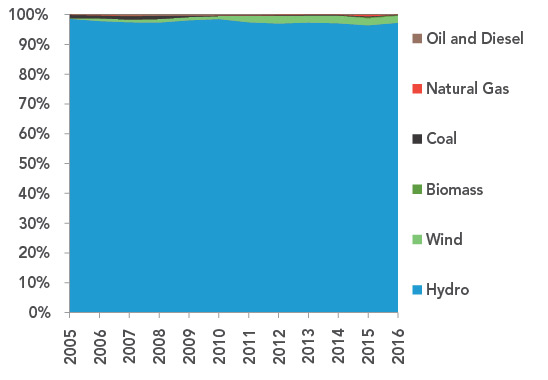
FIGURE 13 Electricity Generation by Source in Manitoba
Description
This graph shows the source of Manitoba’s electricity generation between 2005 and 2016. On average, hydro has accounted for about 97.5% of generation. Wind increased from 0.1% in 2005 to 2.4% in 2016. Biomass has remained less than half a percent of generation. Coal, natural gas, oil and diesel each averaged less than half of a percent of generation, and have decreased to shares near zero in 2016.
TABLE 5 Electric Capacity and Generation in Manitoba
| Capacity in MW and % | Generation in GW.h and % | |||||
|---|---|---|---|---|---|---|
| 2005 | 2015 | 2016 | 2005 | 2015 | 2016 | |
| Oil and Diesel | 32 | 10 | 5 | 32 | 43 | 16 |
| 0.6% | 0.2% | 0.1% | 0.1% | 0.1% | <0.1% | |
| Natural Gas | 368 | 403 | 403 | 11 | 183 | 12 |
| 6.6% | 6.6% | 6.6% | <0.1% | 0.5% | 0.0% | |
| Coal | 98 | 98 | 98 | 421 | 106 | 28 |
| 1.7% | 1.6% | 1.6% | 1.1% | 0.3% | 0.1% | |
| Biomass | 22 | 22 | 22 | N/A | 100 | 78 |
| 0.4% | 0.4% | 0.4% | 0.3% | 0.2% | ||
| Wind | 20 | 258 | 258 | 53 | 860 | 863 |
| 0.4% | 4.2% | 4.2% | 0.1% | 2.4% | 2.4% | |
| Hydro | 5 054 | 5 349 | 5 349 | 36 440 | 34 774 | 35 599 |
| 90.3% | 87.1% | 87.1% | 98.6% | 96.4% | 97.3% | |
| All renewable sources | 5 074 | 5 608 | 5 608 | 36 493 | 35 634 | 36 462 |
| 90.7% | 91.3% | 91.4% | 98.7% | 98.8% | 99.6% | |
| All sources | 5 594 | 6 140 | 6 135 | 36 956 | 36 067 | 36 596 |
Generation Trends
The composition of electricity generation from different technologies was relatively stable in Manitoba between 2005 and 2016. The vast majority of the province’s electricity was generated from hydro, averaging 97.5% since 2005. Wind generation was the fastest growing electricity source, increasing from 0.1% in 2005 to 2.4% in 2016. In contrast, coal dropped from 1.1% to 0.1% of generation in the same time. Biomass accounted for 0.2% of generation in 2016. Diesel is used in some remote communities, particularly in the northern part of the province.
Capacity Changes in 2016
Although accounting for a very small portion of capacity, diesel capacity is estimated to have been halved in 2016, dropping to 5 MW from 10 MW in 2015. The capacity of every other source stayed the same.
More Information
Canada’s Renewable Power Landscape 2016 – Energy Market Analysis provides additional information on renewable power in Manitoba.
Residential Bills and Greenhouse Gas Generation Intensity
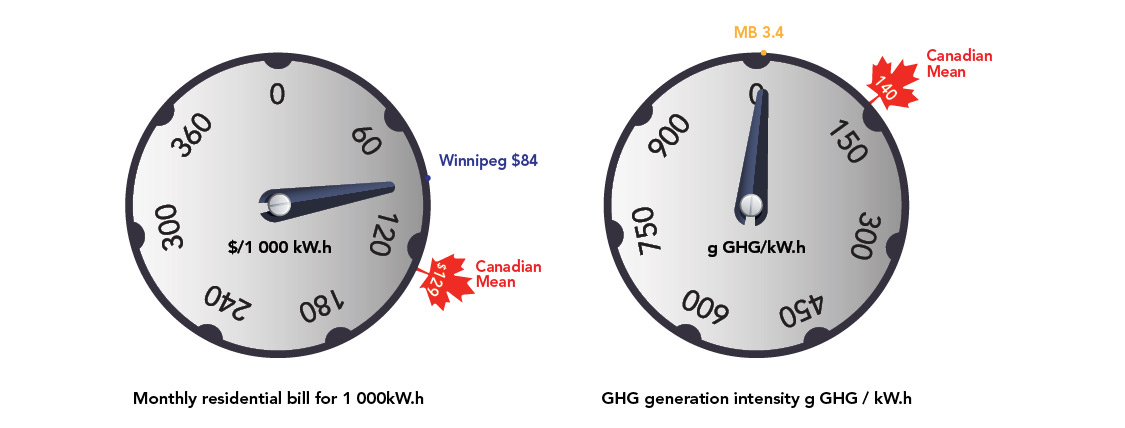
Manitoba’s largest city, Winnipeg, has a relatively low residential electricity bill of $84 for 1 000 kW.h compared to the Canadian mean of $129 per 1 000 kW.h. Manitoba’s GHG generation intensity is also much lower than most of Canada, emitting 3.4 grams of GHGs per kW.h compared to the mean of 140 g GHG/kW.h.
FIGURE 14
Source and Description
Source:
Hydro-Québec, National Inventory Report
Description:
Two dials indicate the monthly residential electricity bill for 1 000 kW.h and the GHG generation intensity in grams of GHG per kW.h. Manitoba’s largest city, Winnipeg, has a relatively low residential electricity bill of $84 for 1 000 kW.h compared to the Canadian mean of $129 per 1 000 kW.h. Manitoba’s GHG generation intensity is also much lower than most of Canada, emitting 3.4 grams of GHGs per kW.h compared to the mean of 140 g GHG/kW.h.
- Date modified: