ARCHIVED – Canada’s Renewable Power Landscape 2017 – Energy Market Analysis
This page has been archived on the Web
Information identified as archived is provided for reference, research or recordkeeping purposes. It is not subject to the Government of Canada Web Standards and has not been altered or updated since it was archived. Please contact us to request a format other than those available.
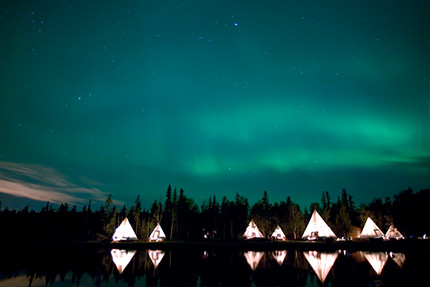
Northwest Territories
NWT generated 69.8% of its electricity from hydro in 2016. Renewables comprised 73.7% of all generation, mostly from hydro, but also solar and wind.
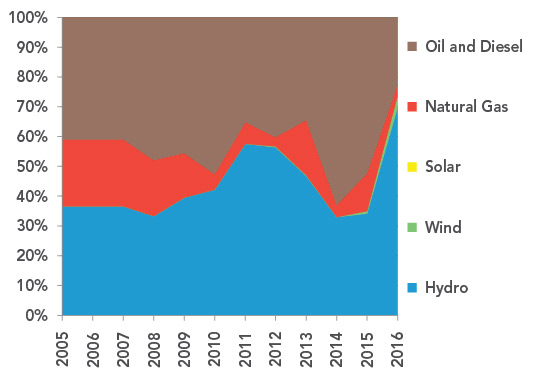
FIGURE 29 Electricity Generation by Source in Northwest Territories
Description
This graph shows the composition of NWT’s electricity generation between 2005 and 2016. Hydro’s share fluctuated from 36.6% in 2005 to a high of 69.8% in 2016. Wind grew from zero to 3.9% from 2012 to 2016. Natural gas generally decreased from 22.5% to 3.9%, with fluctuations year to year. Oil and diesel generation averaged 43.0% from 2005 to 2016, but fell to 22.4% in 2016.
TABLE 12 Electric Capacity and Generation in Northwest Territories
| Capacity in MW and % | Generation in GW.h and % | |||||
|---|---|---|---|---|---|---|
| 2005 | 2015 | 2016 | 2005 | 2015 | 2016 | |
| Oil and Diesel | 114 | 94 | 94 | 280 | 348 | 82 |
| 55.8% | 50.3% | 50.3% | 40.9% | 52.3% | 22.4% | |
| Natural Gas | 35 | 27 | 27 | 154 | 85 | 14 |
| 17.1% | 14.6% | 14.5% | 22.5% | 12.8% | 3.9% | |
| Solar | 0 | 0.8 | 1.2 | 0 | <0.1 | 0.3 |
| 0.0% | 0.4% | 0.6% | 0.0% | <0.1% | 0.1% | |
| Wind | 0 | 9 | 9 | 0 | 5 | 14 |
| 0.0% | 4.9% | 4.9% | 0.0% | 0.8% | 3.9% | |
| Hydro | 55 | 55 | 55 | 250 | 228 | 255 |
| 27.1% | 29.7% | 29.6% | 36.6% | 34.2% | 69.8% | |
| All renewable sources | 55 | 65 | 65 | 250 | 233 | 269 |
| 27.1% | 34.6% | 34.6% | 36.6% | 35.0% | 73.7% | |
| All sources | 204 | 187 | 187 | 684 | 666 | 366 |
Generation Trends
Hydroelectric generation fluctuates significantly between years in NWT, and comprised 69.8% of total generation in 2016. The Snare, Bluefish, and Taltson hydro plants supply the areas around Great Slave Lake, while more remote communities rely primarily on local diesel generators. Inuvik relies on one natural gas generator in addition to a diesel generator. The natural gas is in the form of LNG and is imported by truck. Of Inuvik’s power generation in 2016, 11.7% came from LNG. Natural gas use has been falling in northern communities since 2005, partly because natural gas production in NWT has declined. Diesel generation is used to meet the demand not met by hydro, so it varies by year. Diesel accounted for 22.4% of generation in NWT in 2016.
In 2012, four wind turbines were constructed at the Diavik Diamond Mine, which produced 1.0% of total NWT electricity generation in 2016.
Capacity Changes in 2016
In 2016, NWT added an estimated 0.4 MW of solar capacity from multiple photovoltaic projects.
Data Challenges for Northern Territories
The data in this report was derived from EF2017. Its electricity generation and capacity numbers are based on a model that uses historical Statistics Canada data along with forecasted and estimated values. Accurate and detailed data is especially difficult to obtain for Canada’s northern territories.
More Information
Canada’s Renewable Power Landscape 2016 – Energy Market Analysis provides additional information on renewable power in NWT.
Residential Bills and Greenhouse Gas Generation Intensity
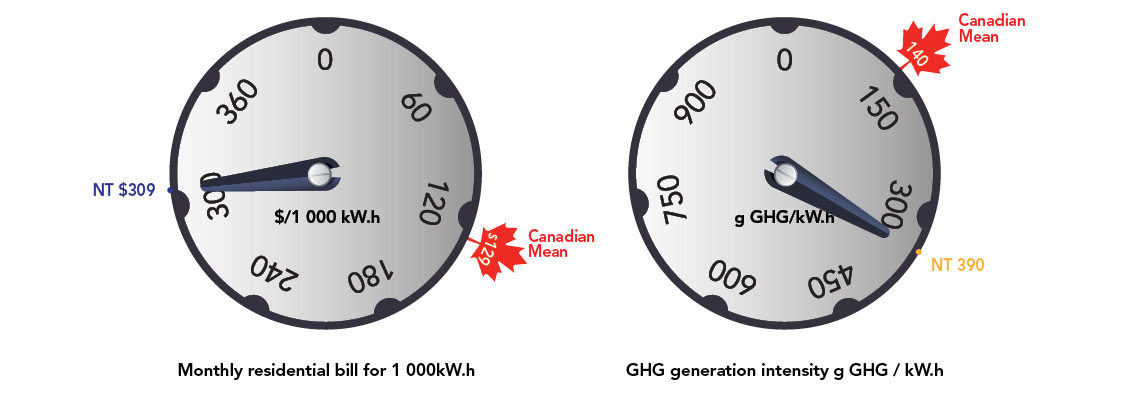
Northwest Territories Power Corporation has a very high residential electricity bill of $309 for 1 000 kW.h compared to the Canadian mean of $129 per 1 000 kW.h. NWT’s GHG generation intensity is also higher than most of Canada, emitting 390 grams of GHGs per kW.h compared to the Canadian mean of 140 g GHG/kW.h.
FIGURE 30
Source and Description
Source:
Arctic Energy Alliance, National Inventory Report
Description:
Two dials indicate the monthly residential electricity bill for 1 000 kW.h and the GHG generation intensity in grams of GHG per kW.h. Northwest Territories Power Corporation has a very high residential electricity bill of $309 for 1 000 kW.h compared to the Canadian mean of $129 per 1 000 kW.h. NWT’s GHG generation intensity is also higher than most of Canada, emitting 390 grams of GHGs per kW.h compared to the mean of 140 g GHG/kW.h.
- Date modified: