ARCHIVED – Canada’s Renewable Power Landscape 2016 – Energy Market Analysis
This page has been archived on the Web
Information identified as archived is provided for reference, research or recordkeeping purposes. It is not subject to the Government of Canada Web Standards and has not been altered or updated since it was archived. Please contact us to request a format other than those available.
Northwest Territories
NWT generated more than one third of its electricity from renewable sources in 2015. 35% of generation comes from hydro and 3% comes from wind.
While NWT has additional hydro potential, it is dependent on fossil fuels for the majority of its electricity. Most industrial sites in NWT require diesel generation because they are not connected to a grid.
The government-owned Northwest Territories Power Corporation generates and distributes electricity to the territory’s isolated communities. A subsidiary of ATCO Electric and Denendeh Investments, Northland Utilities Ltd. also distributes to many NWT communities.
In 2008, NWT introduced the Energy Priorities Framework to help reduce reliance on fossil fuels. This was followed by the Northwest Territories Energy Action Plan in 2013 to increase electricity from renewable sources such as hydro, solar, wind, geothermal and biomass.
As part of the NWT’s focus on sustainability, it plans to transition from diesel by expanding biomass use. There are also several small scale solar installations, and the NWT government offers installation incentives for renewables to businesses and homeowners. The NWT is also currently conducting wind feasibility studies for turbines in the Beaufort Delta.
Since 2013, the town of Inuvik has used LNG to power one of its power plants. Compared to diesel, LNG reduces GHG emissions by about 25%, and there are plans to use it in other NWT communities.
| Capacity in MW and % | Generation in GW.h and % | |||
|---|---|---|---|---|
| 2005 | 2015 | 2005 | 2015 | |
| Hydro | 65 | 56 | 259 | 253 |
| 30% | 30% | 37% | 35% | |
| Wind | 0 | 9 | 0 | 21 |
| 0% | 5% | 0% | 3% | |
| All renewable sources | 65 | 65 | 259 | 274 |
| 30% | 35% | 37% | 38% | |
| All sources | 214 | 186 | 693 | 718 |
This table shows NWT's electric capacity and generation from renewables in 2005 and 2015. The share of hydro in total capacity remained stable at 30% while the share of wind increased from 0% to 5%. The share of hydro in total generation decreased from 37% to 35% while the share of wind increased from 0% to 3%.
FIGURE 27 Renewable Resources and Capacity in NWT
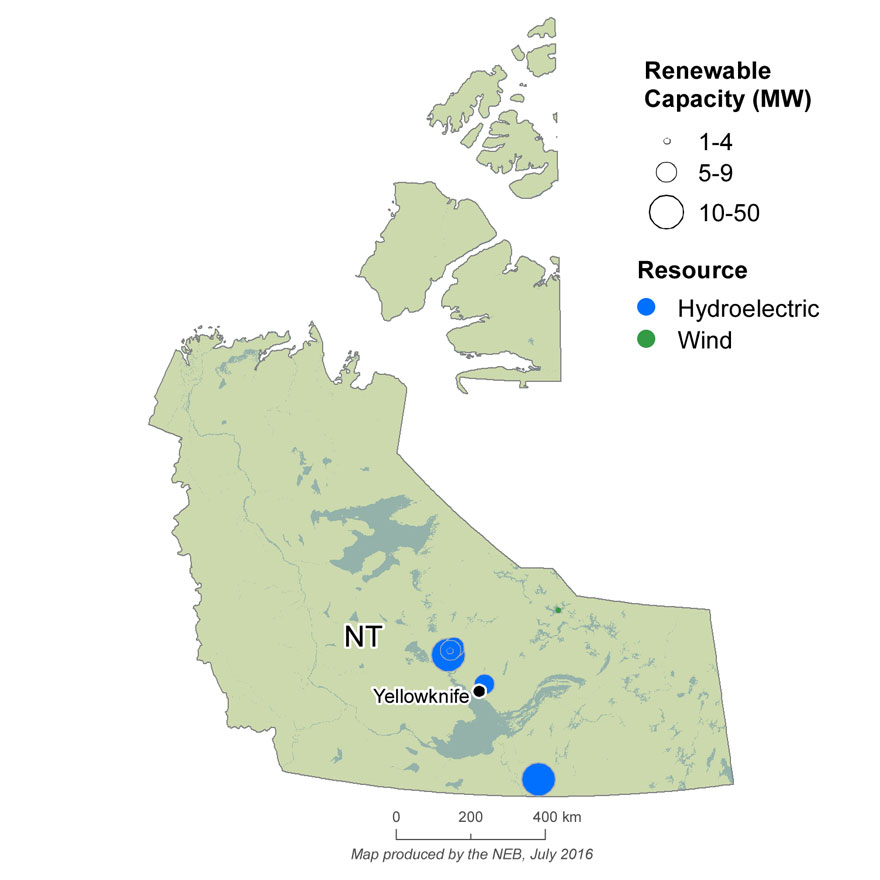
Text version of this map
This map shows the location and approximate capacity of renewable power plants with a capacity of at least 1 MW across NWT. Hydroelectric plants are located near Yellowstone and in the south, while wind resources are located northeast. There are no biomass or solar resources with a capacity of at least 1 MW.
FIGURE 28 Electric Generation Capacity in NWT
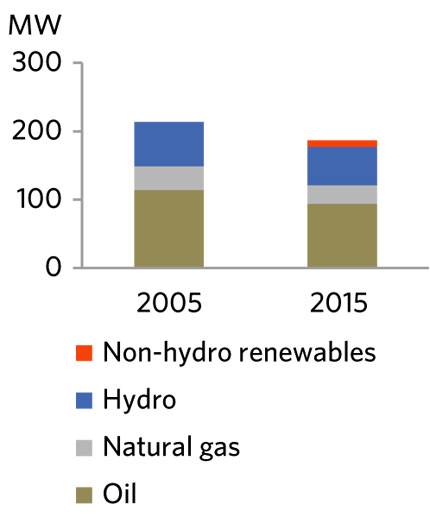
Text version of this graphic
This bar graph shows NWT’s total electric capacity in 2005 and 2015 for all fuel sources. Capacity decreased from 214 MW to 186 MW, with renewables increasing from 30% to 35% of total capacity.

- Date modified: