ARCHIVED – Canada’s Renewable Power Landscape 2017 – Energy Market Analysis
This page has been archived on the Web
Information identified as archived is provided for reference, research or recordkeeping purposes. It is not subject to the Government of Canada Web Standards and has not been altered or updated since it was archived. Please contact us to request a format other than those available.
Nunavut
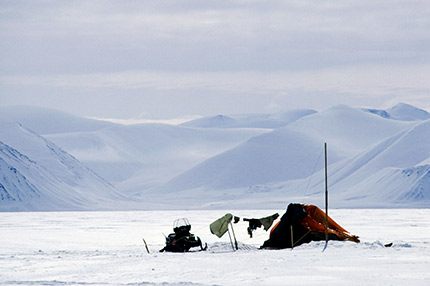
Nunavut relies on diesel and other oil products for electricity generation. Its remoteness and small population make the adoption of other technologies challenging. However it is piloting wind and solar projects.
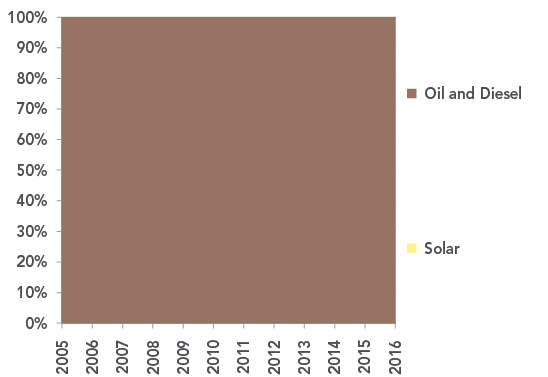
FIGURE 31 Electricity Generation by Source in Nunavut
Description
This graph shows the composition of Nunavut’s electricity generation between 2005 and 2016. Oil and diesel accounted for almost all of generation since 2005. Nunavut’s solar generation is estimated to be less than 0.1 GW.h per year. It is too small to be visible on the graph.
TABLE 14 – Electricity Capacity and Generation in Nunavut
| Capacity in MW and % | Generation in GW.h and % | |||||
|---|---|---|---|---|---|---|
| 2005 | 2015 | 2016 | 2005 | 2015 | 2016 | |
| Oil and Diesel | 54 | 54 | 54 | 142 | 156 | 173 |
| 100.0% | 99.9% | 99.8% | 100.0% | 100.0% | 100.0% | |
| Solar | 0 | <0.1 | 0.1 | 0 | <0.1 | <0.1 |
| 0.0% | 0.1% | 0.2% | 0.0% | <0.1% | <0.1% | |
| All renewable sources | 0 | <0.1 | 0.1 | 0 | <0.1 | <0.1 |
| 0.0% | 0.1% | 0.2% | 0.0% | <0.1% | <0.1% | |
| All sources | 54 | 54 | 54 | 142 | 156 | 173 |
Generation Trends
Nunavut faces many challenges supplying its communities with electricity. Due to its cold climate and sparse population, each community relies on local diesel generators for electricity. Diesel fuel for these generators is imported from outside the territory during summer and then stored for use throughout the year.
Qulliq Energy Corporation (QEC), Nunavut’s energy utility, is seeking ways to increase renewable generation in the territory; however, these initiatives are currently in the developmental stages.
Capacity Changes in 2016
In 2016, QEC installed 11 solar panels at one of its power plants in Iqaluit as a pilot project to research the viability of larger solar applications. A QEC study assessed the viability of wind power across Nunavut and shortlisted five communities with potential for future wind power sites.
Data Challenges for Northern Territories
The data in this report was derived from EF2017. Its electricity generation and capacity numbers are based on a model that uses historical Statistics Canada data along with forecasted and estimated values. Accurate and detailed data is especially difficult to obtain for Canada’s northern territories.
More Information
Canada’s Renewable Power Landscape 2016 – Energy Market Analysis provides additional information on renewable power in Nunavut.
Residential Bills and Greenhouse Gas Generation Intensity
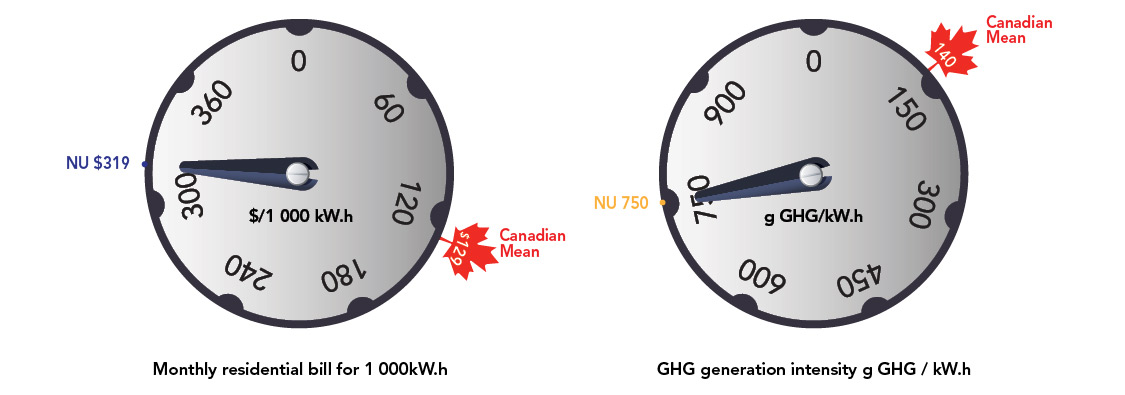
Qulliq Energy Corporation in Nunavut has the highest residential electricity bill in Canada, at $319 for 1 000 kW.h compared to the Canadian mean of $129 per 1 000 kW.h. Nunavut’s GHG generation intensity is also much higher than most of Canada, second only to Alberta, emitting 750 grams of GHGs per kW.h compared to the Canadian mean of 140 g GHG/kW.h.
FIGURE 32
Source and Description
Source:
Quilliq Energy Corporation, National Inventory Report
Description:
Qulliq Energy Corporation in Nunavut has the highest residential electricity bill in Canada, at $319 for 1 000 kW.h compared to the Canadian mean of $129 per 1 000 kW.h. Nunavut’s GHG generation intensity is also much higher than most of Canada, second only to Alberta, emitting 750 grams of GHGs per kW.h compared to the Canadian mean of 140 g GHG/kW.h
- Date modified: