ARCHIVED – Canada’s Renewable Power Landscape 2017 – Energy Market Analysis
This page has been archived on the Web
Information identified as archived is provided for reference, research or recordkeeping purposes. It is not subject to the Government of Canada Web Standards and has not been altered or updated since it was archived. Please contact us to request a format other than those available.
Yukon
Yukon generates over 94.0% of its electricity from renewable sources, almost entirely from hydro. Diesel generators are used in remote communities, and for backup power.
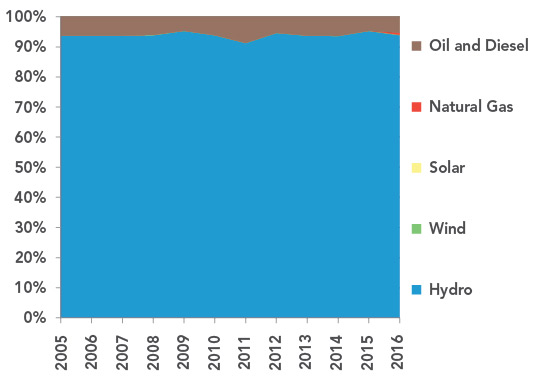
FIGURE 27 Electricity Generation by Source in Yukon
Description
This graph shows the composition of Yukon’s electricity generation between 2005 and 2016. Hydro generation averaged 93.8% from 2005 to 2016. Oil and diesel generation accounting for an average of 6.0%. Wind, solar and natural gas generated about 0.8% combined in 2016.
TABLE 12 Electric Capacity and Generation in Yukon
| Capacity in MW and % | Generation in GW.h and % | |||||
|---|---|---|---|---|---|---|
| 2005 | 2015 | 2016 | 2005 | 2015 | 2016 | |
| Oil and Diesel | 33 | 25 | 25 | 22 | 21 | 24 |
| 29.8% | 19.8% | 19.7% | 6.3% | 4.7% | 5.3% | |
| Natural Gas | 0 | 4 | 4 | 0 | 0 | 3 |
| 0.0% | 3.5% | 3.5% | 0.0% | 0.0% | 0.7% | |
| Wind | 1 | 1 | 1 | 0.4 | 0.3 | 0.5 |
| 0.7% | 0.7% | 0.7% | 0.1% | 0.1% | 0.1% | |
| Solar | 0 | <0.1 | 0.1 | 0 | <0.1 | <0.1 |
| 0.0% | <0.1% | 0.1% | 0.0% | <0.1% | <0.1% | |
| Hydro | 78 | 95 | 95 | 331 | 422 | 419 |
| 69.5% | 76.0% | 75.9% | 93.6% | 95.3% | 93.8% | |
| All renewable sources | 79 | 95 | 95 | 331 | 422 | 420 |
| 70.2% | 76.7% | 76.6% | 93.7% | 95.3% | 94.0% | |
| All sources | 112 | 124 | 124 | 353 | 443 | 447 |
Generation Trends
In 2016, Yukon generated 93.8% of its electricity from hydro. However, Yukon faces unique challenges in ensuring a reliable, year-round supply of electricity. The second largest plant, located at Aishihik, stores water in the summer when demand is lower, and releases it during the winter and at other times when demand is higher. This energy storage is crucial because Yukon’s largest hydro plant, Whitehorse Hydro Plant, loses nearly half of its generation potential in the winter due to flow reductions on the Yukon River.
Occasionally, when hydro supply is disrupted or when electricity demand exceeds hydro generation, diesel powered generators produce electricity to meet demand. Remote communities rely on diesel generation year-round. In 2016, diesel was used for 5.3% of the territory’s electricity generation.
Capacity Changes in 2016
The territorial government is currently looking to transition Yukon’s diesel generators to cleaner-burning liquefied natural gas (LNG). However, no new facilities went into service during 2016.
Data Challenges for Northern Territories
The data in this report was derived from EF2017. Its electricity generation and capacity numbers are based on a model that uses historical Statistics Canada data along with forecasted and estimated values. Accurate and detailed data is especially difficult to obtain for Canada’s northern territories.
More Information
Canada’s Renewable Power Landscape 2016 – Energy Market Analysis provides additional information on renewable power in Yukon.
Residential Bills and Greenhouse Gas Generation Intensity
Yukon Energy has a residential electricity bill of $136 for 1 000 kW.h which is slightly higher than the Canadian mean of $129 per 1 000 kW.h. Yukon’s GHG generation intensity is relatively low, emitting 41 grams of GHGs per kW.h compared to the Canadian mean of 140 g GHG/kW.h.
FIGURE 28
Source and Description
Source:
Yukon Energy, National Inventory Report
Description:
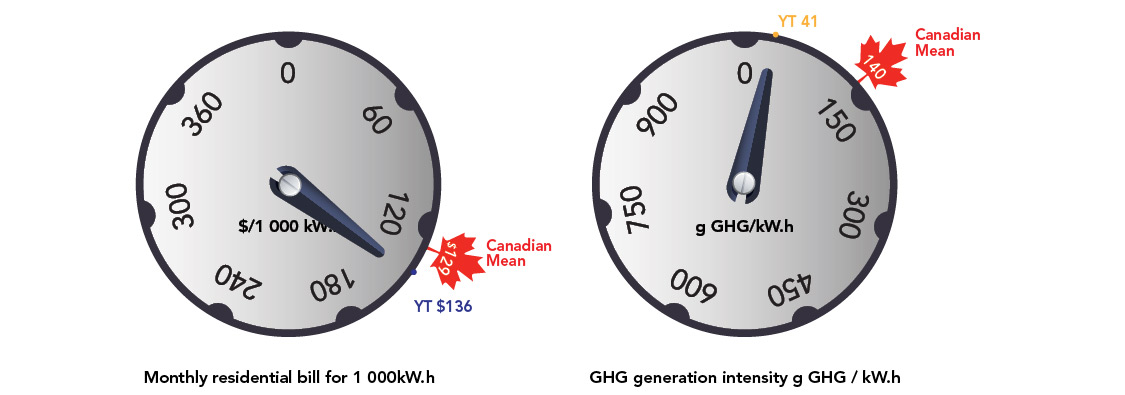
Two dials indicate the monthly residential electricity bill for 1 000 kW.h and the GHG generation intensity in grams of GHG per kW.h. Yukon Energy has a residential electricity bill of $136 for 1 000 kW.h which is slightly higher than the Canadian mean of $129 per 1 000 kW.h. Yukon’s GHG generation intensity is relatively low, emitting 41 grams of GHGs per kW.h compared to the Canadian mean of 140 g GHG/kW.h.
- Date modified: