ARCHIVED – Canada’s Renewable Power Landscape 2017 – Energy Market Analysis
This page has been archived on the Web
Information identified as archived is provided for reference, research or recordkeeping purposes. It is not subject to the Government of Canada Web Standards and has not been altered or updated since it was archived. Please contact us to request a format other than those available.
Prince Edward Island
In 2016, 99.0% of electricity generated in Prince Edward Island (PEI) was renewable, almost all of it from wind. PEI has the highest percentage of wind generation of any province or territory. Oil and diesel accounted for the rest of the generation in.
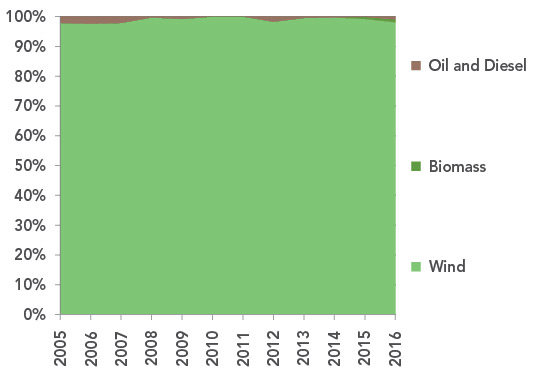
FIGURE 25 Electricity Generation by Source in Prince Edward Island
Description
This graph shows the composition of PEI’s electricity generation between 2005 and 2016. Wind increased from 97.8% to 98.1% of generation. Biomass generated 0.9% in 2016. Oil and diesel fell from 2.2% to 1.0%.
TABLE 11 Electric Capacity and Generation in Prince Edward Island
| Capacity in MW and % | Generation in GW.h and % | |||||
|---|---|---|---|---|---|---|
| 2005 | 2015 | 2016 | 2005 | 2015 | 2016 | |
| Oil and Diesel | 161 | 160 | 160 | 1 | 1 | 6 |
| 91.4% | 43.9% | 43.9% | 2.2% | 0.2% | 1.0% | |
| Biomass | 2 | 2 | 2 | N/A | 4 | 5 |
| 1.2% | 0.6% | 0.6% | 0.7% | 0.9% | ||
| Wind | 13 | 203 | 203 | 40 | 587 | 565 |
| 7.4% | 55.6% | 55.6% | 97.8% | 99.2% | 98.1% | |
| All renewable sources | 15 | 205 | 205 | 40 | 591 | 570 |
| 8.6% | 56.1% | 56.1% | 97.8% | 99.8% | 99.0% | |
| All sources | 173 | 366 | 366 | 41 | 592 | 576 |
Generation Trends
Wind generation in PEI has remained fairly stable. Wind accounted for 97.8% of generation in 2005 and 98.1% in 2016. Biomass supplied 0.9% of generation in 2016, and oil and diesel generators produced only 1.0% of the province’s electricity. PEI is the only province that does not generate hydroelectricity.
PEI imports a large percentage of its consumed electricity from New Brunswick while exporting a significant portion of its locally produced renewable electricity. (See New Brunswick’s generation by source.) The two submarine cables that connect PEI and New Brunswick are vital to the operation and reliability of PEI’s electricity grid.
Capacity Changes in 2016
PEI did not have any new facilities enter into service during 2016. Although oil and diesel generators comprise 43.9% of available capacity, this capacity continued to be rarely used.
More Information
Canada’s Renewable Power Landscape 2016 – Energy Market Analysis provides additional information on renewable power in PEI.
Residential Bills and Greenhouse Gas Generation Intensity
PEI’s largest city, Charlottetown, has a relatively high residential electricity bill of $160 for 1 000 kW.h compared to the Canadian mean of $129 per 1 000 kW.h. PEI’s GHG generation intensity is much lower than most of Canada, emitting 20 grams of GHGs per kW.h compared to the mean of 140 g GHG/kW.h.
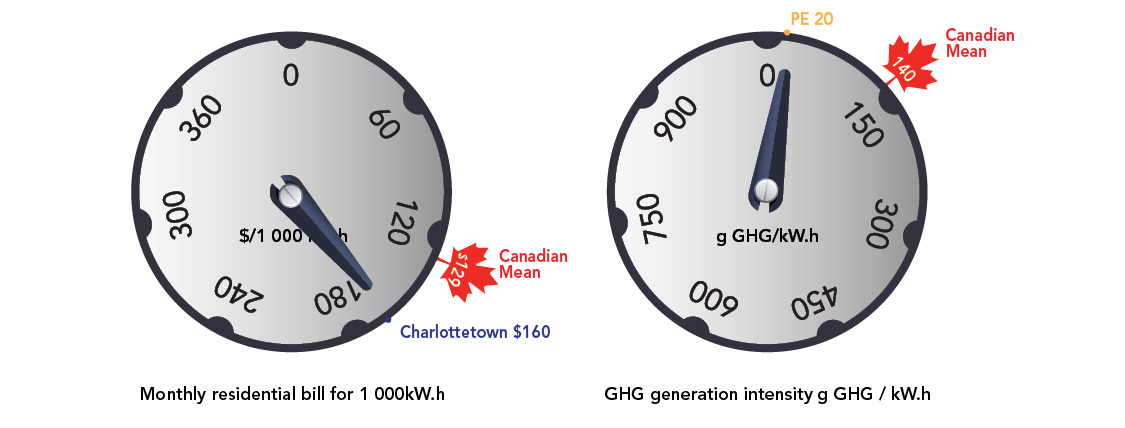
FIGURE 26
Source and Description
Source:
Hydro-Québec, National Inventory Report
Description:
Two dials indicate the monthly residential electricity bill for 1 000 kW.h and the GHG generation intensity in grams of GHG per kW.h. PEI’s largest city, Charlottetown, has a relatively high residential electricity bill of $160 for 1 000 kW.h compared to the Canadian mean of $129 per 1 000 kW.h. PEI’s GHG generation intensity is much lower than most of Canada, emitting 20 grams of GHGs per kW.h compared to the Canadian mean of 140 g GHG/kW.h, although this only includes power that is generated in the province.
- Date modified: