ARCHIVED – Canada’s Energy Future 2016: Province and Territory Outlooks
This page has been archived on the Web
Information identified as archived is provided for reference, research or recordkeeping purposes. It is not subject to the Government of Canada Web Standards and has not been altered or updated since it was archived. Please contact us to request a format other than those available.
Provincial and Territorial Comparison
- Canada is a large and diverse country; energy is produced and consumed differently across its unique regions. The provinces and territories differ in terms of energy resource availability, historical infrastructure, industrial structures, energy and environmental policies and regulations, consumer preferences, and weather conditions. These differences greatly influence current and projected energy trends.
Electricity Supply
- Future generation trends are largely driven by provincial or territorial demand, although some hydroelectric capacity additions, such as in Quebec, Manitoba, and Newfoundland and Labrador, will be exported to the United States (U.S.) or transferred to neighboring provinces. For example, when completed, the 824 megawatt (MW) Muskrat Falls addition in Labrador will provide 20 per cent of its generation (approximately one terawatt hour, TW.h) to Nova Scotia on a firm basis, and Nova Scotia will also be able to purchase additional power, if needed.
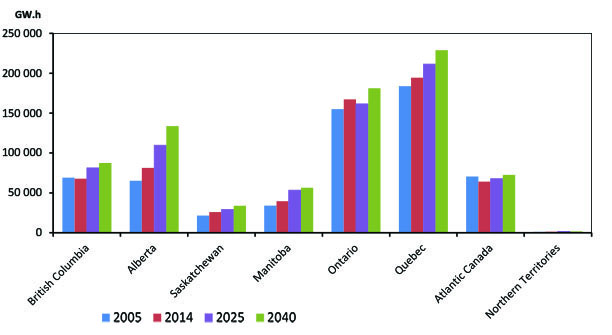
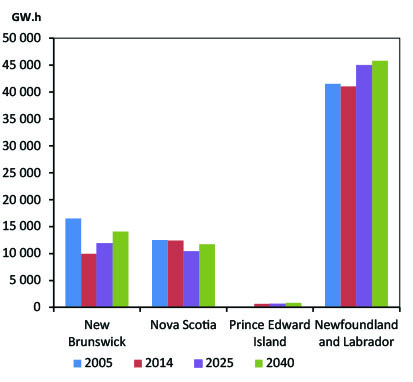
- Figure 2.1 shows generation by province. Ontario and Quebec are the largest producers of electricity, generating approximately 25 and 30 per cent of total Canadian electricity, respectively. Their share of total Canadian electricity consumption is similar to the generation share.
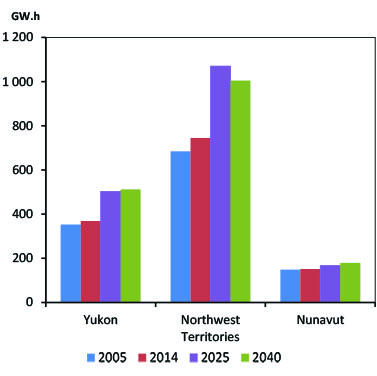
- Alberta has the highest growth in generation over the projection, driven by industrial demand growth. New hydro developments during the projection period lead to significant increases in generation in Atlantic Canada, Quebec, B.C. and Manitoba. Ontario generation decreases in the mid-term, as nuclear refurbishments take place and a larger part of Ontario’s load is met by imports from neighboring provinces and the U.S. Electric generation in the territories is driven by domestic load, and can be quite volatile when large-scale mines are commissioned or shut down during the projection period.
Figure 2.1 - Electric Generation by Province and Territory
Electric Generation by Region
Atlantic Canada and Northern Territory Detail
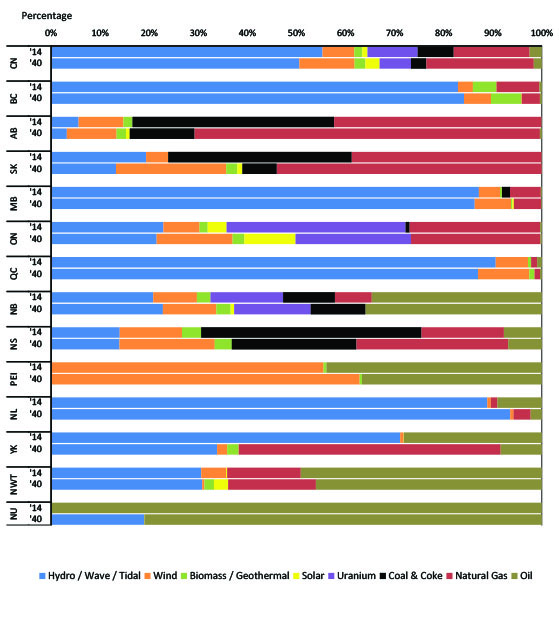
- Canada has a diverse electric capacity mix, largely determined by regional resource access, historical infrastructure, and policy initiatives. Figure 2.2 illustrates the capacity mix for all provinces and territories, as well as the Canadian average, in 2014 and 2040. Canada’s overall electric grid is dominated by hydroelectricity. Hydroelectricity provides the majority of electric capacity in Quebec, B.C., Manitoba, Newfoundland and Labrador, and Yukon. Alberta, Saskatchewan, and Nova Scotia have primarily thermal-based electricity grids dominated by coal and natural gas, while the capacity in Northwest Territories (NWT) and Nunavut mostly consists of stand-alone thermal units that are fueled with refined products such as diesel and fuel oil. Ontario and New Brunswick have diverse mixes, employing renewable, natural gas, and nuclear power. Prince Edward Island (PEI) generates almost entirely wind electricity, although three quarters of its electricity is imported from New Brunswick.
- In the months since this analysis was completed (summer 2015), several provinces made announcements that would shift their electricity mix from the trends outlined in EF 2016. For example, in November 2015, the Government of Saskatchewan and SaskPower announced a goal to move towards 50 per cent renewable electricity by 2030. The Alberta climate policy report from November 2015 suggested retirement of greenhouse gas (GHG)-emitting coal-fired power facilities by 2030, and increased emphasis on renewable generation.
Figure 2.2 - Capacity Mix by Province and Territory, 2014 and 2040
Oil Production
- Figure 2.3 shows the EF 2016 Reference Case oil production outlook to 2040 by producing regions. Total Canadian oil production increases at an average annual growth rate of 1.7 per cent per year, from 3.9 million barrels per day (MMb/d) in 2014 to 6.1 MMb/d in 2040. About 60 per cent of current oil production comes from the oil sands and it drives future production growth. There is also significant non-oil sands production in Saskatchewan, Alberta and offshore Newfoundland and Labrador.
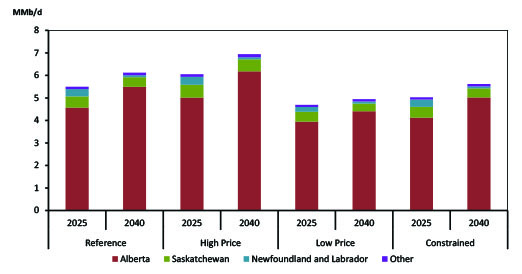
- Production varies among the High and Low Price Cases, as well as the Constrained Case, with Alberta continuing to account for the majority of production in all cases as shown in Figure 2.4. Overall production in the Low Price Case and Constrained Case is lower than in the Reference Case and production is higher in the High Price Case.
- East Coast offshore production increases in the medium term, with production from the Hibernia South and White Rose extensions coming online, as well as the Hebron Field, which begins production in 2017. The projections also assume a discovery of a 500 MMb field offshore of Newfoundland and Labrador. This field is assumed to start producing in 2025 in the Reference Case, 2023 in the High Price Case and 2031 in the Low Price Case. After the startup of this field, production declines to the end of the projection period in all cases.
Figure 2.3 - Reference Case Crude Oil Production by Province.
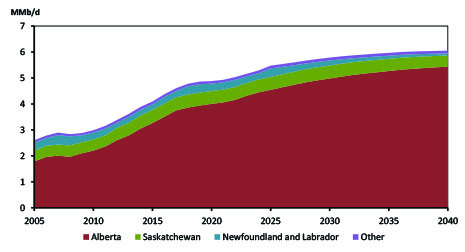
Figure 2.4 - Crude Oil Production by Province, 2025 and 2040, by Case
Natural Gas Production
- Figure 2.5 shows the EF 2016 Reference Case marketable natural gas production outlook to 2040 by producing region. Most Canadian natural gas production comes from B.C. and Alberta. In the Reference Case, B.C. leads production growth, with the assumed liquefied natural gas (LNG) exports of 2.5 billion cubic feet per day (Bcf/d) encouraging additional production. Alberta’s production declines over the projection period, although it still produces the majority of natural gas in Canada.
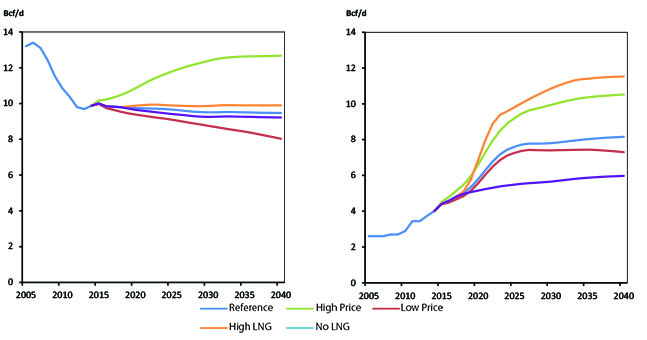
- The EF 2016 High Price, Low Price, and High LNG and No LNG Cases show that various drivers will impact natural gas production in B.C. and Alberta differently (Figure 2.6). In B.C., natural gas production is impacted by both prices and LNG exports; however, the High LNG and No LNG Cases result in the highest and lowest growth in B.C. natural gas production, respectively. In Alberta, the Low Price Case results in lower production than the No LNG Case.
- Production profiles from areas outside of the Western Canadian Sedimentary Basin continue to decline over the projection period. This includes production in the territories, Ontario, New Brunswick and offshore Nova Scotia. The development of further resources is a possibility but is currently speculative and is not included in this analysis.
Figure 2.5 - Reference Case Natural Gas Production by Province
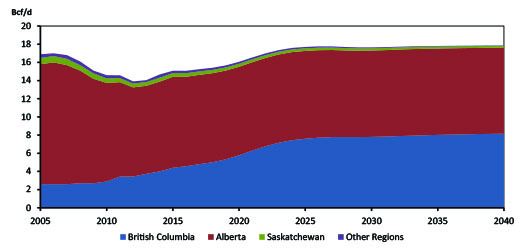
Figure 2.6 - Alberta and B.C. Natural Gas Production by Case
Alberta
B.C.
Natural Gas Liquid Production
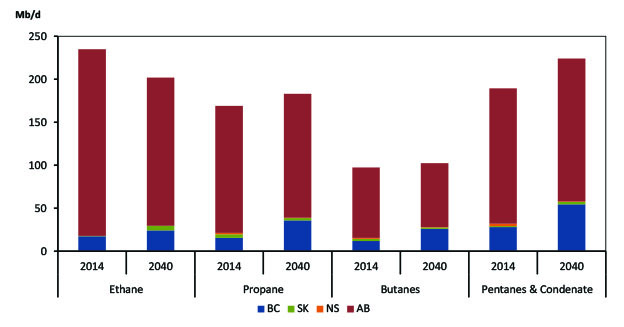
- Alberta currently produces most of Canada’s natural gas liquids (NGLs). Figure 2.7 shows this continuing in the EF 2016 outlook but also shows an increase for all NGLs in B.C. due to increasing natural gas production. Nova Scotia NGL production declines in line with its gas production outlook. Saskatchewan NGL production follows its gas production outlook, peaking in 2025 and decreasing thereafter.
Figure 2.7 - Reference Case NGL Production by Province
Energy Demand
- Energy use in Canada depends on many factors including: weather, technology trends, consumer tastes and preferences, policies and regulations, and economic variables such as income, employment, industrial activity, and energy prices. The projected trends, including the type of energy used, and how energy is used, vary significantly across Canada’s provinces and territories due to the country’s diversity.
- Energy use discussed in the figures below is end-use, or secondary energy demand, and includes energy used in four sectorsFootnote 1: residential, commercial, industrial and transportation. End use excludes the energy used to generate electricity, which is included under primary demand.
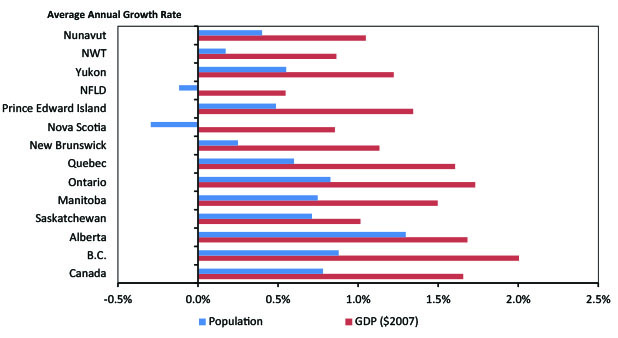
- Macroeconomic trends are a key determinant of energy use. Figure 2.8 illustrates the average annual growth rate for population and real gross domestic product (GDP)GDP over the EF 2016 projection period for the Reference Case.
Figure 2.8 - Population and GDP Growth Comparison, 2014 to 2040
Energy Demand Trends
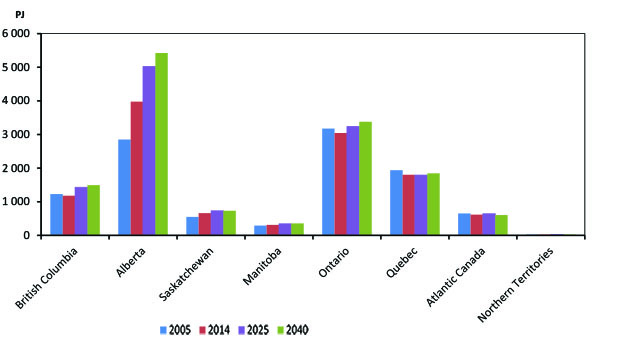
- In the Reference Case, total Canadian energy use grows from 11 626 petajoules (PJ) in 2014 to 13 868 PJ in 2040. As shown in Figure 2.9, end-use levels vary substantially across the country and, with the exception of Atlantic Canada, there is generally a trend of increasing energy use.
- In the EF 2016 Reference Case, Alberta leads demand growth as it has for the last decade. Oil and gas production, particularly in the oil sands, is energy intensive. Alberta’s increasing energy use is related to the production trends and associated economic growth shown in Figures 2.3, 2.4, and 2.5. While lower in absolute terms, B.C. experiences an increase resulting from the large increase in natural gas production required to supply the assumed LNG export facilities.
- Trends in Ontario and Quebec reflect a gradual increase in energy use after considerable declines from 2005 levels. This was related to the impact of the 2008-2009 global economic downturn, when both provinces saw significant declines in energy use, particularly in manufacturing.
- The increase in energy use in Saskatchewan reflects growth in potash mining, manufacturing and tight oil development expected to occur in the province during the projection. Increases in Manitoba relate to growth in manufacturing activity.
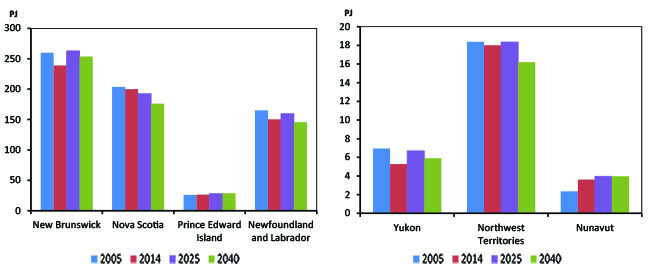
- Given their relatively small populations, energy use trends in Atlantic Canada and the territories can be especially volatile. Changes in industrial activity, like the opening or closing of a single mine or plant, can have significant impacts on overall energy use. This is reflected in the outlook for the provinces and territories in these regions.
Figure 2.9 - Energy Demand, Reference Case
Energy Demand by Region
Atlantic and Northern Territory Detail
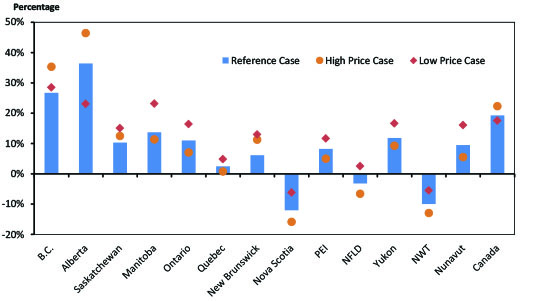
- Figure 2.10 illustrates projected regional growth in energy consumption from 2014 to 2040 for the Reference, High and Low Price Cases. Total Canadian energy use grows by 19 per cent over the projection in the Reference Case, 22 per cent in the High Case, and 17 per cent in the Low Case. The impact of higher and lower prices is not uniform across the country. Alberta and B.C. have the highest demand growth in the High Price Case, as higher oil and gas prices encourage higher energy production. This outweighs the effect of higher prices in other provinces, which tends to reduce demand. In the Low Price Case, lower growth in Alberta’s oil production and the corresponding economic impacts reduces demand, offsetting increasing demand from lower energy prices in other provinces.
- Newfoundland and Labrador, Nova Scotia, and NWT are the only provinces and territory that experience declining end-use demand. In Nova Scotia, this is related to projected population growth, slow economic growth, as well as the energy use associated with declining offshore gas production. In Newfoundland and Labrador, it is related to oil production declines from maturing offshore fields and the assumption that only one future discovery is developed. In NWT, it is related to the decline of natural gas production which reduces its availability. East Coast offshore and Northern exploration continues and future discoveries and developments in these areas represent a key uncertainty to the energy supply and demand projections for the territories and Atlantic Canada.
Figure 2.10 - Percentage Growth in Energy Demand, Reference Case and Price Cases, 2014 to 2040
Fuel Mix Trends
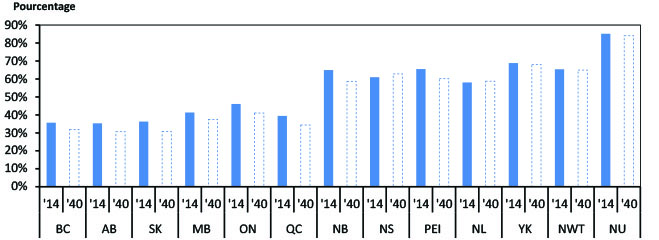
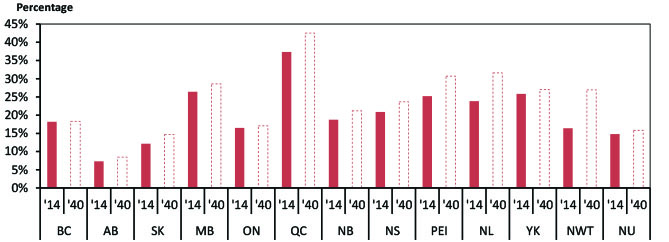
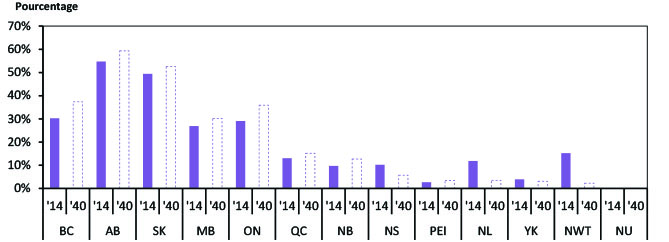
- The types of energy used vary between the provinces and territories. The three charts in Figure 2.11 reflect the share of secondary end-use demand for refined petroleum products and liquids, electricity, and natural gasFootnote 2.
- Atlantic Canada and the territories use a much higher share of refined products than the rest of the country, primarily due to the limited availability, infrastructure limitations, and relatively higher cost of other energy sources. Notably, these regions rely on liquid fuels for heat and electricity generation more than other regions because they are more economic and can be transported to remote locations by truck.
- Provinces with large hydroelectric generation capacities tend to have lower electricity prices and electricity comprises a higher share of energy demand. In these provinces, electricity is more likely to be used to heat homes and buildings, as well as power some large industrial activities. For example, Quebec maintains a large aluminum production sector which is an electricity-intensive production process.
- In the western provinces natural gas is used relatively more than other regions because it is readily available and price competitive. It is the primary heating fuel in these provinces, and is used extensively in industrial activity. The cost and availability of natural gas and NGLs in Ontario and the western provinces also makes them prime locations for petrochemical and fertilizer production which use either for feedstock.
Figure 2.11 - Share of Energy Use by Fuel, 2014 and 2040
Refined Petroleum Products and Natural Gas Liquids
Electricity
Natural Gas
Greenhouse Gas Emissions
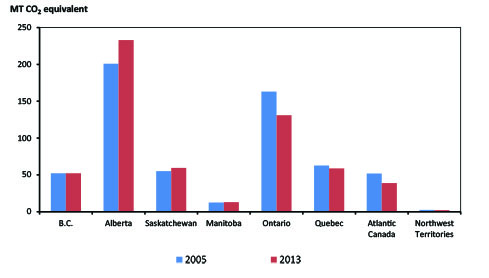
- Energy use and GHG emissions are directly related given the prevalence of fossil fuels in the Canadian and global energy mix. The majority of GHGs emitted in Canada result from the combustion of fossil fuels. Fossil fuels include crude oil, natural gas, coal, and refined petroleum products such as gasoline and diesel. Fossil fuels provide the vast majority of energy used to heat homes and businesses, transport goods and people, and power industrial equipment. Emissions from the combustion of fossil fuels, including those used for the production of energy, accounted for 81 per cent of Canadian GHG emissions in 2013Footnote 3. The remaining emissions are from non-energy sources such as agricultural and industrial processes, and waste handling.
- Figure 2.12 shows energy related GHG emissions by province and territory in 2005 and 2013, the last year for which this data is available from Environment and Climate Change Canada. Between 2005 and 2013, Canada’s total GHGs dropped by three per cent, or 23 Megatonnes (MT) carbon dioxide (CO2) equivalent. Key factors in this reduction include a drop in electric emissions due to declining coal-fired generation and increased renewable generation, as well as a decrease in industrial emissions associated with the 2008-2009 global economic downturn. However, this decrease was offset by increasing emissions from the oil and gas production sector, driven by increased production.
- These national trends are reflected in the regional results. For example, Ontario’s decline in emissions is associated with its phase out of coal-fired electricity, while the increase in Alberta GHGs follows the demand trends shown in Figure 2.9, where energy use and economic growth were driven by increasing oil production over this period.
Figure 2.12 - Energy-related GHG Emissions by Province and Territory, 2005 and 2013
Emissions by Region
Atlantic Canada and Northern Territory Detail
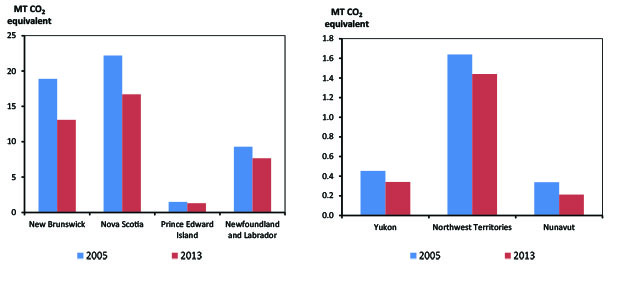
Source: Environment and Climate Change Canada
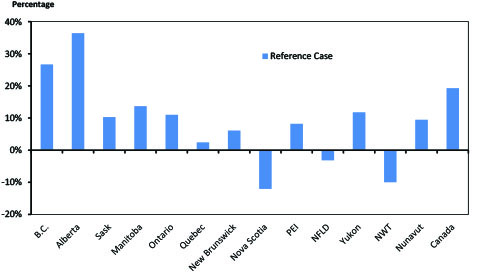
- In the Reference Case, total fossil fuel energy consumption increases by 22 per cent from 2014 to 2040 at an average of 0.8 per cent per year. This implies a trend of increasing GHG emissions. These increases are somewhat offset by faster growth in less emissions-intensive fuels, such as natural gas, and slower growth in more emissions-intensive fuels such as coal and refined petroleum products. Reference Case fossil fuel consumption growth by province and territory from 2014 to 2040 is shown in figure 2.13.
Figure 2.13 - Percentage Growth in Total Demand for Fossil Fuels, 2014 to 2040, Reference Case
- The fossil fuel demand projections in EF 2016 only include policies and programs that are law at the time of analysis in summer 2015. In recent months there have been several notable developments at the provincial level that provide considerable uncertainty to these projections, largely relating to the recent climate conference in Paris. These developments include:
- In the spring of 2015, the Alberta government convened an advisory panel to review the province’s climate policies and provide advice on a new set of policies. In November 2015, the panel released a broad suite of policy recommendations in its report to the Minister. Implementing an economy-wide price for GHG emissions was one of the panel’s recommendationsFootnote 4.
- In early December 2015, the premiers of Ontario, Quebec, and Manitoba signed a memorandum of understanding to facilitate the linking of future GHG cap and trade systems in Manitoba and Ontario with the existing system in QuebecFootnote 5. In late February Ontario released its draft cap and trade proposal for a public and stakeholder comment periodFootnote 6.
- In April 2015, B.C. announced the formation of a Climate Leadership Team to provide recommendations to build upon B.C.’s existing Climate Action Plan. The Climate Leadership Team released their report in late October 2015Footnote 7. The report provides 32 recommendations, including the development of several new strategies, and increasing B.C.’s existing $30 per tonne carbon tax by $10 annually, starting in 2018.
- In late November, the Government of Saskatchewan and SaskPower announced a target to increase the province’s share of renewable electricity generation capacity to 50 per centFootnote 8. This is expected to be led by increases in wind power, along with other renewables such as hydro, solar, biomass and geothermal.
- Date modified: