ARCHIVED – Canada’s Energy Future 2016: Province and Territory Outlooks
This page has been archived on the Web
Information identified as archived is provided for reference, research or recordkeeping purposes. It is not subject to the Government of Canada Web Standards and has not been altered or updated since it was archived. Please contact us to request a format other than those available.
Canada
Key Findings by Province and Territory
| EF 2016 Highlights at a Glance | |
|---|---|
| British Columbia |
|
| Alberta |
|
| Saskatchewan |
|
| Manitoba |
|
| Ontario |
|
|
|
|
|
|
|
|
|
|
|
|
|
|
|
|
|
| Canada | 2014 | 2020 | 2025 | 2030 | 2035 | 2040 | AAGR |
|---|---|---|---|---|---|---|---|
| 2014-2040 | |||||||
| Drivers | |||||||
| Real GDP (millions of 2007 dollars) | 1748748.0 | 1947533.0 | 2104426.0 | 2302254.0 | 2504613.0 | 2679948.0 | 1.7% |
| Population (thousands) | 35540.4 | 37606.6 | 39303.6 | 40915.2 | 42344.9 | 43506.9 | 0.8% |
| GDP per person (2007 dollars) | 49205 | 51787 | 53543 | 56269 | 59148 | 61598 | 0.9% |
| Energy Demand | |||||||
| End-use Energy Demand (PJ) | 11626.0 | 12808.2 | 13239.2 | 13548.1 | 13784.3 | 13868.0 | 0.7% |
| By Sector | |||||||
| Residential Sector | 1512.7 | 1564.5 | 1591.7 | 1611.7 | 1625.6 | 1634.9 | 0.3% |
| Commercial Sector | 1459.1 | 1589.0 | 1676.4 | 1762.8 | 1854.5 | 1914.1 | 1.0% |
| Industrial Sector | 5964.5 | 6873.0 | 7201.3 | 7372.8 | 7457.6 | 7461.3 | 0.9% |
| Transportation Sector | 2689.7 | 2781.6 | 2769.9 | 2800.8 | 2846.7 | 2857.7 | 0.2% |
| By Energy Source | |||||||
| Electricity | 1979.6 | 2104.4 | 2186.0 | 2280.8 | 2379.8 | 2463.7 | 0.8% |
| Natural Gas | 4135.0 | 4933.6 | 5341.9 | 5576.4 | 5737.2 | 5816.0 | 1.3% |
| RPP and NGLs | 4707.6 | 4970.4 | 4942.5 | 4945.7 | 4949.8 | 4901.0 | 0.2% |
| Other | 803.8 | 799.8 | 768.8 | 745.2 | 717.5 | 687.2 | -0.6% |
| Primary Energy Demand (PJ) | 13828.8 | 14835.6 | 15341.9 | 15714.8 | 16085.3 | 16233.2 | 0.6% |
| Oil and Natural Gas Liquids | |||||||
| Crude Oil Production (MMb/d) | 3887.4 | 4882.7 | 5475.8 | 5786.4 | 5968.0 | 6056.1 | 1.7% |
| Conventional - Light | 891.3 | 916.8 | 984.8 | 887.0 | 796.6 | 720.1 | -0.8% |
| Conventional - Heavy | 502.6 | 450.6 | 428.4 | 415.1 | 384.2 | 348.1 | -1.4% |
| Pentane Plus and field condensate | 189.5 | 208.4 | 221.7 | 225.5 | 226.7 | 224.0 | 0.6% |
| Mined Bitumen | 1038.2 | 1475.2 | 1557.0 | 1583.6 | 1613.2 | 1625.9 | 1.7% |
| In Situ Bitumen | 1266.0 | 1831.7 | 2284.0 | 2675.2 | 2947.4 | 3138.0 | 3.6% |
| (Upgraded Bitumen) | 954.5 | 1165.5 | 1184.2 | 1202.2 | 1227.4 | 1238.2 | 1.0% |
| NGL Production (MMb/d) | 690.6 | 678.8 | 703.0 | 709.8 | 714.6 | 711.5 | 0.1% |
| Ethane | 234.8 | 201.9 | 201.9 | 201.9 | 201.9 | 201.9 | -0.6% |
| Propane | 169.0 | 171.2 | 178.9 | 180.9 | 183.4 | 183.1 | 0.3% |
| Butane | 97.4 | 97.2 | 100.6 | 101.5 | 102.6 | 102.4 | 0.2% |
| Pentane Plus and field condensate | 189.5 | 208.4 | 221.7 | 225.5 | 226.7 | 224.0 | 0.6% |
| Natural Gas | |||||||
| Natural Gas Production (Bcf/d) | 14.7 | 16.1 | 17.7 | 17.7 | 17.8 | 17.9 | 0.8% |
| Solution | 1.9 | 1.7 | 1.8 | 1.8 | 1.7 | 1.6 | -0.7% |
| Non Associated | 4.1 | 2.8 | 2.2 | 1.8 | 1.5 | 1.3 | -4.2% |
| Tight | 7.0 | 10.2 | 12.3 | 12.8 | 13.3 | 13.6 | 2.6% |
| Shale | 0.6 | 0.7 | 1.0 | 1.0 | 1.1 | 1.1 | 2.6% |
| Coalbed Methane | 0.7 | 0.4 | 0.3 | 0.2 | 0.1 | 0.1 | -7.1% |
| Electricity | |||||||
| Generation (GW.h) | 641490 | 679054 | 716212 | 744702 | 773116 | 796418 | 0.8% |
| Capacity (MW) | 139603 | 155294 | 160581 | 166296 | 171685 | 172983 | 0.8% |
| Hydro/Wave/Tidal | 77203 | 81913 | 85298 | 86524 | 87339 | 87439 | 0.5% |
| Wind | 9041 | 15506 | 16872 | 18132 | 19034 | 19449 | 3.0% |
| Biomass/Geothermal | 2251 | 3155 | 3360 | 3551 | 3761 | 3811 | 2.0% |
| Solar | 1453 | 4692 | 4797 | 4872 | 4947 | 4970 | 4.8% |
| Uranium | 14320 | 10400 | 8370 | 10240 | 11080 | 11080 | -1.0% |
| Coal & Coke | 10219 | 9091 | 8893 | 5605 | 5849 | 5389 | -2.4% |
| Natural Gas | 21628 | 27679 | 30149 | 34584 | 36945 | 38015 | 2.2% |
| Oil | 3487 | 2857 | 2841 | 2788 | 2730 | 2830 | -0.8% |
| Key Indicators | |||||||
| Crude Oil Price (Brent) | 99.02 | 81.62 | 90.26 | 97.99 | 102.40 | 107.04 | 0.3% |
| Natural gas Price (Henry Hub) | 4.39 | 3.85 | 4.10 | 4.25 | 4.40 | 4.55 | 0.1% |
| For full data sets, including High Price, Low Price, Constrained, High LNG, and No LNG Cases, See the EF 2016 Data Appendices | |||||||
BC
British Columbia
Key Findings
Results refer to the Reference Case unless otherwise noted.
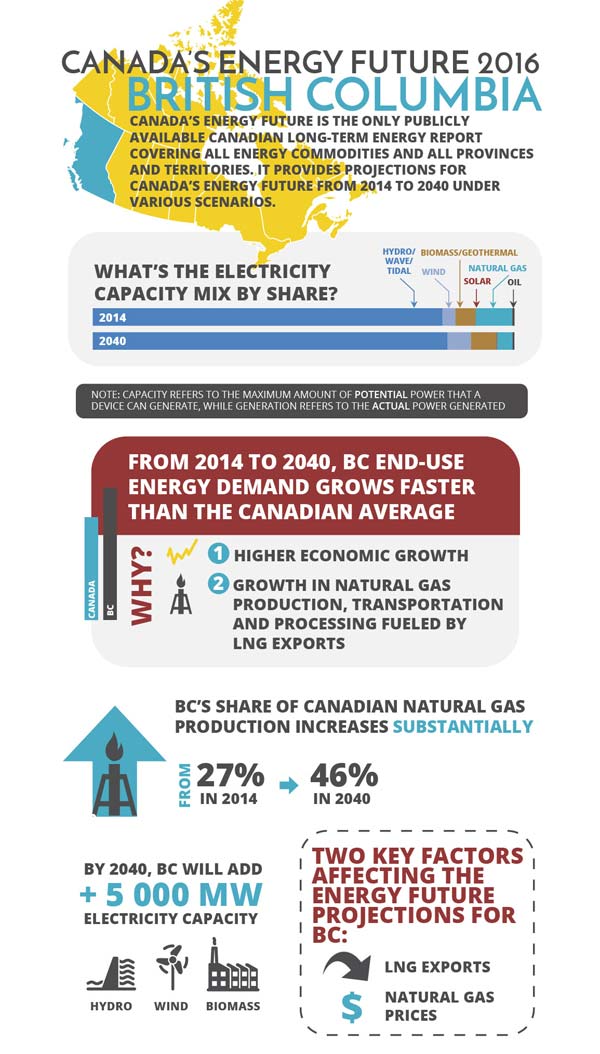
- B.C. leads Canadian natural gas production growth. B.C. natural gas production is expected to increase in all cases. In the Reference Case, B.C. natural gas production reaches 8.2 Bcf/d, an increase relative to 2014 levels of 4.0 Bcf/d. This is driven by the assumed 2.5 Bcf/d of LNG exports by 2023. B.C.’s share of Canadian production increases substantially, from 27 per cent in 2014 to 46 per cent in 2040.
- Both natural gas prices and LNG exports are key uncertainties for B.C. Trends in natural gas production, economic growth, and energy demand vary significantly across the price and LNG Cases. In the High Price and High LNG cases, production increases to 10.5 Bcf/d and 11.5 Bcf/d, respectively. In the Low Price and No LNG Cases, increases are limited to 7.3 Bcf/d and 6.0 Bcf/d, respectively.
- B.C. is projected to add nearly 5 000 MW of electric capacity over the projection period. This includes several large hydro facilities (Mica 5 and 6, Site C, and Revelstoke 6), and natural gas, wind, and biomass additions.
- B.C.’s economy and energy use grows faster than the Canadian average over the projection.B.C. end-use demand grows at an average annual growth rate of 0.9 per cent over the projection period, rising from 1 180 PJ in 2014 to 1 495 PJ in 2040. This is higher than the Canadian end-use demand growth of 0.7 per cent, which is attributable to B.C.’s higher economic growth and increasing energy use associated with growing natural gas production, transportation, and LNG liquefaction.
Figure BC.1 - Natural Gas Production by Case
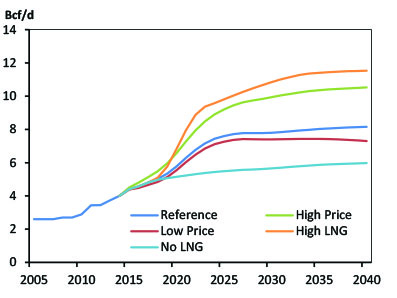
Notes: Natural gas production in B.C. increase in all cases. In the Reference Case, B.C. natural gas production reaches nearly 8.2 Bcf/d, relative to 4.0 Bcf/d in 2014. An important driver of the production growth is the assumed export of west coast LNG, with High LNG and No LNG Cases resulting in the highest and lowest long-term B.C. production respectively.
Figure BC.2 - Electricity Capacity Additions
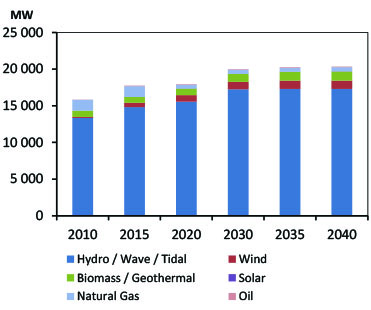
Notes: B.C.’s electric generation capacity increases from 16 860 MW in 2014 to 20 500 MW in 2040. Nearly 3 000 MW of this increase is from hydro power, with major additions including: Site C (2024), Revelstoke unit 6 (2020), and Mica units 5 (2014) and 6 (2015). By 2040, the capacity of wind and biomass generation almost doubles from current levels, reaching 2 400 MW. Also over the projection, BC is expected to retire close to 1 000 MW of natural gas fired capacity.
| British Columbia | 2014 | 2020 | 2025 | 2030 | 2035 | 2040 | AAGR |
|---|---|---|---|---|---|---|---|
| 2014-2040 | |||||||
| Drivers | |||||||
| Real GDP (millions of 2007 dollars) | 220707.0 | 253909.0 | 277030.0 | 310045.0 | 342097.0 | 369694.0 | 2.0% |
| Population (thousands) | 4631.3 | 4897.6 | 5111.1 | 5373.3 | 5619.9 | 5813.5 | 0.9% |
| GDP per person (2007 dollars) | 47656 | 51844 | 54202 | 57701 | 60872 | 63592 | 1.1% |
| Energy Demand | |||||||
| End-use Energy Demand (PJ) | 1179.7 | 1331.6 | 1433.1 | 1466.9 | 1491.2 | 1494.7 | 0.9% |
| By Sector | |||||||
| Residential Sector | 164.3 | 168.2 | 170.7 | 173.1 | 175.3 | 177.3 | 0.3% |
| Commercial Sector | 132.0 | 144.3 | 151.4 | 159.6 | 169.7 | 176.3 | 1.1% |
| Industrial Sector | 523.5 | 624.9 | 710.5 | 716.7 | 716.2 | 708.6 | 1.2% |
| Transportation Sector | 359.9 | 394.1 | 400.4 | 417.4 | 429.9 | 432.4 | 0.7% |
| By Energy Source | |||||||
| Electricity | 214.2 | 234.9 | 247.6 | 257.3 | 266.8 | 273.5 | 0.9% |
| Natural Gas | 357.1 | 439.9 | 528.9 | 539.7 | 551.5 | 558.6 | 1.7% |
| RPP and NGLs | 420.2 | 447.1 | 453.4 | 469.3 | 478.6 | 476.8 | 0.5% |
| Other | 188.2 | 209.8 | 203.1 | 200.6 | 194.2 | 185.7 | -0.1% |
| Primary Energy Demand (PJ) | 1309.9 | 1474.1 | 1594.6 | 1633.5 | 1664.3 | 1668.8 | 0.9% |
| Oil and Natural Gas Liquids | |||||||
| Crude Oil Production (MMb/d) | 49.5 | 63.8 | 78.7 | 86.6 | 88.8 | 87.4 | 2.2% |
| Conventional - Light | 21.6 | 25.3 | 29.5 | 33.7 | 34.3 | 32.8 | 1.6% |
| Conventional - Heavy | 0.0 | 0.0 | 0.0 | 0.0 | 0.0 | 0.0 | - |
| Pentane Plus and field condensate | 28.0 | 38.5 | 49.2 | 52.9 | 54.5 | 54.5 | 2.6% |
| Mined Bitumen | - | - | - | - | - | - | - |
| In Situ Bitumen | - | - | - | - | - | - | - |
| (Upgraded Bitumen) | - | - | - | - | - | - | - |
| NGL Production (MMb/d) | 63.5 | 84.2 | 111.0 | 117.0 | 121.9 | 124.1 | 2.6% |
| Ethane | 17.3 | 24.2 | 24.2 | 24.2 | 24.2 | 24.2 | 1.3% |
| Propane | 15.4 | 18.9 | 29.9 | 32.8 | 35.0 | 35.8 | 3.3% |
| Butane | 11.8 | 15.3 | 22.4 | 24.0 | 25.4 | 26.0 | 3.1% |
| Pentane Plus and field condensate | 18.9 | 25.9 | 34.5 | 36.0 | 37.4 | 38.1 | 2.7% |
| Natural Gas | |||||||
| Natural Gas Production (Bcf/d) | 4.0 | 5.8 | 7.6 | 7.8 | 8.0 | 8.2 | 2.8% |
| Solution | 0.0 | 0.0 | 0.0 | 0.0 | 0.0 | 0.0 | -0.5% |
| Non Associated | 0.9 | 0.5 | 0.4 | 0.3 | 0.2 | 0.2 | -5.6% |
| Tight | 2.5 | 4.8 | 6.4 | 6.8 | 7.0 | 7.2 | 4.1% |
| Shale | 0.5 | 0.5 | 0.8 | 0.7 | 0.7 | 0.7 | 1.3% |
| Coalbed Methane | - | - | - | - | - | - | - |
| Electricity | |||||||
| Generation (GW.h) | 67863 | 74893 | 81351 | 84229 | 86520 | 87495 | 1.0% |
| Capacity (MW) | 16858 | 18070 | 19504 | 20196 | 20480 | 20564 | 0.8% |
| Hydro/Wave/Tidal | 13979 | 15564 | 16714 | 17252 | 17302 | 17302 | 0.8% |
| Wind | 512 | 894 | 954 | 1014 | 1114 | 1134 | 3.1% |
| Biomass/Geothermal | 811 | 891 | 1011 | 1091 | 1211 | 1261 | 1.7% |
| Solar | 2 | 7 | 11 | 15 | 19 | 23 | 9.8% |
| Uranium | - | - | - | - | - | - | - |
| Coal & Coke | - | - | - | - | - | - | - |
| Natural Gas | 1472 | 632 | 732 | 742 | 752 | 762 | -2.5% |
| Oil | 82 | 82 | 82 | 82 | 82 | 82 | 0.0% |
| Key Indicators | |||||||
| Canada GDP (Billions of $2007) | 1748.7 | 1947.5 | 2104.4 | 2302.3 | 2504.6 | 2679.9 | 1.7% |
| Exchange Rate ($US per C$) | 0.90 | 0.81 | 0.80 | 0.80 | 0.82 | 0.82 | -0.4% |
| Crude Oil Price (Brent) | 99.02 | 81.62 | 90.26 | 97.99 | 102.40 | 107.04 | 0.3% |
| Natural gas Price (Henry Hub) | 4.39 | 3.85 | 4.10 | 4.25 | 4.40 | 4.55 | 0.1% |
| For full data sets, including High Price, Low Price, Constrained, High LNG, and No LNG Cases, See the EF 2016 Data Appendices | |||||||
AB
Alberta
Key Findings
Results refer to the Reference Case unless otherwise noted.
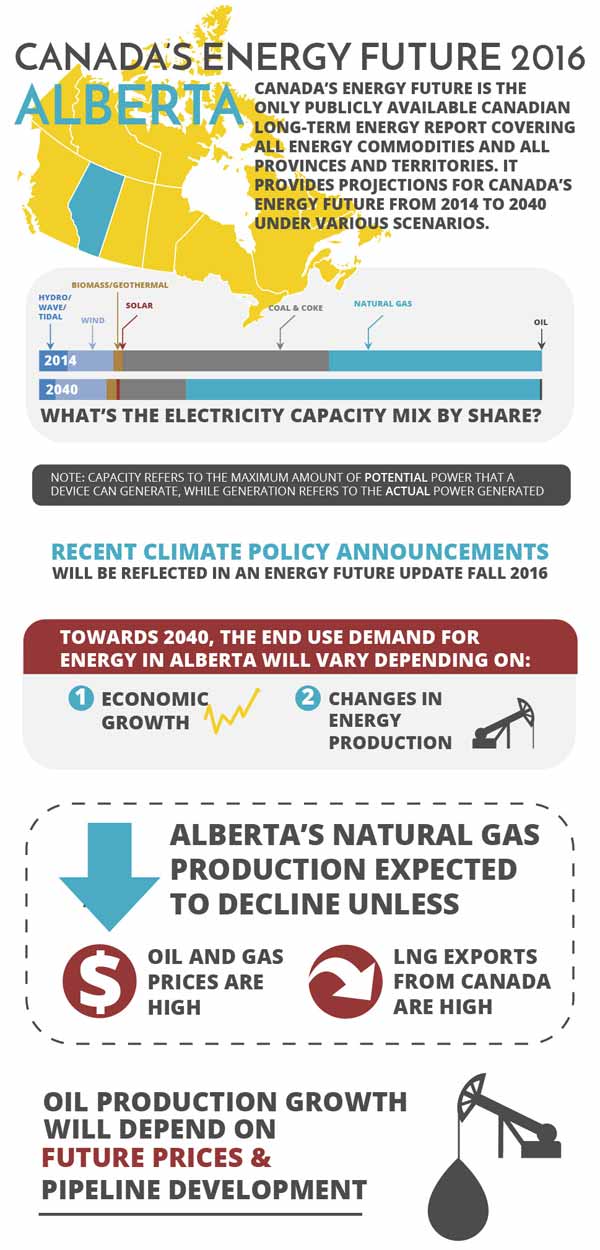
- Oil production growth is determined by future prices and infrastructure development. Alberta’s oil production is expected to increase, led by in-situ oil sands growth. Oil production increases 78 per cent over 2014 levels in the Reference Case, reaching 5.4 MMb/d by 2040. In the High Price Case production rises even faster, to 6.2 MMb/d by 2040. In the Low Price and Constrained Case, production still grows, but at a slower pace, with production in 2040 reaching 4.3 MMb/d in the Low Price Case, and 5.0 MMb/d in the Constrained Case.
- Gas production declines in all except the High Price and High LNG Cases. Alberta’s natural gas production in the Reference Case declines from 9.9 Bcf/d in 2014 to 9.5 Bcf/d in 2040. The Low Price and No LNG Cases also see production declining over the projection to 8.0 Bcf/d and 9.2 Bcf/d. The High Price case has production increasing to 12.7 Bcf/d, while in the High LNG Case, production is flat.
- End-use demand varies substantially by case. In the Reference Case, demand rises from 3 978 PJ in 2014 to 5 426 PJ in 2040, an increase of 36 per cent. Alberta demand varies substantially in several other cases because of variations in energy production and economic growth. The High, Low and Constrained Cases grow 46, 23 and 30 per cent and demand reaches 5 816 PJ, 4 888 PJ, and 5 188 PJ, respectively.
- Recent policy announcements are a key uncertainty to the projections. The EF 2016 demand projections do not include the impact of Alberta’s new climate policy, announced in late 2015. Key changes may include an economy-wide carbon price, a cap on oil sands emissions, and a phase out of GHG emitting coal-fired generation by 2030.
Figure AB.1 - Oil Production by Case
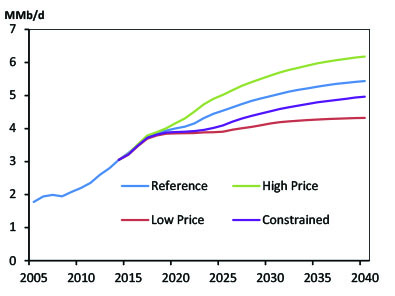
Notes: Oil production in Alberta increases In the Reference Case, reaching 5.4 MMb/d in 2040, an increase of 79 per cent relative to 2014 levels. Production in the High Price Case, Low Price Case and Constrained Case reaches 6.2 MMb/d, 4.3 MMb/d and 5.0 MMb/d, respectively, by 2040.
Figure AB.2 - Natural Gas Production by Case
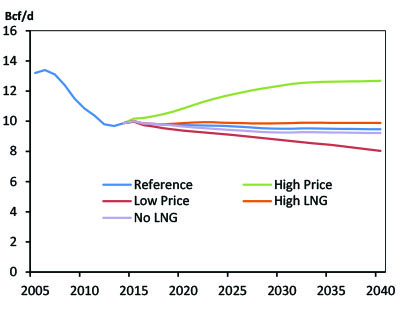
Notes: Alberta’s natural gas production declines slightly in the Reference Case, down to 9.5 Bcf/d in 2040 or four per cent below 2014 levels. Production in the High Price Case, Low Price Case, High LNG Case and No LNG Case reached 13 Bcf/d, eight Bcf/d, 10 Bcf/d and nine Bcf/d, respectively, by 2040.
| Alberta | 2014 | 2020 | 2025 | 2030 | 2035 | 2040 | AAGR |
|---|---|---|---|---|---|---|---|
| 2014-2040 | |||||||
| Drivers | |||||||
| Real GDP (millions of 2007 dollars) | 316358.0 | 343874.0 | 382813.0 | 416526.0 | 455334.0 | 488191.0 | 1.7% |
| Population (thousands) | 4121.7 | 4496.8 | 4876.4 | 5184.7 | 5466.2 | 5762.1 | 1.3% |
| GDP per person (2007 dollars) | 76754 | 76471 | 78503 | 80338 | 83300 | 84724 | 0.4% |
| Energy Demand | |||||||
| End-use Energy Demand (PJ) | 3977.5 | 4718.3 | 5022.6 | 5221.7 | 5363.4 | 5426.1 | 1.2% |
| By Sector | |||||||
| Residential Sector | 224.3 | 238.3 | 245.5 | 251.3 | 255.9 | 259.6 | 0.6% |
| Commercial Sector | 366.6 | 403.7 | 428.8 | 450.1 | 467.1 | 478.8 | 1.0% |
| Industrial Sector | 2892.4 | 3542.6 | 3770.1 | 3907.3 | 3982.7 | 3990.1 | 1.2% |
| Transportation Sector | 494.1 | 533.7 | 578.1 | 612.9 | 657.6 | 697.6 | 1.3% |
| By Energy Source | |||||||
| Electricity | 291.7 | 343.0 | 375.5 | 406.3 | 435.7 | 460.6 | 1.8% |
| Natural Gas | 2178.1 | 2708.1 | 2939.8 | 3093.1 | 3186.1 | 3220.4 | 1.5% |
| RPP and NGLs | 1402.7 | 1566.5 | 1611.5 | 1631.4 | 1654.6 | 1661.9 | 0.7% |
| Other | 105.0 | 100.6 | 95.7 | 90.8 | 86.9 | 83.2 | -0.9% |
| Primary Energy Demand (PJ) | 4483.6 | 5310.9 | 5607.2 | 5810.4 | 6041.6 | 6139.1 | 1.2% |
| Oil and Natural Gas Liquids | |||||||
| Crude Oil Production (MMb/d) | 3051.7 | 4002.3 | 4542.4 | 4980.4 | 5267.2 | 5437.6 | 2.2% |
| Conventional - Light | 437.2 | 399.6 | 410.6 | 432.6 | 425.4 | 404.2 | -0.3% |
| Conventional - Heavy | 153.2 | 131.5 | 124.0 | 121.3 | 113.2 | 103.5 | -1.5% |
| Pentane Plus and field condensate | 157.2 | 164.3 | 166.9 | 167.7 | 168.0 | 166.0 | 0.2% |
| Mined Bitumen | 1038.2 | 1475.2 | 1557.0 | 1583.6 | 1613.2 | 1625.9 | 1.7% |
| In Situ Bitumen | 1266.0 | 1831.7 | 2284.0 | 2675.2 | 2947.4 | 3138.0 | 3.6% |
| (Upgraded Bitumen) | 954.5 | 1165.5 | 1184.2 | 1202.2 | 1227.4 | 1238.2 | 1.0% |
| NGL Production (MMb/d) | 603.8 | 563.1 | 559.3 | 559.3 | 560.3 | 557.0 | -0.3% |
| Ethane | 217.0 | 172.3 | 172.3 | 172.3 | 172.3 | 172.3 | -0.9% |
| Propane | 147.7 | 147.7 | 144.7 | 144.3 | 145.0 | 144.2 | -0.1% |
| Butane | 81.9 | 79.0 | 75.5 | 75.0 | 75.1 | 74.5 | -0.4% |
| Pentane Plus and field condensate | 157.2 | 164.3 | 166.9 | 167.7 | 168.0 | 166.0 | 0.2% |
| Natural Gas | |||||||
| Natural Gas Production (Bcf/d) | 9.9 | 9.7 | 9.7 | 9.5 | 9.5 | 9.5 | -0.2% |
| Solution | 1.7 | 1.5 | 1.5 | 1.5 | 1.5 | 1.4 | -0.7% |
| Non Associated | 3.1 | 2.3 | 1.8 | 1.5 | 1.3 | 1.1 | -3.9% |
| Tight | 4.3 | 5.4 | 5.8 | 6.0 | 6.2 | 6.4 | 1.6% |
| Shale | 0.1 | 0.2 | 0.3 | 0.3 | 0.4 | 0.4 | 7.4% |
| Coalbed Methane | 0.7 | 0.4 | 0.3 | 0.2 | 0.1 | 0.1 | -7.1% |
| Electricity | |||||||
| Generation (GW.h) | 81342 | 100354 | 109747 | 116959 | 125841 | 134489 | 2.0% |
| Capacity (MW) | 15561 | 21189 | 23096 | 23274 | 25911 | 27111 | 2.2% |
| Hydro/Wave/Tidal | 874 | 874 | 874 | 874 | 874 | 874 | 0.0% |
| Wind | 1420 | 2276 | 2441 | 2606 | 2743 | 2743 | 2.6% |
| Biomass/Geothermal | 286 | 377 | 427 | 477 | 527 | 527 | 2.4% |
| Solar | 4 | 54 | 104 | 154 | 204 | 204 | 16.3% |
| Uranium | - | - | - | - | - | - | - |
| Coal & Coke | 6391.3 | 5822 | 5664 | 3177 | 3577 | 3577 | -2.2% |
| Natural Gas | 6579 | 11779 | 13579 | 15979 | 17979 | 19079 | 4.2% |
| Oil | 7 | 7 | 7 | 7 | 7 | 107 | 11.1% |
| Key Indicators | |||||||
| Canada GDP (Billions of $2007) | 1748.7 | 1947.5 | 2104.4 | 2302.3 | 2504.6 | 2679.9 | 1.7% |
| Exchange Rate ($US per C$) | 0.90 | 0.81 | 0.80 | 0.80 | 0.82 | 0.82 | -0.4% |
| Crude Oil Price (Brent) | 99.02 | 81.62 | 90.26 | 97.99 | 102.40 | 107.04 | 0.3% |
| Natural gas Price (Henry Hub) | 4.39 | 3.85 | 4.10 | 4.25 | 4.40 | 4.55 | 0.1% |
| For full data sets, including High Price, Low Price, Constrained, High LNG, and No LNG Cases, See the EF 2016 Data Appendices | |||||||
SK
Saskatchewan
Key Findings
Results refer to the Reference Case unless otherwise noted.
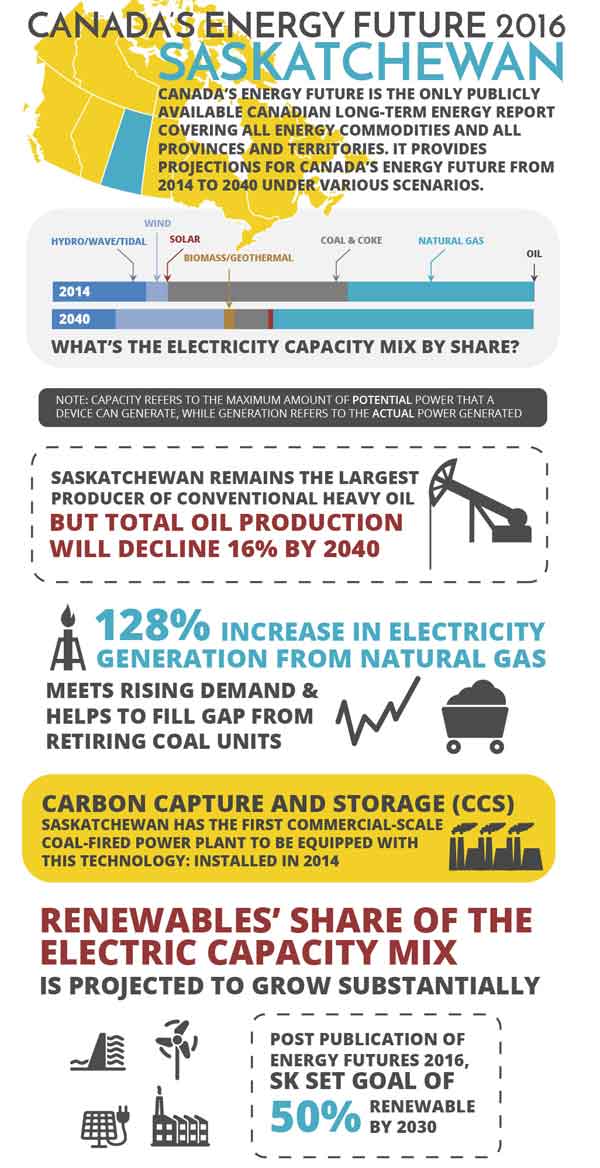
- Oil production declines in all cases except the High Price Case. While Saskatchewan remains the largest producer of conventional heavy oil in the Reference Case, total oil production declines 16 per cent below 2014 levels, from 509 Mb/d to 429 Mb/d by 2040. The High Price Case is the only case where production increases by 2040, reaching 532 Mb/d. In the Low Price Case oil production declines to 343 Mb/d by 2040.
- New electric capacity will be required to meet demand and replace retiring coal units.Over the projection period, Saskatchewan electricity demand increases at an average annual rate of 1.1 per cent, or approximately seven TW.h. In EF 2016, demand growth and replacement of coal is met mostly by natural gas generation, which increases from 8 500 gigawatt hours (GW.h) in 2014 to 20 500 GW.h in 2040. In 2014 Boundary Dam 3 became the first commercial-scale coal-fired power plant equipped with Carbon Capture and Storage (CCS) capacity. Additional coal with CCS capacity is also added later in the projection period.
- Renewable’s share of the electric capacity mix is projected to grow substantially. In the fall of 2015, Saskatchewan announced a target of 50 per cent renewable power by 2030. In the EF 2016 projections, which were completed before this announcement, the share of renewable capacity increases from 25 to 40 per cent over the projection period.
Figure SK.1 - Oil Production by Case
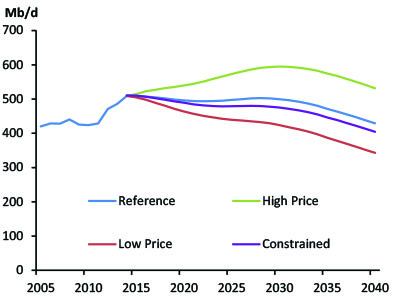
Notes: Oil production in Saskatchewan declines in every case except the High Price Case, where it reaches 0.53 MMb/d, a growth of 3.3 per cent over 2014 levels. The Low Price Case has the largest negative impact on oil production, decreasing it to 0.34 MMb/d, 32 per cent below 2014 levels.
Figure SK.2 - Projected Electric Generation Capacity
Notes: Saskatchewan currently relies on coal for baseload generation; over the projection period it becomes a smaller share of the province’s electric capacity mix. In 2014 the first commercial-scale coal-fired power plant equipped with CCS technology started up at the Boundary Dam station.
| Saskatchewan | 2014 | 2020 | 2025 | 2030 | 2035 | 2040 | AAGR |
|---|---|---|---|---|---|---|---|
| 2014-2040 | |||||||
| Drivers | |||||||
| Real GDP (millions of 2007 dollars) | 63585.0 | 68522.0 | 71851.0 | 75972.0 | 79736.0 | 82667.0 | 1.0% |
| Population (thousands) | 1125.4 | 1203.4 | 1250.1 | 1286.1 | 1319.3 | 1353.0 | 0.7% |
| GDP per person (2007 dollars) | 56500 | 56940 | 57476 | 59072 | 60438 | 61099 | 0.3% |
| Energy Demand | |||||||
| End-use Energy Demand (PJ) | 663.7 | 714.0 | 732.1 | 741.8 | 740.2 | 732.0 | 0.4% |
| By Sector | |||||||
| Residential Sector | 52.0 | 54.7 | 55.8 | 56.6 | 57.1 | 57.4 | 0.4% |
| Commercial Sector | 98.0 | 111.5 | 118.6 | 120.5 | 123.0 | 124.3 | 0.9% |
| Industrial Sector | 362.2 | 390.6 | 403.5 | 412.3 | 409.3 | 402.5 | 0.4% |
| Transportation Sector | 151.5 | 157.2 | 154.2 | 152.3 | 150.7 | 147.8 | -0.1% |
| By Energy Source | |||||||
| Electricity | 80.6 | 89.5 | 95.4 | 100.5 | 104.5 | 107.4 | 1.1% |
| Natural Gas | 328.2 | 367.5 | 383.8 | 391.9 | 390.2 | 384.9 | 0.6% |
| RPP and NGLs | 240.8 | 241.9 | 238.0 | 234.5 | 230.6 | 225.0 | -0.3% |
| Other | 14.0 | 15.0 | 14.9 | 14.9 | 14.9 | 14.8 | 0.2% |
| Primary Energy Demand (PJ) | 808.4 | 856.7 | 883.4 | 876.2 | 888.2 | 868.3 | 0.3% |
| Oil and Natural Gas Liquids | |||||||
| Crude Oil Production (MMb/d) | 509.2 | 496.2 | 497.4 | 499.8 | 471.4 | 429.3 | -0.7% |
| Conventional - Light | 158.7 | 173.5 | 189.0 | 202.2 | 197.2 | 181.8 | 0.5% |
| Conventional - Heavy | 349.3 | 319.1 | 304.4 | 293.8 | 270.9 | 244.6 | -1.4% |
| Pentane Plus and field condensate | 1.2 | 3.6 | 4.0 | 3.8 | 3.3 | 2.8 | 3.3% |
| Mined Bitumen | - | - | - | - | - | - | - |
| In Situ Bitumen | - | - | - | - | - | - | - |
| (Upgraded Bitumen) | - | - | - | - | - | - | - |
| NGL Production (MMb/d) | 8.5 | 14.7 | 15.0 | 14.3 | 13.5 | 12.7 | 1.6% |
| Ethane | 0.6 | 5.4 | 5.4 | 5.4 | 5.4 | 5.4 | 9.0% |
| Propane | 4.2 | 3.5 | 3.4 | 3.2 | 2.9 | 2.7 | -1.6% |
| Butane | 2.5 | 2.2 | 2.1 | 2.0 | 1.8 | 1.7 | -1.4% |
| Pentane Plus and field condensate | 1.2 | 3.6 | 4.0 | 3.8 | 3.3 | 2.8 | 3.3% |
| Natural Gas | |||||||
| Natural Gas Production (Bcf/d) | 0.4 | 0.3 | 0.3 | 0.2 | 0.2 | 0.2 | -3.0% |
| Solution | 0.2 | 0.2 | 0.2 | 0.2 | 0.2 | 0.2 | -0.4% |
| Non Associated | 0.1 | 0.0 | 0.0 | 0.0 | 0.0 | 0.0 | -4.3% |
| Tight | 0.2 | 0.1 | 0.1 | 0.0 | 0.0 | 0.0 | -9.6% |
| Shale | - | - | - | - | - | - | - |
| Coalbed Methane | - | - | - | - | - | - | - |
| Electricity | |||||||
| Generation (GW.h) | 25880 | 27120 | 28993 | 32119 | 33914 | 33908 | 1.0% |
| Capacity (MW) | 4416 | 5301 | 6371 | 7025 | 7415 | 7225 | 1.9% |
| Hydro/Wave/Tidal | 855 | 855 | 930 | 930 | 955 | 955 | 0.4% |
| Wind | 197 | 474 | 974 | 1374 | 1524 | 1624 | 8.5% |
| Biomass/Geothermal | 0 | 161 | 161 | 161 | 161 | 161 | - |
| Solar | 2 | 17 | 32 | 47 | 62 | 77 | 15.1% |
| Uranium | - | - | - | - | - | - | - |
| Coal & Coke | 1651.38 | 1651 | 1611 | 810 | 810 | 505 | -4.5% |
| Natural Gas | 1710 | 2142 | 2662 | 3702 | 3902 | 3902 | 3.2% |
| Oil | 1 | 1 | 1 | 1 | 1 | 1 | 0.0% |
| Key Indicators | |||||||
| Canada GDP (Billions of $2007) | 1748.7 | 1947.5 | 2104.4 | 2302.3 | 2504.6 | 2679.9 | 1.7% |
| Exchange Rate ($US per C$) | 0.90 | 0.81 | 0.80 | 0.80 | 0.82 | 0.82 | -0.4% |
| Crude Oil Price (Brent) | 99.02 | 81.62 | 90.26 | 97.99 | 102.40 | 107.04 | 0.3% |
| Natural gas Price (Henry Hub) | 4.39 | 3.85 | 4.10 | 4.25 | 4.40 | 4.55 | 0.1% |
| For full data sets, including High Price, Low Price, Constrained, High LNG, and No LNG Cases, See the EF 2016 Data Appendices | |||||||
MB
Manitoba
Key Findings
Results refer to the Reference Case unless otherwise noted.
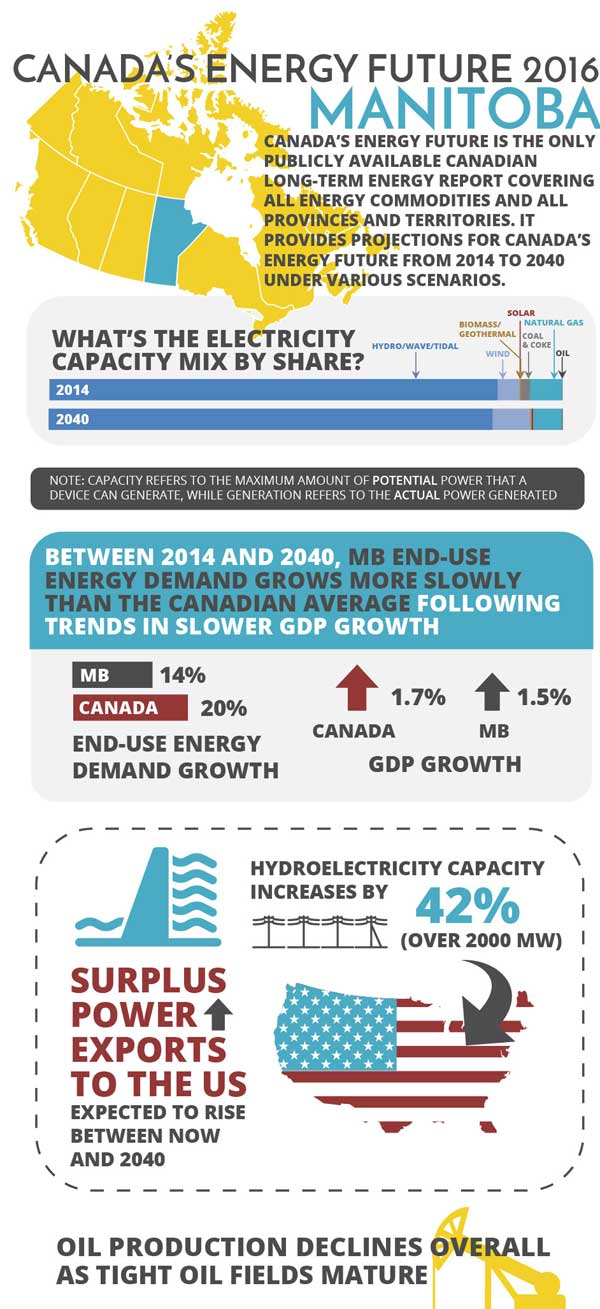
- Manitoba hydroelectric capacity increases by over 2 000 MW. EF 2016 assumes that both Keeyask and Conawappa hydro facilities are built over the projection period, which leads to significant increases in electricity exports from the province. For the past ten years Manitoba has been exporting surplus power to the U.S. and neighboring provinces. Boosted by long-term fixed contracts and the addition of Keeyask and Conawapa, Manitoba’s exports to the U.S. are expected to rise by the end of the projection period.
- Manitoba’s energy use grows slower than the national average. Manitoba end-use demand grows at an average rate of 0.5 per cent per year over the projection period, increasing from 315 PJ in 2014 to 358 PJ in 2040. This is lower than the 0.7 per cent per year rate of Canadian end-use demand. This follows trends in economic growth, where the province’s annual average GDP growth rate of 1.5 per cent is also slower than the Canadian rate of 1.7 per cent.
- Manitoba oil production declines in all cases.Driven by developments in tight oil, Manitoba oil production increased rapidly from 2010 to 2013 reaching 55.5 Mb/d. Production declined in 2014 to 46.0 Mb/d and is expected to continue declining in all EF 2016 cases, reaching 14 Mb/d by 2040. This decline reflects the current limited resource potential of the tight oil resources in Manitoba. The different prices in the various cases affect how quickly production declines.
Figure MB.1 - Energy Use By Sector
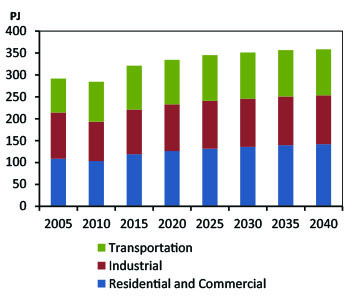
Notes: Manitoba end-use demand grows to 358 PJ in 2040 or 14 per cent over 2014 levels. Energy use is driven higher by low prices in the Low Price Case, reaching 381 PJ in 2040 and lower by higher prices in the High Price Case, reaching 344 PJ.
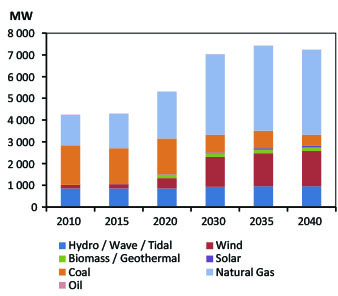
Figure MB.2 - Electric Capacity Additions
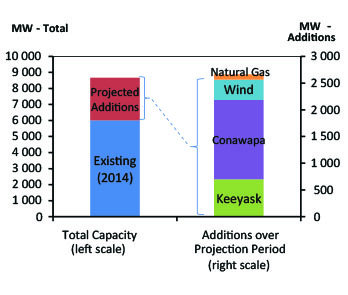
Notes: Manitoba’s electric generation capacity increases from 6 000 MW in 2014 to 8 600 MW in 2040. The majority of Manitoba’s capacity mix is hydroelectric generation, and this continues in the EF 2016 projection. Manitoba’s capacity increases with two major hydro additions, Keeyask (700 MW, online in 2020-21) and Conawapa (1 485 MW, online in 2025), along with nearly 400 MW of additional wind capacity and modest amounts of other renewables.
| Manitoba | 2014 | 2020 | 2025 | 2030 | 2035 | 2040 | AAGR |
|---|---|---|---|---|---|---|---|
| 2014-2040 | |||||||
| Drivers | |||||||
| Real GDP (millions of 2007 dollars) | 57111.0 | 62804.0 | 68769.0 | 74094.0 | 79478.0 | 84035.0 | 1.5% |
| Population (thousands) | 1282.0 | 1373.1 | 1434.7 | 1489.1 | 1528.0 | 1555.9 | 0.7% |
| GDP per person (2007 dollars) | 44548 | 45739 | 47933 | 49758 | 52014 | 54011 | 0.7% |
| Energy Demand | |||||||
| End-use Energy Demand (PJ) | 315.0 | 334.3 | 344.7 | 350.9 | 356.4 | 358.2 | 0.5% |
| By Sector | |||||||
| Residential Sector | 56.6 | 58.6 | 59.7 | 60.7 | 61.6 | 62.4 | 0.4% |
| Commercial Sector | 59.7 | 67.6 | 72.0 | 75.2 | 78.0 | 79.5 | 1.1% |
| Industrial Sector | 101.1 | 106.4 | 108.9 | 110.0 | 111.0 | 111.5 | 0.4% |
| Transportation Sector | 97.5 | 101.7 | 104.2 | 105.1 | 105.8 | 104.8 | 0.3% |
| By Energy Source | |||||||
| Electricity | 83.2 | 88.1 | 92.2 | 95.9 | 99.5 | 102.4 | 0.8% |
| Natural Gas | 84.6 | 95.2 | 100.2 | 103.3 | 106.2 | 108.1 | 0.9% |
| RPP and NGLs | 130.2 | 133.9 | 136.5 | 137.0 | 136.7 | 134.4 | 0.1% |
| Other | 17.0 | 17.1 | 15.8 | 14.8 | 14.0 | 13.3 | -0.9% |
| Primary Energy Demand (PJ) | 374.6 | 396.5 | 422.9 | 429.2 | 434.5 | 435.6 | 0.6% |
| Oil and Natural Gas Liquids | |||||||
| Crude Oil Production (MMb/d) | 46.0 | 24.5 | 19.8 | 18.1 | 16.0 | 14.1 | -4.4% |
| Conventional - Light | 46.0 | 24.5 | 19.8 | 18.1 | 16.0 | 14.1 | -4.4% |
| Conventional - Heavy | - | - | - | - | - | - | - |
| Pentane Plus and field condensate | - | - | - | - | - | - | - |
| Mined Bitumen | - | - | - | - | - | - | - |
| In Situ Bitumen | - | - | - | - | - | - | - |
| (Upgraded Bitumen) | - | - | - | - | - | - | - |
| NGL Production (MMb/d) | - | - | - | - | - | - | - |
| Ethane | - | - | - | - | - | - | - |
| Propane | - | - | - | - | - | - | - |
| Butane | - | - | - | - | - | - | - |
| Pentane Plus and field condensate | - | - | - | - | - | - | - |
| Natural Gas | |||||||
| Natural Gas Production (Bcf/d) | - | - | - | - | - | - | - |
| Solution | - | - | - | - | - | - | - |
| Non Associated | - | - | - | - | - | - | - |
| Tight | - | - | - | - | - | - | - |
| Shale | - | - | - | - | - | - | - |
| Coalbed Methane | - | - | - | - | - | - | - |
| Electricity | |||||||
| Generation (GW.h) | 39479 | 41595 | 53530 | 54711 | 55730 | 56382 | 1.4% |
| Capacity (MW) | 6009 | 6507 | 8387 | 8452 | 8547 | 8601 | 1.4% |
| Hydro/Wave/Tidal | 5239 | 5639 | 7424 | 7424 | 7424 | 7424 | 1.3% |
| Wind | 258 | 348 | 438 | 498 | 588 | 638 | 3.5% |
| Biomass/Geothermal | 22 | 22 | 22 | 22 | 22 | 22 | 0.0% |
| Solar | 2 | 8 | 13 | 18 | 23 | 27 | 10.5% |
| Uranium | - | - | - | - | - | - | - |
| Coal & Coke | 97.64 | 0 | 0 | 0 | 0 | 0 | -100% |
| Natural Gas | 378 | 478 | 478 | 478 | 478 | 478 | 0.9% |
| Oil | 12 | 12 | 12 | 12 | 12 | 12 | 0.0% |
| Key Indicators | |||||||
| Canada GDP (Billions of $2007) | 1748.7 | 1947.5 | 2104.4 | 2302.3 | 2504.6 | 2679.9 | 1.7% |
| Exchange Rate ($US per C$) | 0.90 | 0.81 | 0.80 | 0.80 | 0.82 | 0.82 | -0.4% |
| Crude Oil Price (Brent) | 99.02 | 81.62 | 90.26 | 97.99 | 102.40 | 107.04 | 0.3% |
| Natural gas Price (Henry Hub) | 4.39 | 3.85 | 4.10 | 4.25 | 4.40 | 4.55 | 0.1% |
| For full data sets, including High Price, Low Price, Constrained, High LNG, and No LNG Cases, See the EF 2016 Data Appendices | |||||||
ON
Ontario
Key Findings
Results refer to the Reference Case unless otherwise noted.
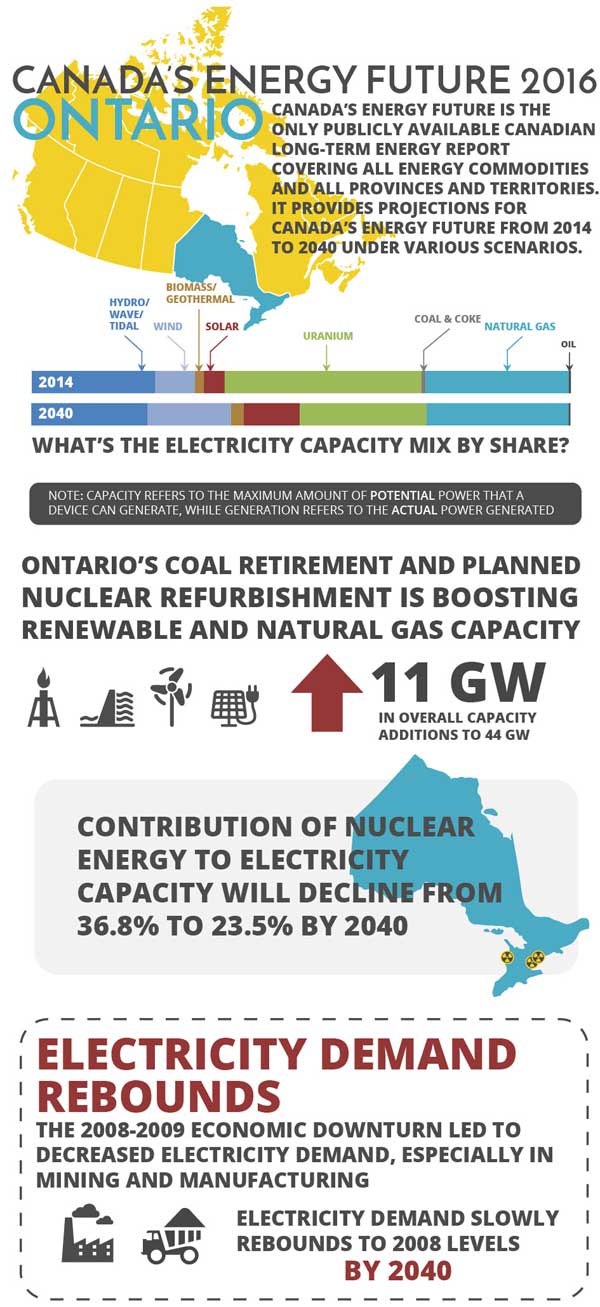
- Ontario’s recent coal retirements and planned nuclear refurbishments boost renewable and natural gas capacity growth. Over the projection period, Ontario is expected to add over 11 gigawatts (GW) of new capacity. Wind, solar, and natural gas will make up 90 per cent of new additions, increasing 4.8, 3.2 and 2.3 GW, respectively. Ontario has the largest solar and wind deployment in Canada with a combined installed capacity of over 4 000 MW. By 2040, their capacity of wind, solar and biomass is estimated to reach 12 497 MW, accounting for 28 per cent of total supply.
- Electricity demand grows modestly but fails to reach 2008 peak levels. The 2008 economic downturn led to a large contraction in Ontario’s electricity-intensive mining and manufacturing sectors. Demand for electricity in the province is currently still below the 2008 peak level, and is not expected to exceed that peak during the projection period. Future expansion of Ontario’s industrial sector is a key uncertainty for electric demand. In particular, accelerated future growth in the mining sector could lead to higher electric demand growth in the province.
- End-use demand grows slightly over the projection period. Total Ontario end-use demand increases from 3 045 PJ to 3 380 PJ over the projection, as declines in the transportation sector are outweighed by gains in the industrial, commercial and residential sectors. EF 2016 sensitivity cases have modest impacts on Ontario’s end-use demand, the High and Low Price Cases resulting in 3 259 PJ and 3 544 PJ of demand by 2040, respectively.
Figure ON.1 - Electricity Demand
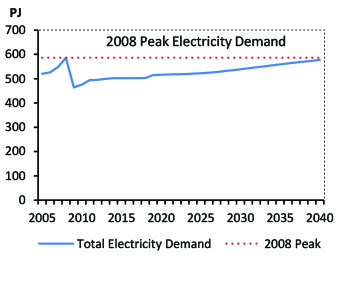
Notes: Electricity demand in Ontario peaked in 2008 and declined rapidly thereafter due to the 2008-2009 economic downturn. This chart illustrates the effect of the downturn. Despite Ontario’s growth in industrial and building demand, electricity consumption remains below its 2008 peak.
Figure ON.2 - Electric Capacity
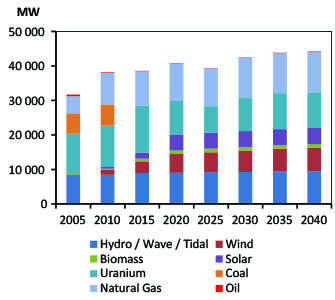
Notes: Refurbishments at Bruce and Darlington nuclear generation stations are scheduled to commence in the coming years, while all six operating units at the Pickering station are scheduled for retirement by 2020. Ontario plans to address electricity needs in this period with natural gas, renewables, imports, and conservation strategies.
| Ontario | 2014 | 2020 | 2025 | 2030 | 2035 | 2040 | AAGR |
|---|---|---|---|---|---|---|---|
| 2014-2040 | |||||||
| Drivers | |||||||
| Real GDP (millions of 2007 dollars) | 647131.0 | 724400.0 | 777799.0 | 857478.0 | 937516.0 | 1011099.0 | 1.7% |
| Population (thousands) | 13678.7 | 14542.4 | 15193.5 | 15863.9 | 16473.6 | 16943.1 | 0.8% |
| GDP per person (2007 dollars) | 47309 | 49813 | 51193 | 54052 | 56910 | 59676 | 0.9% |
| Energy Demand | |||||||
| End-use Energy Demand (PJ) | 3044.5 | 3223.4 | 3239.4 | 3297.8 | 3351.5 | 3380.1 | 0.4% |
| By Sector | |||||||
| Residential Sector | 546.0 | 580.8 | 596.3 | 606.8 | 613.3 | 616.5 | 0.5% |
| Commercial Sector | 507.2 | 548.7 | 576.1 | 608.8 | 646.5 | 671.7 | 1.1% |
| Industrial Sector | 1106.8 | 1195.3 | 1208.7 | 1232.7 | 1245.0 | 1255.4 | 0.5% |
| Transportation Sector | 884.5 | 898.6 | 858.3 | 849.5 | 846.8 | 836.5 | -0.2% |
| By Energy Source | |||||||
| Electricity | 502.3 | 516.2 | 522.3 | 538.7 | 559.1 | 577.4 | 0.5% |
| Natural Gas | 886.2 | 1003.9 | 1067.4 | 1126.1 | 1176.4 | 1213.7 | 1.2% |
| RPP and NGLs | 1403.9 | 1464.2 | 1420.4 | 1412.4 | 1405.2 | 1387.9 | 0.0% |
| Other | 252.1 | 239.0 | 229.3 | 220.7 | 210.9 | 201.1 | -0.9% |
| Primary Energy Demand (PJ) | 4098.2 | 3986.4 | 4036.3 | 4160.5 | 4240.2 | 4314.3 | 0.2% |
| Oil and Natural Gas Liquids | |||||||
| Crude Oil Production (MMb/d) | 1.2 | 0.8 | 0.5 | 0.3 | 0.2 | 0.0 | -15.5% |
| Conventional - Light | 1.2 | 0.8 | 0.5 | 0.3 | 0.2 | 0.0 | -15.5% |
| Conventional - Heavy | - | - | - | - | - | - | - |
| Pentane Plus and field condensate | - | - | - | - | - | - | - |
| Mined Bitumen | - | - | - | - | - | - | - |
| In Situ Bitumen | - | - | - | - | - | - | - |
| (Upgraded Bitumen) | - | - | - | - | - | - | - |
| NGL Production (MMb/d) | - | - | - | - | - | - | - |
| Ethane | - | - | - | - | - | - | - |
| Propane | - | - | - | - | - | - | - |
| Butane | - | - | - | - | - | - | - |
| Pentane Plus and field condensate | - | - | - | - | - | - | - |
| Natural Gas | |||||||
| Natural Gas Production (Bcf/d) | 0.01 | 0.01 | 0.01 | 0.00 | 0.00 | 0.00 | -6.0% |
| Solution | - | - | - | - | - | - | - |
| Non Associated | - | - | - | - | - | - | - |
| Tight | - | - | - | - | - | - | - |
| Shale | - | - | - | - | - | - | - |
| Coalbed Methane | - | - | - | - | - | - | - |
| Electricity | |||||||
| Generation (GW.h) | 167171 | 160218 | 161565 | 170977 | 175387 | 181219 | 0.3% |
| Capacity (MW) | 37449 | 40867 | 39357 | 42507 | 43887 | 44207 | 0.6% |
| Hydro/Wave/Tidal | 8562 | 9058 | 9178 | 9258 | 9398 | 9498 | 0.4% |
| Wind | 2756 | 5413 | 5813 | 6213 | 6613 | 6833 | 3.6% |
| Biomass/Geothermal | 620 | 1062 | 1062 | 1062 | 1062 | 1062 | 2.1% |
| Solar | 1441 | 4601 | 4601 | 4601 | 4601 | 4601 | 4.6% |
| Uranium | 13640 | 9720 | 7690 | 9560 | 10400 | 10400 | -1.0% |
| Coal & Coke | 306 | 0 | 0 | 0 | 0 | 0 | -100% |
| Natural Gas | 9993 | 10882 | 10882 | 11682 | 11682 | 11682 | 0.6% |
| Oil | 131 | 131 | 131 | 131 | 131 | 131 | 0.0% |
| Key Indicators | |||||||
| Canada GDP (Billions of $2007) | 1748.7 | 1947.5 | 2104.4 | 2302.3 | 2504.6 | 2679.9 | 1.7% |
| Exchange Rate ($US per C$) | 0.90 | 0.81 | 0.80 | 0.80 | 0.82 | 0.82 | -0.4% |
| Crude Oil Price (Brent) | 99.02 | 81.62 | 90.26 | 97.99 | 102.40 | 107.04 | 0.3% |
| Natural gas Price (Henry Hub) | 4.39 | 3.85 | 4.10 | 4.25 | 4.40 | 4.55 | 0.1% |
| For full data sets, including High Price, Low Price, Constrained, High LNG, and No LNG Cases, See the EF 2016 Data Appendices | |||||||
QC
Quebec
Key Findings
Results refer to the Reference Case unless otherwise noted.
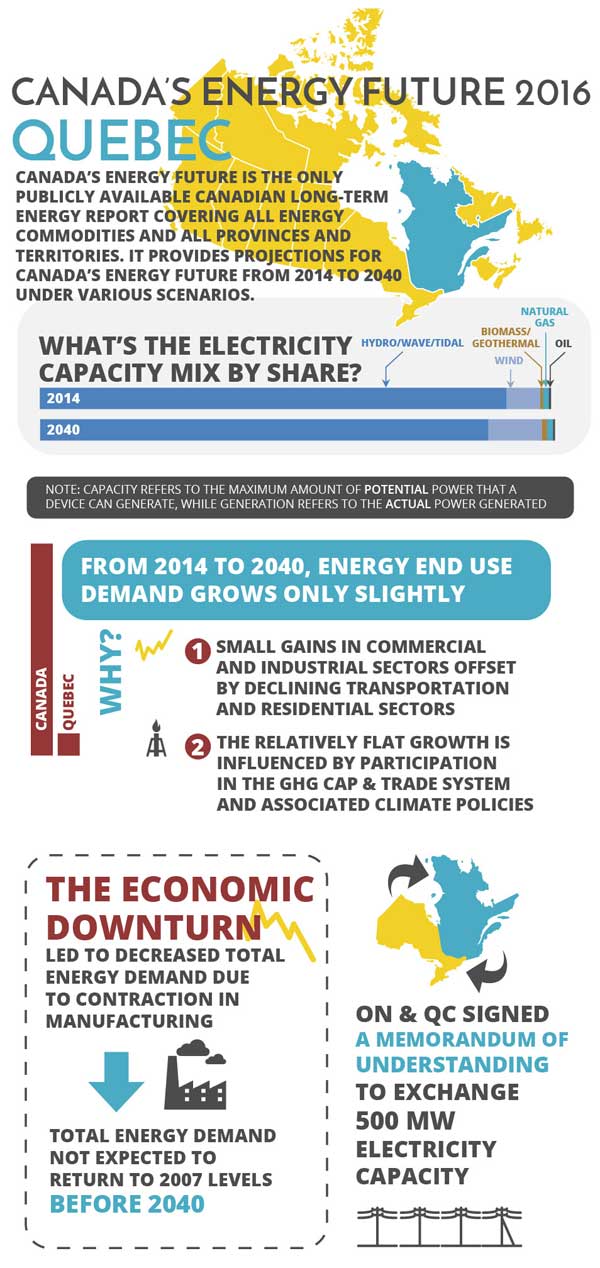
- By 2040 Quebec is projected to add over 6 000 MW of new wind and hydro capacity. Close to 3 000 MW of new hydro capacity is expected to be added over the projection period. Major additions include: Petit Mécatina 1-4 (2028-2031) and Romaine 1-4 (2016-2021). By 2040, the capacity of wind, solar, and biomass is estimated to reach 5 571 MW. Wind contributes the biggest share of renewable growth, with close to 3 000 MW of new additions. Quebec’s electricity exports are expected to remain strong during the projection period. Recently Ontario and Quebec signed a Memorandum of Understanding to exchange electricity capacity.
- Energy use in Quebec is flat in the Reference Case. End-use demand grows only slightly, rising from 1 803 PJ in 2014 to 1 847 PJ in 2040. This limited growth is the result of declines in the transportation and residential sectors and offsets most of the small gains in the commercial and industrial sectors. This relatively flat growth is influenced by Quebec’s participation in a GHG cap-and-trade system with California, and associated climate policies. Electricity accounts for the majority of the province’s demand growth over the projection period, growing 112 PJ to 786 PJ by 2040.
- Demand remains below the 2007 peak throughout the projection period. Quebec’s end-use demand declined rapidly from its 2007 peak of 1 954 PJ as its manufacturing sector faced significant contraction due to the 2008 economic downturn. End-use demand grows 44 PJ to reach 1 847 PJ in 2040, but remains below the 2007 peak for the entire projection period. Lower energy prices drive demand slightly higher to 1 890 PJ in 2040 in the Low Price Case and higher energy prices drive demand lower to 1 816 PJ by 2040 in the High Price Case.
Figure QC.1 - End-use Demand by Sector
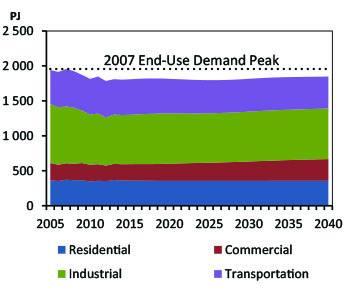
Notes: Quebec’s end-use demand is fairly flat throughout the projection, reaching 1 847 PJ in 2040, well below the pre-recessionary peak of 1 954 PJ in 2007 and only 2.4 per cent over 2014 levels.
Figure QC.2 - Electric Capacity Additions
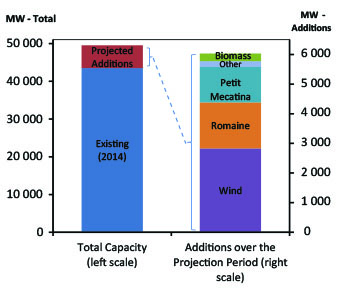
Notes: The majority of Quebec’s generating capacity is hydroelectricity which accounts for 91 per cent (2014) of the province’s total installed capacity. Quebec comprises over 50 per cent of Canada’s hydro generation (2014). By comparison, Manitoba, Ontario and B.C. together contribute 37 per cent.
| Quebec | 2014 | 2020 | 2025 | 2030 | 2035 | 2040 | AAGR |
|---|---|---|---|---|---|---|---|
| 2014-2040 | |||||||
| Drivers | |||||||
| Real GDP (millions of 2007 dollars) | 336017.0 | 375732.0 | 401657.0 | 440067.0 | 478115.0 | 508309.0 | 1.6% |
| Population (thousands) | 8214.7 | 8600.5 | 8918.9 | 9191.8 | 9422.1 | 9596.8 | 0.6% |
| GDP per person (2007 dollars) | 40904 | 43687 | 45034 | 47876 | 50744 | 52967 | 1.0% |
| Energy Demand | |||||||
| End-use Energy Demand (PJ) | 1802.8 | 1813.7 | 1795.4 | 1814.4 | 1839.0 | 1847.0 | 0.1% |
| By Sector | |||||||
| Residential Sector | 359.3 | 354.8 | 354.9 | 355.1 | 355.5 | 355.9 | 0.0% |
| Commercial Sector | 232.9 | 246.1 | 259.4 | 276.4 | 296.5 | 310.0 | 1.1% |
| Industrial Sector | 704.7 | 719.3 | 707.0 | 713.4 | 720.5 | 725.1 | 0.1% |
| Transportation Sector | 506.0 | 493.5 | 474.1 | 469.4 | 466.5 | 456.0 | -0.4% |
| By Energy Source | |||||||
| Electricity | 673.7 | 691.9 | 707.5 | 732.9 | 761.1 | 785.6 | 0.6% |
| Natural Gas | 234.5 | 250.9 | 254.8 | 263.9 | 273.7 | 280.4 | 0.7% |
| RPP and NGLs | 710.3 | 699.1 | 670.4 | 661.0 | 653.3 | 635.8 | -0.4% |
| Other | 184.3 | 171.8 | 162.7 | 156.6 | 150.8 | 145.1 | -0.9% |
| Primary Energy Demand (PJ) | 1851.6 | 1891.3 | 1876.3 | 1875.7 | 1906.8 | 1915.7 | 0.1% |
| Oil and Natural Gas Liquids | |||||||
| Crude Oil Production (MMb/d) | - | - | - | - | - | - | - |
| Conventional - Light | - | - | - | - | - | - | - |
| Conventional - Heavy | - | - | - | - | - | - | - |
| Pentane Plus and field condensate | - | - | - | - | - | - | - |
| Mined Bitumen | - | - | - | - | - | - | - |
| In Situ Bitumen | - | - | - | - | - | - | - |
| (Upgraded Bitumen) | - | - | - | - | - | - | - |
| NGL Production (MMb/d) | - | - | - | - | - | - | - |
| Ethane | - | - | - | - | - | - | - |
| Propane | - | - | - | - | - | - | - |
| Butane | - | - | - | - | - | - | - |
| Pentane Plus and field condensate | - | - | - | - | - | - | - |
| Natural Gas | |||||||
| Natural Gas Production (Bcf/d) | - | - | - | - | - | - | - |
| Solution | - | - | - | - | - | - | - |
| Non Associated | - | - | - | - | - | - | - |
| Tight | - | - | - | - | - | - | - |
| Shale | - | - | - | - | - | - | - |
| Coalbed Methane | - | - | - | - | - | - | - |
| Electricity | |||||||
| Generation (GW.h) | 194348 | 206480 | 211522 | 212828 | 222037 | 228909 | 0.6% |
| Capacity (MW) | 43496 | 46748 | 47123 | 47883 | 48456 | 48456 | 0.4% |
| Hydro/Wave/Tidal | 39411 | 40716 | 40961 | 41561 | 42161 | 42161 | 0.3% |
| Wind | 2862 | 4844 | 4944 | 5044 | 5044 | 5044 | 2.2% |
| Biomass/Geothermal | 270 | 397 | 427 | 487 | 527 | 527 | 2.6% |
| Solar | - | - | - | - | - | - | - |
| Uranium | - | - | - | - | - | - | - |
| Coal & Coke | - | - | - | - | - | - | - |
| Natural Gas | 538 | 538 | 538 | 538 | 538 | 538 | 0.0% |
| Oil | 415 | 253 | 253 | 253 | 186 | 186 | -3.0% |
| Key Indicators | |||||||
| Canada GDP (Billions of $2007) | 1748.7 | 1947.5 | 2104.4 | 2302.3 | 2504.6 | 2679.9 | 1.7% |
| Exchange Rate ($US per C$) | 0.90 | 0.81 | 0.80 | 0.80 | 0.82 | 0.82 | -0.4% |
| Crude Oil Price (Brent) | 99.02 | 81.62 | 90.26 | 97.99 | 102.40 | 107.04 | 0.3% |
| Natural gas Price (Henry Hub) | 4.39 | 3.85 | 4.10 | 4.25 | 4.40 | 4.55 | 0.1% |
| For full data sets, including High Price, Low Price, Constrained, High LNG, and No LNG Cases, See the EF 2016 Data Appendices | |||||||
NB
New Brunswick
Key Findings
Results refer to the Reference Case unless otherwise noted.
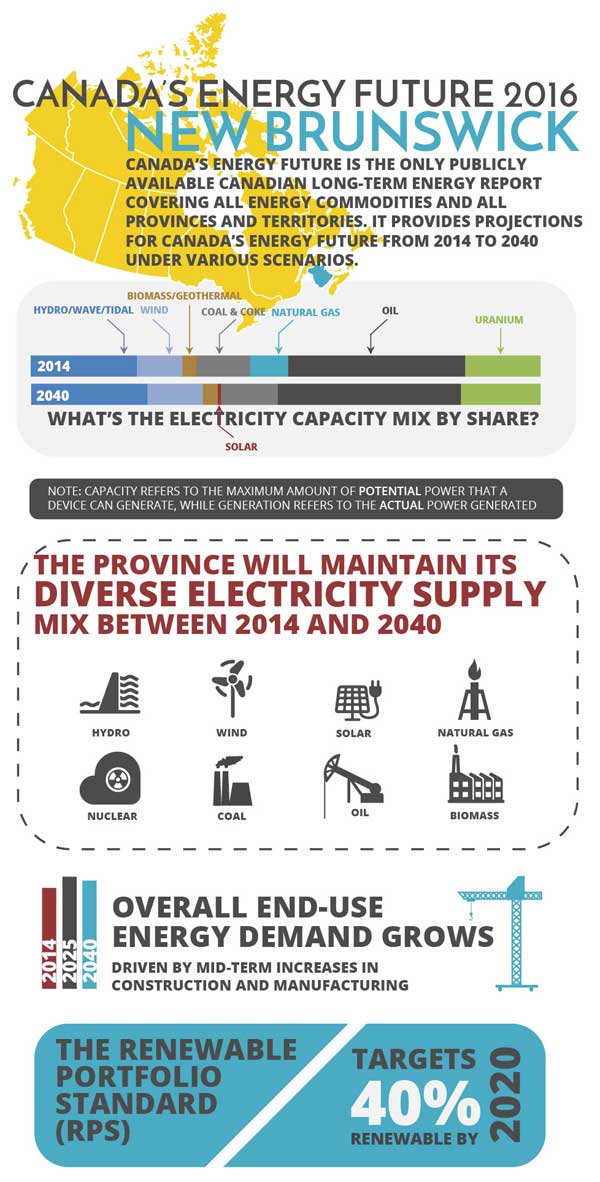
- New Brunswick to maintain diverse electricity supply mix. New Brunswick’s electricity supply comes from a diverse mix of fuels and this is expected to continue over the projection period. New Brunswick has a renewable portfolio standard (RPS) that targets 40 per cent renewable supply by 2020. This RPS covers electricity generated or imported from renewable sources. Over the projection period, close to 130 MW of new capacity is expected to come online from wind and solar. In accordance with New Brunswick’s integrated resource plan, the Belledune coal-fired generation station is expected to remain operational through the projection period.
- End-use demand grows overall, declines after 2025.Medium-term increases in construction and manufacturing cause end-use demand to increase above its 2014 level of 239 PJ and peak at 263 PJ in 2025. Demand declines to 254 PJ by 2040 driven largely by flat growth in these industries and declining demand for passenger transportation. The High and Low Price Cases affect the projections as expected, with the lower energy prices in the Low Price Case increasing the end-use demand to 270 PJ in 2040 and the higher prices of the High Price Case reducing 2040 demand to 243 PJ.
- Natural gas demand rises and then falls given decreasing use in electric generation, and increasing use in industrial and commercial sectors.Demand for natural gas rises in the medium term and then declines as natural gas combined cycle units are retired in the mid-2020s, as suggested in the province’s recent integrated resource plan. Along with declining residential demand, these retirements offset gains in commercial and industrial gas demand so that demand only grows from 32 PJ in 2014 to just over 33 PJ in 2040.
Figure NB.1 - Natural Gas Demand by Sector
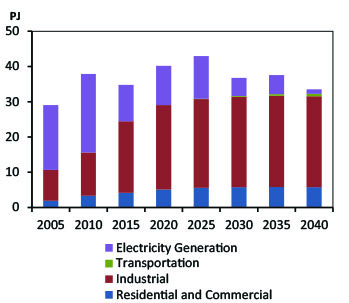
Notes: Natural gas demand increases in the medium term, increasingly used in industrial applications and for residential and commercial heating. In the long term, natural gas demand decreases as natural gas-fired electricity generation units are decommissioned.
Figure NB.2 - Electric Capacity Mix
Notes: Nuclear and hydro supply over 60 per cent of New Brunswick’s current generation and this is expected to remain stable over the projection period.
| New Brunswick | 2014 | 2020 | 2025 | 2030 | 2035 | 2040 | AAGR |
|---|---|---|---|---|---|---|---|
| 2014-2040 | |||||||
| Drivers | |||||||
| Real GDP (millions of 2007 dollars) | 28261.0 | 31615.0 | 33437.0 | 34865.0 | 36598.0 | 37876.0 | 1.1% |
| Population (thousands) | 753.9 | 766.8 | 784.3 | 796.7 | 804.3 | 804.4 | 0.2% |
| GDP per person (2007 dollars) | 37486 | 41230 | 42633 | 43762 | 45503 | 47086 | 0.9% |
| Energy Demand | |||||||
| End-use Energy Demand (PJ) | 239.1 | 259.9 | 262.9 | 259.2 | 257.6 | 253.7 | 0.2% |
| By Sector | |||||||
| Residential Sector | 32.4 | 33.3 | 34.2 | 35.0 | 35.6 | 36.1 | 0.4% |
| Commercial Sector | 18.2 | 21.1 | 22.4 | 23.1 | 23.5 | 23.4 | 1.0% |
| Industrial Sector | 133.1 | 148.7 | 150.8 | 147.6 | 146.2 | 143.8 | 0.3% |
| Transportation Sector | 55.4 | 56.8 | 55.5 | 53.6 | 52.2 | 50.4 | -0.4% |
| By Energy Source | |||||||
| Electricity | 44.8 | 48.4 | 50.2 | 51.6 | 52.9 | 53.7 | 0.7% |
| Natural Gas | 23.3 | 29.1 | 30.9 | 31.7 | 32.1 | 32.3 | 1.3% |
| RPP and NGLs | 155.3 | 163.6 | 162.0 | 156.0 | 153.0 | 148.9 | -0.2% |
| Other | 15.7 | 18.9 | 19.9 | 19.9 | 19.5 | 18.8 | 0.7% |
| Primary Energy Demand (PJ) | 294.4 | 325.2 | 330.7 | 350.9 | 350.3 | 343.2 | 0.6% |
| Oil and Natural Gas Liquids | |||||||
| Crude Oil Production (MMb/d) | - | - | - | - | - | - | - |
| Conventional - Light | - | - | - | - | - | - | - |
| Conventional - Heavy | - | - | - | - | - | - | - |
| Pentane Plus and field condensate | - | - | - | - | - | - | - |
| Mined Bitumen | - | - | - | - | - | - | - |
| In Situ Bitumen | - | - | - | - | - | - | - |
| (Upgraded Bitumen) | - | - | - | - | - | - | - |
| NGL Production (MMb/d) | - | - | - | - | - | - | - |
| Ethane | - | - | - | - | - | - | - |
| Propane | - | - | - | - | - | - | - |
| Butane | - | - | - | - | - | - | - |
| Pentane Plus and field condensate | - | - | - | - | - | - | - |
| Natural Gas | |||||||
| Natural Gas Production (Bcf/d) | 0.01 | 0.00 | 0.00 | 0.00 | 0.00 | 0.00 | -100% |
| Solution | - | - | - | - | - | - | - |
| Non Associated | - | - | - | - | - | - | - |
| Tight | - | - | - | - | - | - | - |
| Shale | - | - | - | - | - | - | - |
| Coalbed Methane | - | - | - | - | - | - | - |
| Electricity | |||||||
| Generation (GW.h) | 9970 | 11403 | 11881 | 14140 | 14362 | 14109 | 1.3% |
| Capacity (MW) | 4596 | 4666 | 4696 | 4542 | 4542 | 4352 | -0.2% |
| Hydro/Wave/Tidal | 957 | 992 | 992 | 992 | 992 | 992 | 0.1% |
| Wind | 409 | 444 | 444 | 474 | 474 | 474 | 0.6% |
| Biomass/Geothermal | 127 | 127 | 127 | 127 | 127 | 127 | 0.0% |
| Solar | 0 | 0 | 30 | 30 | 30 | 30 | - |
| Uranium | 680 | 680 | 680 | 680 | 680 | 680 | 0.0% |
| Coal & Coke | 485 | 485 | 485 | 485 | 485 | 485 | 0.0% |
| Natural Gas | 345 | 345 | 345 | 190 | 190 | 0 | -100% |
| Oil | 1593 | 1593 | 1593 | 1564 | 1564 | 1564 | -0.1% |
| Key Indicators | |||||||
| Canada GDP (Billions of $2007) | 1748.7 | 1947.5 | 2104.4 | 2302.3 | 2504.6 | 2679.9 | 1.7% |
| Exchange Rate ($US per C$) | 0.90 | 0.81 | 0.80 | 0.80 | 0.82 | 0.82 | -0.4% |
| Crude Oil Price (Brent) | 99.02 | 81.62 | 90.26 | 97.99 | 102.40 | 107.04 | 0.3% |
| Natural gas Price (Henry Hub) | 4.39 | 3.85 | 4.10 | 4.25 | 4.40 | 4.55 | 0.1% |
| For full data sets, including High Price, Low Price, Constrained, High LNG, and No LNG Cases, See the EF 2016 Data Appendices | |||||||
NS
Nova Scotia
Key Findings
Results refer to the Reference Case unless otherwise noted.
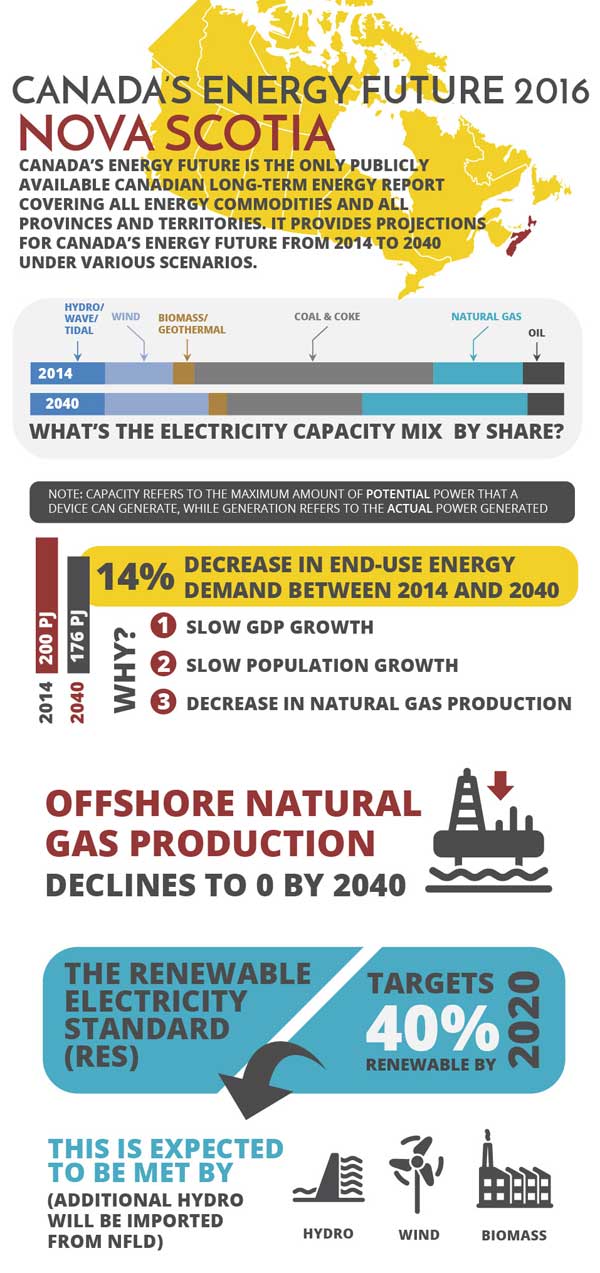
- Over the projection period, Nova Scotia’s renewable share is expected to rise.Nova Scotia has a legislated Renewable Electricity Standard (RES) that requires 40 per cent of the province’s electricity to come from renewable energy by 2020. EF 2016 projects that this RES will be met by wind, biomass and hydro generation, with additional renewable energy coming from Muskrat Falls in Labrador. Twenty per cent of the energy generated by Muskrat Falls will be reserved for Nova Scotia, and additional amounts will likely be available for transfers to Nova Scotia. In 2014, the federal government and Nova Scotia signed an equivalency agreement where the provincial legislation regarding limits on GHG emissions, determined in tonnes of CO2, is considered equivalent to the corresponding provisions in the Canadian Environmental Protection Act and the Reduction Regulations, provided certain emissions limits are met.
- Nova Scotia offshore natural gas production decreases over the projection period. Deep Panuke production declines steadily from an annual rate of 199 MMcf/d in 2014; production now only occurs in the winter months. Production from the Sable Offshore Energy Project continues to decline as well, falling from an annual rate of 123 MMcf/d in 2014. Both of these projects are likely to be shut in well before 2040 but timing is uncertain. Exploration of the East Coast offshore continues and future discoveries and developments in these areas represent a key uncertainty to the energy supply, and energy demand projections for Nova Scotia.
- End-use demand declines over the projection period due to industrial declines and the GDP and population growth projections. End-use demand declines from 200 PJ in 2014 to 176 PJ in 2040. This is mainly attributable to the energy decrease associated with declining natural gas production. Slow GDP growth, declining population growth, and improving energy efficiency all contribute to reduced demand in the residential, commercial and transportation sectors. Increasing manufacturing demand, led by growth in ship building, offsets some of these declines.
Figure NS.1 - End-Use Demand by Sector
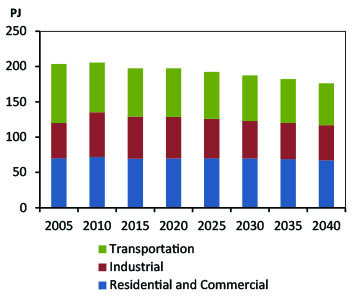
Notes: Nova Scotia’s end-use demand declines at an annual average rate of 0.5 per cent over the forecast. This is driven by declining natural gas production and slow growth in macroeconomic drivers.
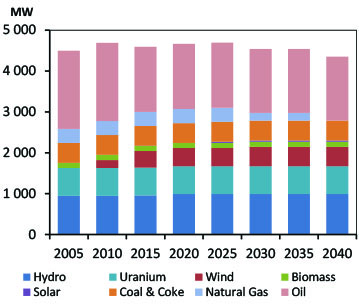
Figure NS.2 - Electric Capacity Mix
Notes: In 2014 over 60 per cent of Nova Scotia’s generation came from coal- fired plants. In the projection period Nova Scotia is expected to use more electricity from renewable energy, including hydroelectric imports from Newfoundland and Labrador. This chart shows the firm capacity guaranteed to Nova Scotia associated with Muskrat Falls. The province also has the option to purchase additional power at market rates.
| Nova Scotia | 2014 | 2020 | 2025 | 2030 | 2035 | 2040 | AAGR |
|---|---|---|---|---|---|---|---|
| 2014-2040 | |||||||
| Drivers | |||||||
| Real GDP (millions of 2007 dollars) | 36610.0 | 39458.0 | 41272.0 | 43146.0 | 44753.0 | 45677.0 | 0.9% |
| Population (thousands) | 942.7 | 939.2 | 933.4 | 921.6 | 901.7 | 872.9 | -0.3% |
| GDP per person (2007 dollars) | 38835 | 42012 | 44217 | 46816 | 49632 | 52328 | 1.2% |
| Energy Demand | |||||||
| End-use Energy Demand (PJ) | 200.2 | 197.4 | 192.5 | 187.3 | 182.2 | 176.1 | -0.5% |
| By Sector | |||||||
| Residential Sector | 45.1 | 44.5 | 43.7 | 42.6 | 41.3 | 39.8 | -0.5% |
| Commercial Sector | 23.9 | 25.3 | 26.5 | 27.3 | 27.7 | 27.5 | 0.5% |
| Industrial Sector | 63.7 | 58.9 | 55.8 | 52.9 | 50.9 | 49.5 | -1.0% |
| Transportation Sector | 67.4 | 68.7 | 66.5 | 64.5 | 62.4 | 59.3 | -0.5% |
| By Energy Source | |||||||
| Electricity | 41.8 | 41.6 | 41.9 | 42.0 | 42.0 | 41.7 | 0.0% |
| Natural Gas | 20.4 | 15.5 | 13.7 | 11.9 | 10.8 | 10.1 | -2.7% |
| RPP and NGLs | 122.0 | 124.1 | 120.9 | 118.0 | 114.9 | 110.6 | -0.4% |
| Other | 16.0 | 16.2 | 16.0 | 15.4 | 14.6 | 13.7 | -0.6% |
| Primary Energy Demand (PJ) | 284.1 | 251.9 | 248.1 | 246.6 | 234.3 | 226.8 | -0.9% |
| Oil and Natural Gas Liquids | |||||||
| Crude Oil Production (MMb/d) | 2.9 | 2.0 | 1.5 | 1.1 | 0.9 | 0.6 | -5.6% |
| Conventional - Light | - | - | - | - | - | - | - |
| Conventional - Heavy | - | - | - | - | - | - | - |
| Pentane Plus and field condensate | 2.9 | 2.0 | 1.5 | 1.1 | 0.9 | 0.6 | -5.6% |
| Mined Bitumen | - | - | - | - | - | - | - |
| In Situ Bitumen | - | - | - | - | - | - | - |
| (Upgraded Bitumen) | - | - | - | - | - | - | - |
| NGL Production (MMb/d) | 5.7 | 4.0 | 3.0 | 2.3 | 1.7 | 1.3 | -5.6% |
| Ethane | 0.0 | 0.0 | 0.0 | 0.0 | 0.0 | 0.0 | - |
| Propane | 1.6 | 1.1 | 0.9 | 0.6 | 0.5 | 0.4 | -5.6% |
| Butane | 1.2 | 0.8 | 0.6 | 0.5 | 0.4 | 0.3 | -5.6% |
| Pentane Plus and field condensate | 2.9 | 2.0 | 1.5 | 1.1 | 0.9 | 0.6 | -5.6% |
| Natural Gas | |||||||
| Natural Gas Production (Bcf/d) | 0.3 | 0.2 | 0.1 | 0.1 | 0.1 | 0.0 | -8.1% |
| Solution | - | - | - | - | - | - | - |
| Non Associated | - | - | - | - | - | - | - |
| Tight | - | - | - | - | - | - | - |
| Shale | - | - | - | - | - | - | - |
| Coalbed Methane | - | - | - | - | - | - | - |
| Electricity | |||||||
| Generation (GW.h) | 12408 | 10000 | 10351 | 11398 | 11621 | 11739 | -0.2% |
| Capacity (MW) | 2871 | 2931 | 2876 | 3301 | 3321 | 3241 | 0.5% |
| Hydro/Wave/Tidal | 401 | 451 | 451 | 451 | 451 | 451 | 0.5% |
| Wind | 365 | 530 | 555 | 580 | 605 | 630 | 2.1% |
| Biomass/Geothermal | 113 | 113 | 113 | 113 | 113 | 113 | 0.0% |
| Solar | - | - | - | - | - | - | - |
| Uranium | - | - | - | - | - | - | - |
| Coal & Coke | 1288 | 1133 | 1133 | 1133 | 977 | 822 | -1.7% |
| Natural Gas | 482 | 482 | 402 | 802 | 953 | 1003 | 2.9% |
| Oil | 222 | 222 | 222 | 222 | 222 | 222 | 0.0% |
| Key Indicators | |||||||
| Canada GDP (Billions of $2007) | 1748.7 | 1947.5 | 2104.4 | 2302.3 | 2504.6 | 2679.9 | 1.7% |
| Exchange Rate ($US per C$) | 0.90 | 0.81 | 0.80 | 0.80 | 0.82 | 0.82 | -0.4% |
| Crude Oil Price (Brent) | 99.02 | 81.62 | 90.26 | 97.99 | 102.40 | 107.04 | 0.3% |
| Natural gas Price (Henry Hub) | 4.39 | 3.85 | 4.10 | 4.25 | 4.40 | 4.55 | 0.1% |
| For full data sets, including High Price, Low Price, Constrained, High LNG, and No LNG Cases, See the EF 2016 Data Appendices | |||||||
PE
Prince Edward Island
Key Findings
Results refer to the Reference Case unless otherwise noted.
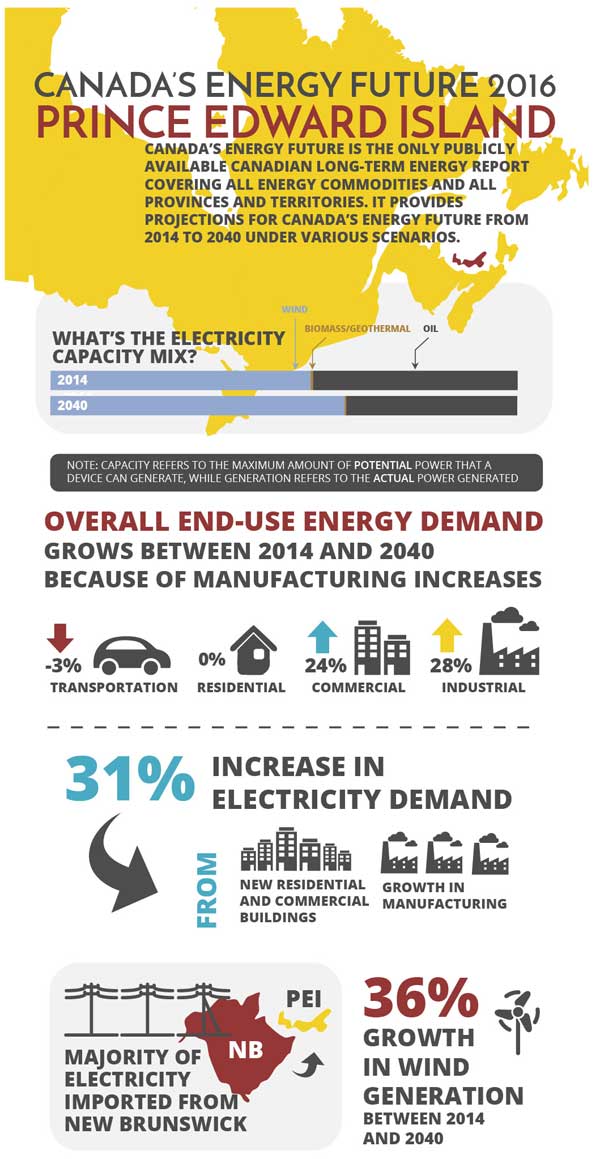
- End-use demand increases over the forecast due to manufacturing increases. PEI end-use demand increases from 26 PJ in 2014 to just under 29 PJ in 2040. This is the result of increases in the residential, commercial and industrial sectors offsetting a small decline in the transportation sector. Higher energy prices in the High Price Case reduce end-use demand growth to 27 PJ in 2040. Lower energy prices in the Low Price Case lead to higher end-use demand of just over 29 PJ by 2040.
- Electricity demand steadily increases, driven by use in buildings and the manufacturing sector. Electricity demand increases 0.6 TW.h over the forecast to 2.4 TW.h in 204 and 57 per cent of this increase is driven by the manufacturing sector. New residential and commercial buildings contribute to 40 per cent of the increase.
- Wind generation continues to grow over the projection period. Since 2005, wind generation capacity in PEI has increased rapidly. In 2014, wind capacity was 197 MW. By 2040 wind capacity is projected to rise to 267 MW, generating 855 GW.h. This is equivalent to 36 per cent of PEI’s 2040 electricity demand. PEI relies on imports from New Brunswick for the majority of its electricity demand, and the reliance on these imports continues over the projection period.
Figure PEI.1 - Electricity Demand
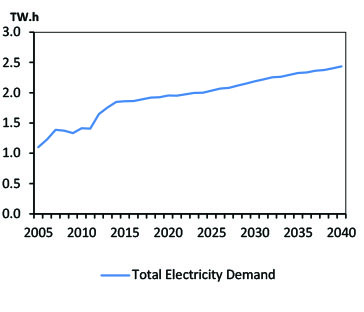
Notes: Electricity demand in PEI increases steadily over the projection, growing at an average annual rate of 1.1 per cent to reach 2.4 TW.h, an increase of 32 per cent over 2014 levels. This is driven by the manufacturing sector demand increasing by an average of 2.2 per cent per year, and the modest growth in usage by residential and commercial buildings, which grow at an annual average of 0.9 per cent.
Figure PEI.2 - Wind Capacity
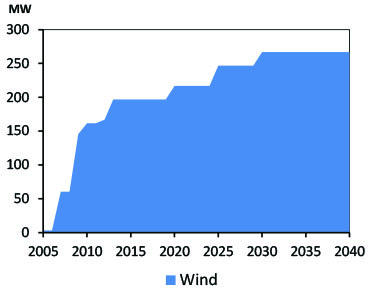
Notes: Over the projection period, PEI wind capacity increases by approximately 50 MW, and wind generation increases to 855 GW.h by 2040.
| Prince Edward Island | 2014 | 2020 | 2025 | 2030 | 2035 | 2040 | AAGR |
|---|---|---|---|---|---|---|---|
| 2014-2040 | |||||||
| Drivers | |||||||
| Real GDP (millions of 2007 dollars) | 5070.0 | 5612.0 | 5971.0 | 6497.0 | 6852.0 | 7173.0 | 1.3% |
| Population (thousands) | 146.3 | 153.5 | 160.0 | 165.9 | 167.2 | 166.0 | 0.5% |
| GDP per person (2007 dollars) | 34655 | 36560 | 37319 | 39162 | 40981 | 43211 | 0.9% |
| Energy Demand | |||||||
| End-use Energy Demand (PJ) | 26.4 | 28.0 | 28.0 | 28.4 | 28.5 | 28.5 | 0.3% |
| By Sector | |||||||
| Residential Sector | 6.4 | 6.5 | 6.6 | 6.5 | 6.5 | 6.4 | 0.0% |
| Commercial Sector | 4.1 | 4.3 | 4.5 | 4.8 | 5.0 | 5.1 | 0.8% |
| Industrial Sector | 5.3 | 5.7 | 5.8 | 6.2 | 6.5 | 6.8 | 1.0% |
| Transportation Sector | 10.5 | 11.4 | 11.2 | 10.9 | 10.5 | 10.2 | -0.1% |
| By Energy Source | |||||||
| Electricity | 6.7 | 7.0 | 7.3 | 7.9 | 8.4 | 8.8 | 1.1% |
| Natural Gas | 0.7 | 0.8 | 0.9 | 0.9 | 1.0 | 1.0 | 1.2% |
| RPP and NGLs | 17.3 | 18.4 | 18.1 | 17.9 | 17.5 | 17.2 | 0.0% |
| Other | 1.7 | 1.7 | 1.7 | 1.7 | 1.7 | 1.6 | -0.2% |
| Primary Energy Demand (PJ) | 22.1 | 22.8 | 23.0 | 23.3 | 23.1 | 22.9 | 0.1% |
| Oil and Natural Gas Liquids | |||||||
| Crude Oil Production (MMb/d) | - | - | - | - | - | - | - |
| Conventional - Light | - | - | - | - | - | - | - |
| Conventional - Heavy | - | - | - | - | - | - | - |
| Pentane Plus and field condensate | - | - | - | - | - | - | - |
| Mined Bitumen | - | - | - | - | - | - | - |
| In Situ Bitumen | - | - | - | - | - | - | - |
| (Upgraded Bitumen) | - | - | - | - | - | - | - |
| NGL Production (MMb/d) | - | - | - | - | - | - | - |
| Ethane | - | - | - | - | - | - | - |
| Propane | - | - | - | - | - | - | - |
| Butane | - | - | - | - | - | - | - |
| Pentane Plus and field condensate | - | - | - | - | - | - | - |
| Natural Gas | |||||||
| Natural Gas Production (Bcf/d) | - | - | - | - | - | - | - |
| Solution | - | - | - | - | - | - | - |
| Non Associated | - | - | - | - | - | - | - |
| Tight | - | - | - | - | - | - | - |
| Shale | - | - | - | - | - | - | - |
| Coalbed Methane | - | - | - | - | - | - | - |
| Electricity | |||||||
| Generation (GW.h) | 669 | 532 | 624 | 766 | 824 | 862 | 1.0% |
| Capacity (MW) | 354 | 374 | 404 | 424 | 424 | 424 | 0.7% |
| Hydro/Wave/Tidal | 0 | 0 | 0 | 0 | 0 | 0 | - |
| Wind | 197 | 217 | 247 | 267 | 267 | 267 | 1.2% |
| Biomass/Geothermal | 2 | 2 | 2 | 2 | 2 | 2 | 0.0% |
| Solar | - | - | - | - | - | - | - |
| Uranium | - | - | - | - | - | - | - |
| Coal & Coke | - | - | - | - | - | - | - |
| Natural Gas | - | - | - | - | - | - | - |
| Oil | 155 | 155 | 155 | 155 | 155 | 155 | 0.0% |
| Key Indicators | |||||||
| Canada GDP (Billions of $2007) | 1748.7 | 1947.5 | 2104.4 | 2302.3 | 2504.6 | 2679.9 | 1.7% |
| Exchange Rate ($US per C$) | 0.90 | 0.81 | 0.80 | 0.80 | 0.82 | 0.82 | -0.4% |
| Crude Oil Price (Brent) | 99.02 | 81.62 | 90.26 | 97.99 | 102.40 | 107.04 | 0.3% |
| Natural gas Price (Henry Hub) | 4.39 | 3.85 | 4.10 | 4.25 | 4.40 | 4.55 | 0.1% |
| For full data sets, including High Price, Low Price, Constrained, High LNG, and No LNG Cases, See the EF 2016 Data Appendices | |||||||
NL
Newfoundland and Labrador
Key Findings
Results refer to the Reference Case unless otherwise noted.
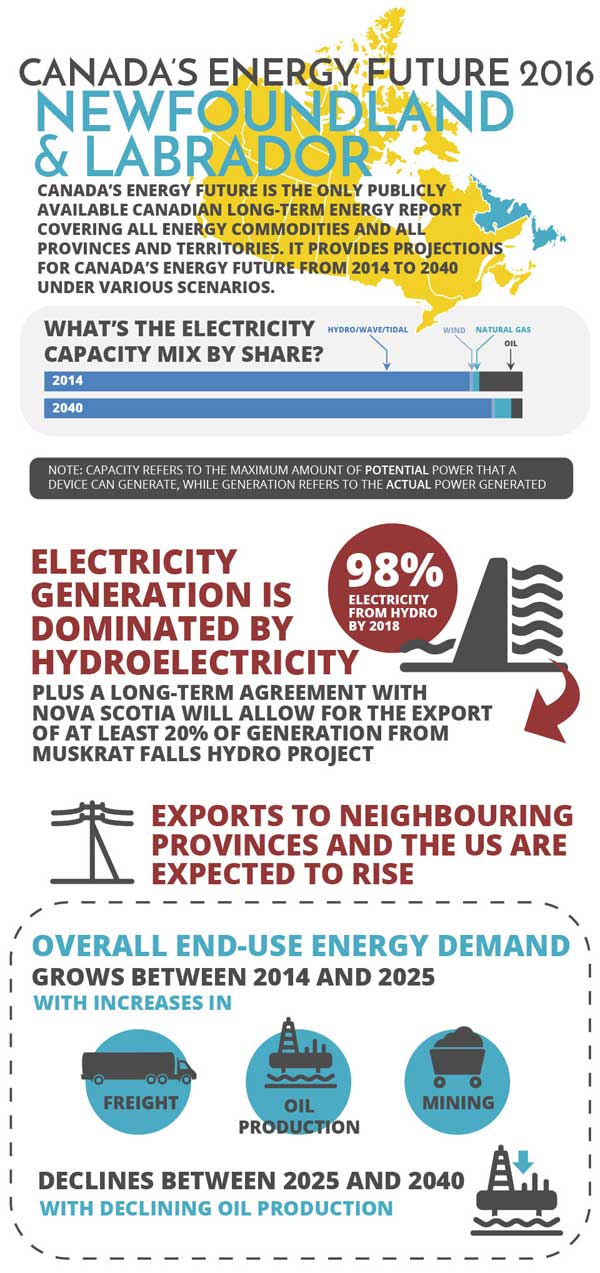
- Newfoundland and Labrador’s electricity generation will be even more dominated by hydroelectricity.
With the completion of Muskrat Falls in 2018, over 98 per cent of the province’s generation will come from hydroelectricity, and exports to neighboring provinces and the U.S. are expected to rise. A long-term export agreement with Nova Scotia will enable the export of at least 20 per cent of the generation from Muskrat Falls. - Offshore oil production increases in the medium term in all cases, though the timing of increased production varies by case.
Medium-term production in Newfoundland and Labrador will be supported by new fields coming online. This includes production from the Hibernia South and White Rose extensions, and the Hebron Field which begins production in 2017. All cases assume a discovery of a 500 MMb offshore field with varying production timing: 2025 in the Reference Case, 2023 in the High Price Case and 2031 in the Low Price Case. After the startup of this field, production declines to the end of the projection period in all cases. Exploration in the East Coast offshore continues, and future discoveries and developments in these areas represent a key uncertainty to the energy supply, and energy demand projections for Newfoundland and Labrador. - End-use demand rises in the medium term, declines thereafter.
In the Reference Case, end-use demand reaches a peak of 160 PJ in 2025, driven by increases in demand from freight, mining and oil production. Over the projection period, strong growth in mining energy demand is more than offset by the demand reductions associated with declining oil production. Freight demand is fairly flat between 2025 and 2040 due to reduced GDP growth.
Figure NL.1 - Oil production by Case
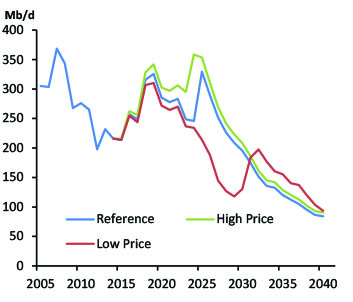
Notes: The High Price, Low Price, and Reference Cases all include the Hibernia South and White Rose extensions and the start-up of the Hebron project before 2020. These three Cases differ with respect to their timing of an additional offshore field discovery.
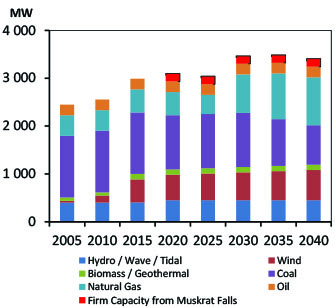
Figure NL.2 - Electric Capacity Additions
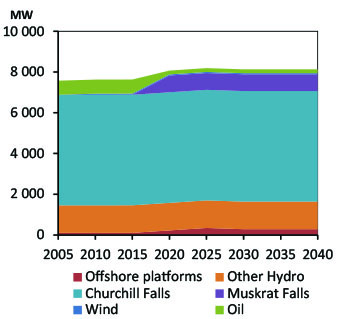
Notes: Churchill Falls, with a capacity of 5 428 MW, is the second largest hydroelectric plant in Canada. The majority of the generation from this plant is sold to Quebec under a long-term contract that is set to expire in 2041. After Muskrat Falls comes online, over 98 per cent of the province’s generation will come from hydroelectricity.
| Newfoundland and Labrador | 2014 | 2020 | 2025 | 2030 | 2035 | 2040 | AAGR |
|---|---|---|---|---|---|---|---|
| 2014-2040 | |||||||
| Drivers | |||||||
| Real GDP (millions of 2007 dollars) | 28740.0 | 30672.0 | 32684.0 | 31964.0 | 32320.0 | 33117.0 | 0.5% |
| Population (thousands) | 527.0 | 510.1 | 514.4 | 513.5 | 513.6 | 511.0 | -0.1% |
| GDP per person (2007 dollars) | 54535 | 60129 | 63538 | 62247 | 62928 | 64808 | 0.7% |
| Energy Demand | |||||||
| End-use Energy Demand (PJ) | 150.3 | 156.8 | 159.6 | 151.6 | 147.6 | 145.5 | -0.1% |
| By Sector | |||||||
| Residential Sector | 23.1 | 21.8 | 21.2 | 20.8 | 20.4 | 20.1 | -0.5% |
| Commercial Sector | 12.0 | 11.6 | 11.6 | 11.8 | 12.2 | 12.5 | 0.2% |
| Industrial Sector | 59.7 | 65.8 | 67.3 | 61.8 | 58.8 | 57.9 | -0.1% |
| Transportation Sector | 55.5 | 57.6 | 59.4 | 57.3 | 56.3 | 55.1 | 0.0% |
| By Energy Source | |||||||
| Electricity | 35.8 | 37.2 | 39.4 | 41.1 | 43.4 | 46.0 | 1.0% |
| Natural Gas | 17.9 | 19.8 | 19.3 | 12.3 | 7.7 | 5.1 | -4.7% |
| RPP and NGLs | 87.2 | 91.0 | 92.0 | 89.3 | 87.6 | 85.4 | -0.1% |
| Other | 9.4 | 8.8 | 8.9 | 8.9 | 8.9 | 9.0 | -0.2% |
| Primary Energy Demand (PJ) | 272.5 | 284.2 | 286.1 | 275.2 | 270.2 | 267.3 | -0.1% |
| Oil and Natural Gas Liquids | |||||||
| Crude Oil Production (MMb/d) | 216.1 | 285.3 | 329.3 | 195.4 | 120.0 | 84.3 | -3.6% |
| Conventional - Light | 216.1 | 285.3 | 329.3 | 195.4 | 120.0 | 84.3 | -3.6% |
| Conventional - Heavy | - | - | - | - | - | - | - |
| Pentane Plus and field condensate | - | - | - | - | - | - | - |
| Mined Bitumen | - | - | - | - | - | - | - |
| In Situ Bitumen | - | - | - | - | - | - | - |
| (Upgraded Bitumen) | - | - | - | - | - | - | - |
| NGL Production (MMb/d) | - | - | - | - | - | - | - |
| Ethane | - | - | - | - | - | - | - |
| Propane | - | - | - | - | - | - | - |
| Butane | - | - | - | - | - | - | - |
| Pentane Plus and field condensate | - | - | - | - | - | - | - |
| Natural Gas | |||||||
| Natural Gas Production (Bcf/d) | - | - | - | - | - | - | - |
| Solution | - | - | - | - | - | - | - |
| Non Associated | - | - | - | - | - | - | - |
| Tight | - | - | - | - | - | - | - |
| Shale | - | - | - | - | - | - | - |
| Coalbed Methane | - | - | - | - | - | - | - |
| Electricity | |||||||
| Generation (GW.h) | 41057 | 44761 | 44975 | 45004 | 45331 | 45815 | 0.4% |
| Capacity (MW) | 7631 | 8070 | 8190 | 8130 | 8130 | 8130 | 0.2% |
| Hydro/Wave/Tidal | 6783 | 7607 | 7607 | 7607 | 7607 | 7607 | 0.4% |
| Wind | 54 | 54 | 54 | 54 | 54 | 54 | 0.0% |
| Biomass/Geothermal | - | - | - | - | - | - | - |
| Solar | - | - | - | - | - | - | - |
| Uranium | - | - | - | - | - | - | - |
| Coal & Coke | - | - | - | - | - | - | - |
| Natural Gas | 103 | 223 | 343 | 283 | 283 | 283 | 4.0% |
| Oil | 691 | 186 | 186 | 186 | 186 | 186 | -4.9% |
| Key Indicators | |||||||
| Canada GDP (Billions of $2007) | 1748.7 | 1947.5 | 2104.4 | 2302.3 | 2504.6 | 2679.9 | 1.7% |
| Exchange Rate ($US per C$) | 0.90 | 0.81 | 0.80 | 0.80 | 0.82 | 0.82 | -0.4% |
| Crude Oil Price (Brent) | 99.02 | 81.62 | 90.26 | 97.99 | 102.40 | 107.04 | 0.3% |
| Natural gas Price (Henry Hub) | 4.39 | 3.85 | 4.10 | 4.25 | 4.40 | 4.55 | 0.1% |
| For full data sets, including High Price, Low Price, Constrained, High LNG, and No LNG Cases, See the EF 2016 Data Appendices | |||||||
YT
Yukon
Key Findings
Results refer to the Reference Case unless otherwise noted.
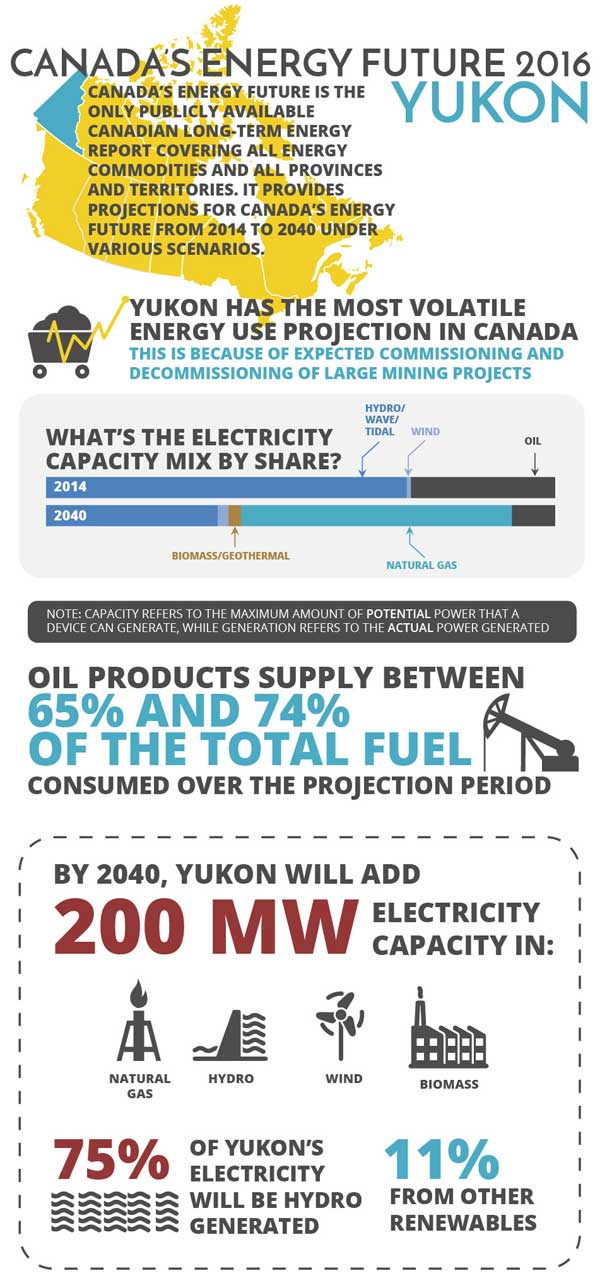
- Demand is volatile because of the mining sector. Yukon has the most volatile energy use projection out of any province or territory. End-use demand increases 53 per cent over 2014 levels in six years, peaking at 7.7 PJ in 2021 and decreasing thereafter to 5.9 PJ by 2040. This volatility is the result of the expected commissioning and decommissioning of several large mining projects. Despite the volatility, mining demand will grow at an average annual rate of 0.8 per cent over the projection period.
- The fuel mix remains the most diverse of the Territories. While oil products will supply around between 65 and 74 per cent of the territory’s fuel mix over the projection period, Yukon will add more renewables, hydroelectricity and natural gas to their mix than either of the other territories or Prince Edward Island.
- Yukon to add 200 MW of electricity capacity over the projection. In 2014, more than 93 per cent of Yukon’s power generation came from hydro while diesel made up the remainder. Over the projection period, Yukon is projected to add over 200 MW of new capacity. These additions reflect a diverse fuel mix including biomass, geothermal, hydro, wind and natural gas. By the end of the projection period, 75 per cent of Yukon’s electricity generation will be generated from hydro units and 11 per cent from other renewables.
Figure YK.1 - End-Use Demand
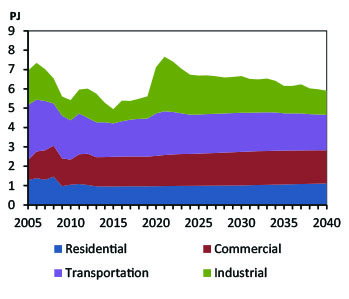
Notes: Yukon demand undergoes significant volatility both historically and over the projection period due to the commissioning and decommissioning of several mining projects. In the Reference Case, end-use demand peaks at 7.7 PJ in the early 2020s and falls to 5.9 PJ by 2040.
Figure YK.2 - Primary Fuel Shares
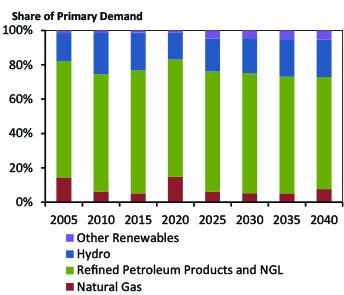
Notes: Gains in primary fuel shares are made by other renewables, which increase from one per cent in 2014 to five per cent in 2040. The natural gas share has dropped significantly since 2005 but due to its association with volatile mining activity, it grows to 16 per cent in 2021 and then declines to eight per cent by 2040. Refined petroleum product use retains a high share of the primary fuel mix in Yukon but falls from nearly 77 per cent in 2014 to 65 per cent in 2040. Hydro shares are stable at 22 per cent in 2040.
| Yukon | 2014 | 2020 | 2025 | 2030 | 2035 | 2040 | AAGR |
|---|---|---|---|---|---|---|---|
| 2014-2040 | |||||||
| Drivers | |||||||
| Real GDP (millions of 2007 dollars) | 2256.0 | 3128.0 | 3037.0 | 3166.0 | 3099.0 | 3094.0 | 1.2% |
| Population (thousands) | 36.5 | 39.4 | 41.3 | 42.2 | 42.4 | 42.1 | 0.6% |
| GDP per person (2007 dollars) | 61808 | 79391 | 73535 | 75024 | 73090 | 73492 | 0.7% |
| Energy Demand | |||||||
| End-use Energy Demand (PJ) | 5.3 | 7.1 | 6.7 | 6.7 | 6.2 | 5.9 | 0.4% |
| By Sector | |||||||
| Residential Sector | 1.0 | 1.0 | 1.0 | 1.0 | 1.1 | 1.1 | 0.6% |
| Commercial Sector | 1.5 | 1.6 | 1.7 | 1.7 | 1.7 | 1.7 | 0.5% |
| Industrial Sector | 1.0 | 2.4 | 2.0 | 1.9 | 1.4 | 1.2 | 0.8% |
| Transportation Sector | 1.8 | 2.2 | 2.0 | 2.0 | 1.9 | 1.8 | 0.1% |
| By Energy Source | |||||||
| Electricity | 1.4 | 1.6 | 1.6 | 1.6 | 1.6 | 1.6 | 0.6% |
| Natural Gas | 0.2 | 0.2 | 0.2 | 0.2 | 0.2 | 0.2 | -0.4% |
| RPP and NGLs | 3.6 | 5.3 | 4.8 | 4.8 | 4.3 | 4.0 | 0.4% |
| Other | 0.1 | 0.1 | 0.1 | 0.1 | 0.1 | 0.1 | 1.6% |
| Primary Energy Demand (PJ) | 5.7 | 8.0 | 7.2 | 7.1 | 6.6 | 6.4 | 0.5% |
| Oil and Natural Gas Liquids | |||||||
| Crude Oil Production (MMb/d) | - | - | - | - | - | - | - |
| Conventional - Light | - | - | - | - | - | - | - |
| Conventional - Heavy | - | - | - | - | - | - | - |
| Pentane Plus and field condensate | - | - | - | - | - | - | - |
| Mined Bitumen | - | - | - | - | - | - | - |
| In Situ Bitumen | - | - | - | - | - | - | - |
| (Upgraded Bitumen) | - | - | - | - | - | - | - |
| NGL Production (MMb/d) | - | - | - | - | - | - | - |
| Ethane | - | - | - | - | - | - | - |
| Propane | - | - | - | - | - | - | - |
| Butane | - | - | - | - | - | - | - |
| Pentane Plus and field condensate | - | - | - | - | - | - | - |
| Natural Gas | |||||||
| Natural Gas Production (Bcf/d) | - | - | - | - | - | - | - |
| Solution | - | - | - | - | - | - | - |
| Non Associated | - | - | - | - | - | - | - |
| Tight | - | - | - | - | - | - | - |
| Shale | - | - | - | - | - | - | - |
| Coalbed Methane | - | - | - | - | - | - | - |
| Electricity | |||||||
| Generation (GW.h) | 411 | 508 | 503 | 511 | 504 | 512 | 0.9% |
| Capacity (MW) | 120 | 264 | 274 | 277 | 282 | 282 | 3.3% |
| Hydro/Wave/Tidal | 85 | 85 | 90 | 95 | 95 | 95 | 0.4% |
| Wind | 1 | 1 | 6 | 6 | 6 | 6 | 7.1% |
| Biomass/Geothermal | 0 | 3 | 6 | 7 | 7 | 7 | - |
| Solar | - | - | - | - | - | - | - |
| Uranium | - | - | - | - | - | - | - |
| Coal & Coke | - | - | - | - | - | - | - |
| Natural Gas | 0 | 150 | 150 | 150 | 150 | 150 | - |
| Oil | 34 | 25 | 22 | 19 | 24 | 24 | -1.3% |
| Key Indicators | |||||||
| Canada GDP (Billions of $2007) | 1748.7 | 1947.5 | 2104.4 | 2302.3 | 2504.6 | 2679.9 | 1.7% |
| Exchange Rate ($US per C$) | 0.90 | 0.81 | 0.80 | 0.80 | 0.82 | 0.82 | -0.4% |
| Crude Oil Price (Brent) | 99.02 | 81.62 | 90.26 | 97.99 | 102.40 | 107.04 | 0.3% |
| Natural gas Price (Henry Hub) | 4.39 | 3.85 | 4.10 | 4.25 | 4.40 | 4.55 | 0.1% |
| For full data sets, including High Price, Low Price, Constrained, High LNG, and No LNG Cases, See the EF 2016 Data Appendices | |||||||
NT
Northwest Territories
Key Findings
Results refer to the Reference Case unless otherwise noted.
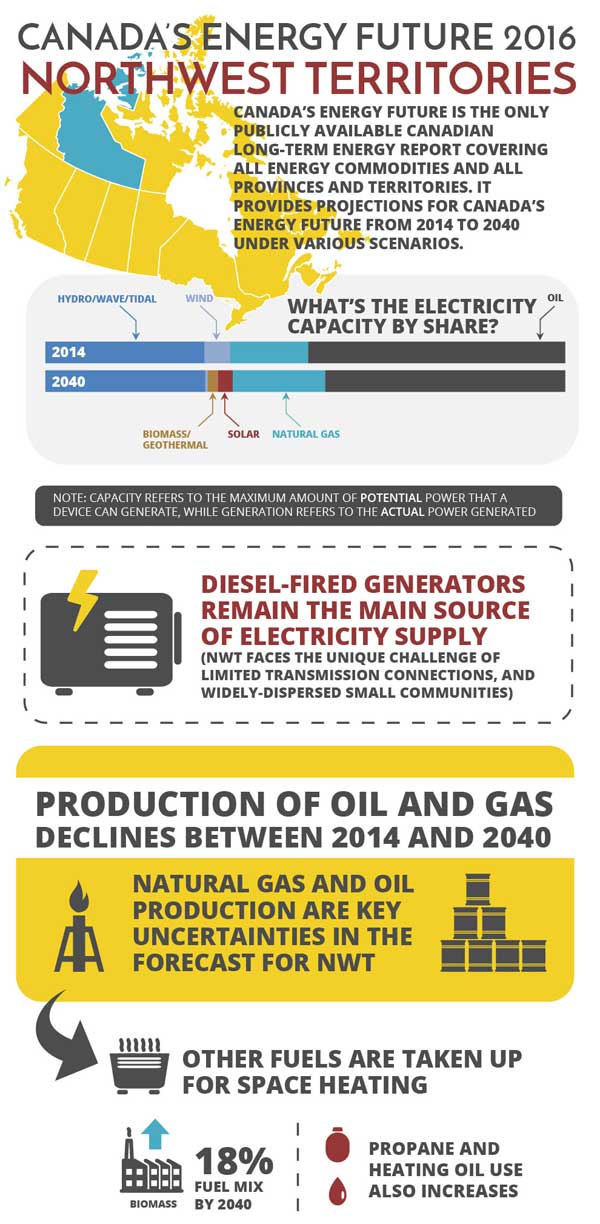
- Production of oil and gas declines throughout the outlook in all cases. Both oil and natural gas production in NWT declines steadily throughout the projection period, with natural gas production reaching zero in 2037, and oil production declining to 2.8 Mb/d in 2040. NWT exploration continues and future discoveries and developments in these areas represent a key uncertainty to the energy supply and energy demand projections for NWT.
- Reduced natural gas production leads to declining natural gas use; other fuels make up the shares in space heating market. The decline of domestic natural gas production in the region decreases its availability and thus its demand in NWT. This reduces end-use demand from 2.8 PJ in 2014 to 0.4 PJ in 2040. This declining demand will allow for further penetration of biomass, particularly in the residential and commercial sectors, where it is projected to increase from 11 per cent of the fuel mix in 2014 to 18 per cent by 2040. Heating oil and propane use also increases over the projection period. Propane mixed with air to form synthetic natural gas is being used in established natural gas distribution networks in Inuvik and Norman Wells.
- Diesel-fired generators will remain the main source of electricity supply. Compared to the rest of Canada, NWT faces a unique challenge with limited transmission connections and widely-dispersed, small communities. Diesel and hydro provide the majority of the region’s electricity demand. Diesel-fired generation is expected to grow with over 60 MW of new capacity expected to startup by the end of the projection period. In addition, a diverse mix of additions is expected to come online including biomass, solar, wind, and natural gas.
Figure NWT.1 - Oil and Gas Production
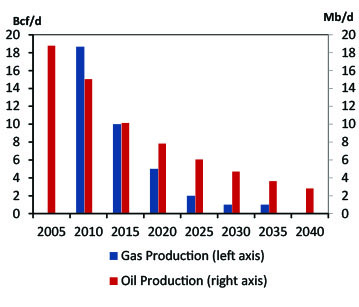
Notes: NWT oil and gas production steadily declines over the projection period. Natural gas production hits zero in 2037 and oil production decreases to 2.8 Mb/d by 2040.
Figure NWT.2 - End-Use Demand by fuel
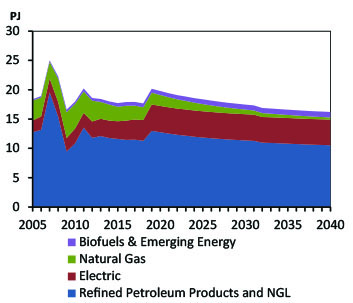
Notes: Despite medium-term increases in end-use demand due to the commissioning of mining facilities, NWT end-use demand declines 10 per cent below 2014 levels. Declining domestic natural gas production causes natural gas demand to decline over the projection, and there is an increased penetration of biomass in the form of wood pellets.
| Northwest Territories | 2014 | 2020 | 2025 | 2030 | 2035 | 2040 | AAGR |
|---|---|---|---|---|---|---|---|
| 2014-2040 | |||||||
| Drivers | |||||||
| Real GDP (millions of 2007 dollars) | 3878.0 | 4456.0 | 4561.0 | 4670.0 | 4742.0 | 4850.0 | 0.9% |
| Population (thousands) | 43.6 | 45.7 | 46.3 | 46.4 | 46.0 | 45.6 | 0.2% |
| GDP per person (2007 dollars) | 88945 | 97505 | 98510 | 100647 | 103087 | 106360 | 0.7% |
| Energy Demand | |||||||
| End-use Energy Demand (PJ) | 18.0 | 19.8 | 18.4 | 17.5 | 16.6 | 16.2 | -0.4% |
| By Sector | |||||||
| Residential Sector | 2.0 | 1.9 | 1.9 | 2.0 | 2.0 | 2.1 | 0.2% |
| Commercial Sector | 2.7 | 3.0 | 3.0 | 3.1 | 3.1 | 3.1 | 0.5% |
| Industrial Sector | 9.5 | 10.6 | 9.1 | 8.2 | 7.4 | 7.1 | -1.1% |
| Transportation Sector | 3.9 | 4.3 | 4.3 | 4.2 | 4.1 | 4.0 | 0.1% |
| By Energy Source | |||||||
| Electricity | 3.0 | 4.5 | 4.5 | 4.5 | 4.4 | 4.4 | 1.5% |
| Natural Gas | 2.7 | 1.9 | 1.2 | 0.8 | 0.5 | 0.4 | -7.4% |
| RPP and NGLs | 11.8 | 12.8 | 11.9 | 11.4 | 10.8 | 10.5 | -0.4% |
| Other | 0.5 | 0.7 | 0.8 | 0.9 | 0.9 | 0.9 | 2.3% |
| Primary Energy Demand (PJ) | 19.2 | 22.9 | 21.4 | 21.3 | 20.3 | 19.9 | 0.2% |
| Oil and Natural Gas Liquids | |||||||
| Crude Oil Production (MMb/d) | 10.6 | 7.8 | 6.1 | 4.7 | 3.6 | 2.8 | -5.0% |
| Conventional - Light | 10.6 | 7.8 | 6.1 | 4.7 | 3.6 | 2.8 | -5.0% |
| Conventional - Heavy | - | - | - | - | - | - | - |
| Pentane Plus and field condensate | - | - | - | - | - | - | - |
| Mined Bitumen | - | - | - | - | - | - | - |
| In Situ Bitumen | - | - | - | - | - | - | - |
| (Upgraded Bitumen) | - | - | - | - | - | - | - |
| NGL Production (MMb/d) | - | - | - | - | - | - | - |
| Ethane | - | - | - | - | - | - | - |
| Propane | - | - | - | - | - | - | - |
| Butane | - | - | - | - | - | - | - |
| Pentane Plus and field condensate | - | - | - | - | - | - | - |
| Natural Gas | |||||||
| Natural Gas Production (Bcf/d) | 0.01 | 0.01 | 0.00 | 0.00 | 0.00 | 0.00 | -100.0% |
| Solution | - | - | - | - | - | - | - |
| Non Associated | - | - | - | - | - | - | - |
| Tight | - | - | - | - | - | - | - |
| Shale | - | - | - | - | - | - | - |
| Coalbed Methane | - | - | - | - | - | - | - |
| Electricity | |||||||
| Generation (GW.h) | 745 | 1095 | 1070 | 1026 | 1007 | 1005 | 1.2% |
| Capacity (MW) | 180 | 232 | 224 | 207 | 208 | 208 | 0.6% |
| Hydro/Wave/Tidal | 55 | 56 | 61 | 64 | 64 | 64 | 0.6% |
| Wind | 9 | 10 | 1 | 1 | 1 | 1 | -8.1% |
| Biomass/Geothermal | 0 | 2 | 4 | 4 | 4 | 4 | - |
| Solar | 0 | 3 | 4 | 5 | 6 | 6 | - |
| Uranium | - | - | - | - | - | - | - |
| Coal & Coke | - | - | - | - | - | - | - |
| Natural Gas | 27 | 27 | 37 | 37 | 37 | 37 | 1.2% |
| Oil | 89 | 134 | 117 | 96 | 96 | 96 | 0.3% |
| Key Indicators | |||||||
| Canada GDP (Billions of $2007) | 1748.7 | 1947.5 | 2104.4 | 2302.3 | 2504.6 | 2679.9 | 1.7% |
| Exchange Rate ($US per C$) | 0.90 | 0.81 | 0.80 | 0.80 | 0.82 | 0.82 | -0.4% |
| Crude Oil Price (Brent) | 99.02 | 81.62 | 90.26 | 97.99 | 102.40 | 107.04 | 0.3% |
| Natural gas Price (Henry Hub) | 4.39 | 3.85 | 4.10 | 4.25 | 4.40 | 4.55 | 0.1% |
| For full data sets, including High Price, Low Price, Constrained, High LNG, and No LNG Cases, See the EF 2016 Data Appendices | |||||||
NU
Nunavut
Key Findings
Results refer to the Reference Case unless otherwise noted.
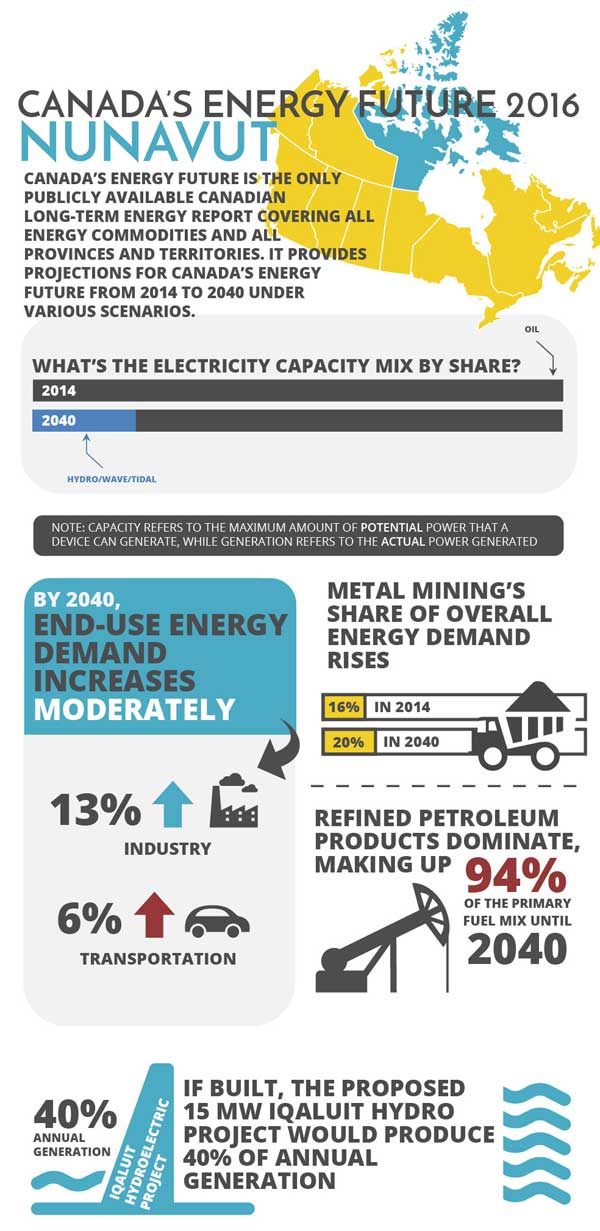
- Energy demand increases moderately over the projection period. End-use demand in Nunavut increases at an average annual rate of 0.3 per cent over the projection period, peaking at 4.0 PJ in 2027 and maintaining that level until 2040. Higher energy prices in the High Price Case reduces end-use demand to 3.8 PJ and lower energy prices in the Low Price Case increases end-use demand to 4.2 PJ over the projection period.
- Industrial demand growth is driven by mining activity. Industrial demand is mostly driven by the expansion of the Baffinland’s Mary River Iron Ore project which is assumed to be commissioned in 2017. Metal mining’s share of end-use demand increases from 16 per cent to 20 per cent over the projection period.
- Refined Petroleum Products continue to dominate the fuel mix. Oil products will continue to constitute over 94 per cent of the primary fuel mix until 2040 but in 2019 Nunavut is assumed to add a new 15 MW hydro plant, the Iqaluit Hydroelectric Project. This new unit will account for 40 per cent (70 GW.h) of annual generation, reducing diesel generation to 105 GW.h.
Figure NU.1 - End-Use Demand by Sector
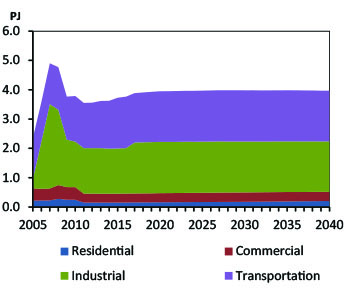
Notes: Demand is fairly flat, peaking around four PJ in 2027 and remaining around there until 2040 for a growth of about 9 per cent over 2014 levels.
Figure NU.2 - Primary Fuel Mix of Nunavut
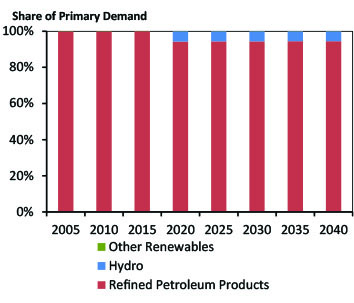
Notes: The Refined petroleum product share of the primary fuel mix in Nunavut declines from nearly 100 per cent in 2014 to 94.5 per cent in 2019, where it remains for the rest of the projection period. Hydro gains a 4.5 per cent share when the Iqaluit Hydroelectric Project is assumed to come online in 2019.
| Nunavut | 2014 | 2020 | 2025 | 2030 | 2035 | 2040 | AAGR |
|---|---|---|---|---|---|---|---|
| 2014-2040 | |||||||
| Drivers | |||||||
| Real GDP (millions of 2007 dollars) | 2098.0 | 2322.0 | 2434.0 | 2548.0 | 2650.0 | 2751.0 | 1.0% |
| Population (thousands) | 36.6 | 38.3 | 39.2 | 39.9 | 40.3 | 40.6 | 0.4% |
| GDP per person (2007 dollars) | 57322 | 60627 | 62092 | 63860 | 65757 | 67759 | 0.6% |
| Energy Demand | |||||||
| End-use Energy Demand (PJ) | 3.6 | 3.9 | 4.0 | 4.0 | 4.0 | 4.0 | 0.3% |
| By Sector | |||||||
| Residential Sector | 0.2 | 0.2 | 0.2 | 0.2 | 0.2 | 0.2 | 1.1% |
| Commercial Sector | 0.3 | 0.3 | 0.3 | 0.3 | 0.3 | 0.3 | 0.2% |
| Industrial Sector | 1.5 | 1.8 | 1.7 | 1.7 | 1.7 | 1.7 | 0.4% |
| Transportation Sector | 1.6 | 1.7 | 1.7 | 1.7 | 1.7 | 1.7 | 0.2% |
| By Energy Source | |||||||
| Electricity | 0.5 | 0.6 | 0.6 | 0.6 | 0.6 | 0.6 | 0.6% |
| Natural Gas | 0.0 | 0.0 | 0.0 | 0.0 | 0.0 | 0.0 | - |
| RPP and NGLs | 3.1 | 3.4 | 3.4 | 3.4 | 3.4 | 3.3 | 0.3% |
| Other | 0.0 | 0.0 | 0.0 | 0.0 | 0.0 | 0.0 | 1.0% |
| Primary Energy Demand (PJ) | 4.7 | 4.6 | 4.7 | 4.7 | 4.8 | 4.8 | 0.1% |
| Oil and Natural Gas Liquids | |||||||
| Crude Oil Production (MMb/d) | - | - | - | - | - | - | - |
| Conventional - Light | - | - | - | - | - | - | - |
| Conventional - Heavy | - | - | - | - | - | - | - |
| Pentane Plus and field condensate | - | - | - | - | - | - | - |
| Mined Bitumen | - | - | - | - | - | - | - |
| In Situ Bitumen | - | - | - | - | - | - | - |
| (Upgraded Bitumen) | - | - | - | - | - | - | - |
| NGL Production (MMb/d) | - | - | - | - | - | - | - |
| Ethane | - | - | - | - | - | - | - |
| Propane | - | - | - | - | - | - | - |
| Butane | - | - | - | - | - | - | - |
| Pentane Plus and field condensate | - | - | - | - | - | - | - |
| Natural Gas | |||||||
| Natural Gas Production (Bcf/d) | - | - | - | - | - | - | - |
| Solution | - | - | - | - | - | - | - |
| Non Associated | - | - | - | - | - | - | - |
| Tight | - | - | - | - | - | - | - |
| Shale | - | - | - | - | - | - | - |
| Coalbed Methane | - | - | - | - | - | - | - |
| Electricity | |||||||
| Generation (GW.h) | 152 | 164 | 167 | 169 | 173 | 179 | 0.6% |
| Capacity (MW) | 54 | 69 | 73 | 73 | 77 | 77 | 1.4% |
| Hydro/Wave/Tidal | 0 | 15 | 15 | 15 | 15 | 15 | - |
| Wind | - | - | - | - | - | - | - |
| Biomass/Geothermal | - | - | - | - | - | - | - |
| Solar | - | - | - | - | - | - | - |
| Uranium | - | - | - | - | - | - | - |
| Coal & Coke | - | - | - | - | - | - | - |
| Natural Gas | - | - | - | - | - | - | - |
| Oil | 54 | 54 | 58 | 58 | 62 | 62 | 0.5% |
| Key Indicators | |||||||
| Canada GDP (Billions of $2007) | 1748.7 | 1947.5 | 2104.4 | 2302.3 | 2504.6 | 2679.9 | 1.7% |
| Exchange Rate ($US per C$) | 0.90 | 0.81 | 0.80 | 0.80 | 0.82 | 0.82 | -0.4% |
| Crude Oil Price (Brent) | 99.02 | 81.62 | 90.26 | 97.99 | 102.40 | 107.04 | 0.3% |
| Natural gas Price (Henry Hub) | 4.39 | 3.85 | 4.10 | 4.25 | 4.40 | 4.55 | 0.1% |
| For full data sets, including High Price, Low Price, Constrained, High LNG, and No LNG Cases, See the EF 2016 Data Appendices | |||||||
- Date modified: