ARCHIVED – Canada’s Energy Future 2016: Province and Territory Outlooks
This page has been archived on the Web
Information identified as archived is provided for reference, research or recordkeeping purposes. It is not subject to the Government of Canada Web Standards and has not been altered or updated since it was archived. Please contact us to request a format other than those available.
Introduction
Canada’s Energy Future 2016 Province and Territory Outlooks provides an overview of the regional dynamics in Canada’s Energy Future 2016 Energy Supply and Demand Projections to 2040 (EF 2016). It reviews EF 2016 findings and data points for each province and territory, and compares energy production and consumption trends between the regions.
The projections presented in both EF 2016 and this supplemental report are a baseline for discussing Canada’s energy future and do not represent the Board’s predictions of what will take place in the future. The projections in EF 2016 are based on assumptions which allow for analysis of possible outcomes. Any assumptions made about current or future energy infrastructure or market developments are strictly theoretical and have no bearing on the regulatory proceedings that are or will be before the Board.
Only policies and programs that are law at the time of analysis are included in the EF 2016 projections. As a result, any policies under consideration, or new policies developed after the projections were completed in the summer of 2015, are not included in this analysis. Several provinces announced new energy plans and policies prior to the Paris climate conference in late 2015. These announcements and policy changes are not included in the EF 2016 projections.
EF 2016: Cases and Key Assumptions
EF 2016 contains six projections or ‘cases’ for energy supply and demand in Canada covering various uncertainties. An overview of the cases, key assumptions, and drivers is shown in Figure 1.1. For further information on EF 2016 see the full report, and detailed data appendices.
Figure 1.1 - Overview of EF 2016 Projections and Key Assumptions
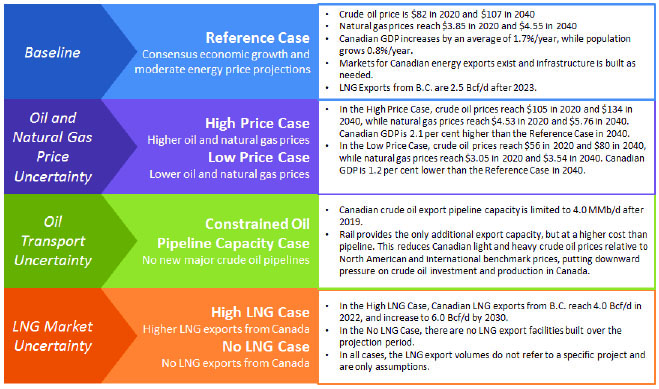
Crude Oil Prices: Brent, 2015 US$, Natural Gas Prices: Henry Hub, 2015 US$, Gross Domestic Product (GDP): 2007$ C$

- Date modified: