ARCHIVED – National Energy Board – 2018–19 Departmental Results Report – Results: what we achieved
This page has been archived on the Web
Information identified as archived is provided for reference, research or recordkeeping purposes. It is not subject to the Government of Canada Web Standards and has not been altered or updated since it was archived. Please contact us to request a format other than those available.
Core Responsibilities
Energy Adjudication
Description
Making decisions or recommendations to the Governor in Council on applications, which include environmental assessments, using processes that are fair, transparent, timely and accessible. These applications pertain to pipelines and related facilities, international power lines, tolls and tariffs, energy exports and imports, and oil and gas exploration and drilling in certain northern and offshore areas of Canada.
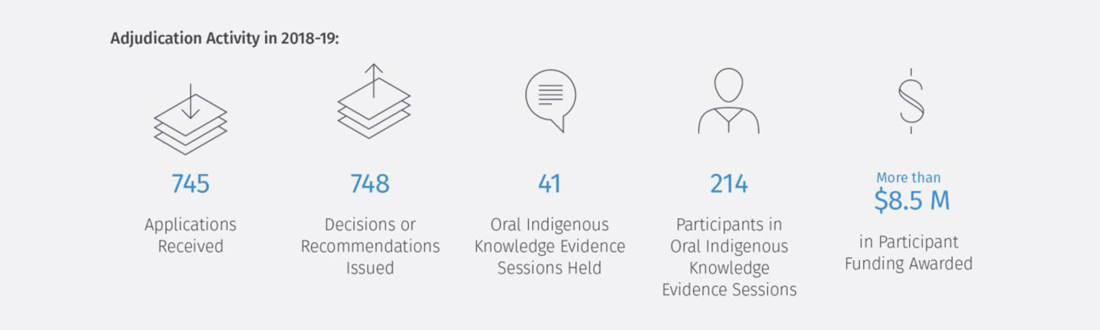
Adjudication Activity in 2018–19:
- 745 Applications Received
- 748 Decisions or Recommendations Issued
- 41 Oral Indigenous Knowledge Evidence Sessions Held
- 214 Participants in Oral Indigenous Knowledge Evidence Sessions
- More than $8.5 M in Participant Funding Awarded
Results
The NEB uses feedback from past participants on different aspects of our hearing processes to plan and implement improvements in the way we work. Initiatives undertaken in 2018–19 included:
- Expanding our use of alternative dispute resolution (ADR) as a part of the major project detailed route hearings. ADR can lead to positive outcomes because it provides participants with a way to collaborate on finding solutions, and can be applied specifically to local issues. This not only results in more efficient and timely processes: it facilitates positive, open dialogue between companies and participants. Through ADR, about 84% of land matters complaints were resolved outside of formal adjudicative processes.
- Creating a partnership with the non-profit organization Code for Canada (C4C)Footnote 10 to modernize REGDOCS, the NEB’s publicly accessible database of regulatory documents that includes hearing reports, environmental assessments, transcripts, and decisions. C4C fellows will work with NEB employees to research, develop, test, and iterate a digital solution to make it easier to discover energy projects of interest, extract information about those projects, and submit documents to be considered by the NEB.
- Refining our Participant Funding Program (PFP) processes to provide eligible hearing participants with improved service. Starting with the NOVA Gas Transmission Ltd. – Northwest Mainline Loop (Boundary Lake North Section)Footnote 11 in March 2018, PFP piloted a streamlined application process to reduce burden on applicants and provide funding assurance more quickly. The percentage of applicants who are satisfied with the service provided by PFP remains above target at 89%. This year, funding decisions were provided within eight days of a complete funding application or application deadline, greatly surpassing the 30-day service standard.
These kinds of initiatives increase clarity of NEB processes and reduce barriers to participation, while maintaining procedural fairness and efficient, timely completion of processes.
An important aspect of increasing accessibility and transparency of Energy Adjudication processes is ensuring that they meet the needs of diverse groups of participants, including Indigenous Peoples. The NEB worked with Indigenous intervenors to co-develop a consultation approach for the 2021 NGTL System Expansion ProjectFootnote 12, which crosses dozens of traditional territories. This resulted in some key changes being made in the process, including holding sessions for Oral Indigenous Knowledge on the Tsuut’ina Nation lands in Calgary, and extending certain deadlines to accommodate cultural activities. Flexibility in how we approach the design of specific hearing processes enables richer, more diverse participation and information-gathering, which in turn results in a better outcome for all parties.
Our performance results indicate that we still have more work to do in ensuring that adjudication processes are transparent to all participants. The Energy Adjudication program is actively considering ways to address participant concerns and will focus on this work over the 2019–20 fiscal year.
Results achieved
| Departmental results | Performance indicators | Target | Date to achieve target | 2018–19 Actual results |
2017–18 Actual results |
2016–17 Actual results |
|---|---|---|---|---|---|---|
| Energy adjudication processes are fair. | Percentage of adjudication decisions overturned on judicial appeal related to procedural fairness. | 0% | Annually | 0%Table Note a | 0% | 0% |
| Energy adjudication processes are timely. | Percentage of adjudication decisions and recommendations that are made within legislated time limits and service standards. | 100% | Annually | 100% | 100% | 100% |
| Energy adjudication processes are transparent. | Percentage of surveyed participants who indicate that adjudication processes are transparent. | 75% | Annually | 73% | 88% | 79% |
| Energy adjudication processes are accessible. | Percentage of surveyed participant funding recipients who agree that participant funding enabled their participation in an adjudication process. | 90% | Annually | 100% | 94% | 92% |
Budgetary financial resources (dollars)
| 2018–19 Main Estimates |
2018–19 Planned spending |
2018–19 Total authorities available for use |
2018–19 Actual spending (authorities used) |
2018–19 Difference (Actual spending minus Planned spending) |
|---|---|---|---|---|
| 20,000,175 | 20,000,175 | 30,184,499 | 23,372,250 | 3,372,075 |
Human resources (full-time equivalents)
| 2018–19 Planned full-time equivalents |
2018–19 Actual full-time equivalents |
2018–19 Difference (Actual full-time equivalents minus Planned full-time equivalents) |
|---|---|---|
| 118.30 | 103.85 | (14.45) |
Financial, human resources and performance information for the NEB’s Program Inventory is available in the GC InfoBase.Footnote 13
Safety and Environment Oversight
Description
Setting and enforcing regulatory expectations for National Energy Board-regulated companies over the full lifecycle (construction, operation and abandonment) of energy-related activities. These activities pertain to pipelines and related facilities, international power lines, tolls and tariffs, energy exports and imports, and oil and gas exploration and drilling in certain northern and offshore areas of Canada.
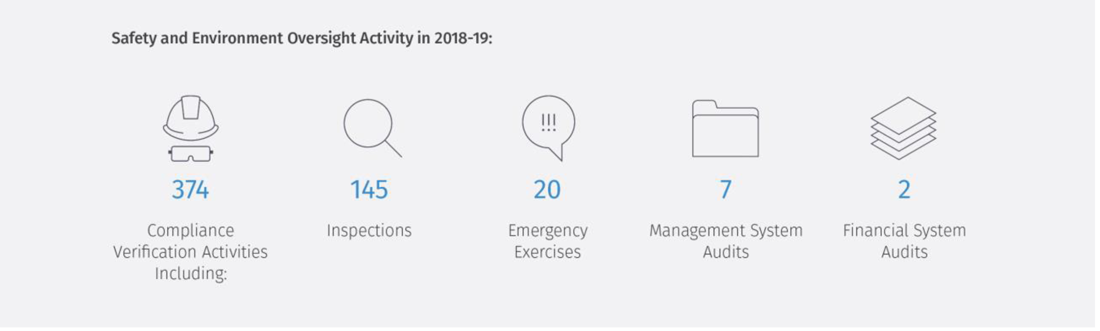
Safety and Environment Oversight in 2018–19:
- 374 Compliance verification Activitires Including:
- 145 Inspections
- 20 Emergency Exercises
- 7 Management System Audits
- 2 Financial System Audits
Results
Major construction activity increased in 2018–19, including work on the Enbridge Line 3 and Trans Mountain Expansion projects. The NEB implemented integrated project management for the oversight of the projects, intended to provide timely identification of risks and emerging issues across all streams of regulatory oversight and to provide the public with more information on regulatory oversight of the projects.
Because of known risks, including higher rates of worker injuries associated with construction activity, the NEB also put in place a worker safety oversight plan. Activities under this plan included:
- Conducting pre-construction audits, such as our audit in advance of the Keystone XL Pipeline construction, with a focus on contractor oversight.
- Undertaking compliance and enforcementFootnote 14 activities related to serious injuries in addition to following up on every incident. This included inspectors visiting the field to observe firsthand how the companies conduct incident response. Over 2018–19, the NEB conducted 23 field inspections directly related to worker safety, including eight on Enbridge Line 3.
- Establishing a Serious Injury and Fatality Team that is convened when any serious injury is reported to the NEB. This team consists of a number of safety experts who assess the incident to determine where further compliance and enforcement action could be taken.
Even with enhanced oversight activities, the NEB saw an increase in the number of incidents that harm people or the environment with the total numbers rising from 19 in 2017–18 to 25 in 2018–19. The biggest proportion of the incidents related to construction worker activity.
As a result of reviews of these serious injuries the NEB has further increased our oversight of construction projects and in particular third-party contractors. We are also reaching out to other industries and regulators to share learnings and approaches that can help reduce serious injuries to workers.
In addition to augmenting our inspection and oversight processes, the NEB has worked to understand and prevent possible incidents from occurring, and to influence the development of strong safety culture in industry. For example, by undertaking focused engagement with stakeholders and industry in 2018–19, the NEB has driven improvements in damage prevention outcomes, with the number of Unauthorized Activities (UAs) or “near misses”Footnote 15 reported dropping by just over 16%, from 276 to 231.
“The cooperation between the NEB Inspection Officers and IAMC Indigenous Monitors was very respectful. The first inspection, we issued an Order—that was pretty successful. We found something that needed addressing and it was accepted by the Inspection Officers after they looked into it. That was exciting for me – to see how they work, how they understand things. Every step of the way I was included.” – IAMC Indigenous Monitor
“Working with Indigenous Monitors helped me broaden my lens, to include elements that I would have not picked up in inspections before. It helped me do my job and ensure that impacts on the land and on Indigenous culture were avoided or minimized.” – NEB Inspection Officer
The NEB continued its work to support and promote a positive industry safety culture, hosting a Safety Culture Workshop in February 2019. This initiative brought together representatives from NEB-regulated companies with NEB technical staff and executives to have an open dialogue on safety culture advancement efforts, challenges and best practices. Workshop attendees discussed the relevance of these findings to the oil and gas sector and offered insights about alternative approaches that are currently being employed and lessons learned. The workshop facilitated meaningful conversation among the participants and encouraged sharing of experiences and learning from one another in a small group environment.
Including Indigenous Peoples in the monitoring of energy infrastructure creates stronger safety and environmental oversight outcomes and prevents harm. Over 2018–19, IAMC Monitors and NEB Inspection Officers participated in three joint training exercises, and the Enbridge Line 3 and TMEP IAMC Indigenous Monitors participated in 35 inspections and emergency management events with the NEB. The program had immediate effects that resulted in an increased, shared understanding of Indigenous interests and NEB’s regulatory role. It also made significant in-roads towards relationship-building and long-term changes in the capacity of the NEB to integrate Indigenous Knowledge, values, and perspectives into its work.
Results achieved
| Departmental results | Performance indicators | Target | Date to achieve target | 2018–19 Actual results |
2017–18 Actual results |
2016–17 Actual results |
|---|---|---|---|---|---|---|
| Harm to people or the environment, throughout the lifecycle of energy-related activities, is prevented. | Number of incidents related to National Energy Board-regulated infrastructure that harm people or the environment. | 0 | Annually | 25 | 19Table Note a | 16 |
| Percentage change of specific incident types on National Energy Board-regulated infrastructure. | 10% decrease | Annually | 2% increase | 13%Table Note b increase | 11% increase | |
| Percentage change of near misses on National Energy Board-regulated infrastructure. | 5% decrease | Annually | 9% decrease | 15%Table Note c increase |
13% increase | |
Budgetary financial resources (dollars)
| 2018–19 Main Estimates |
2018–19 Planned spending |
2018–19 Total authorities available for use |
2018–19 Actual spending (authorities used) |
2018–19 Difference (Actual spending minus Planned spending) |
|---|---|---|---|---|
| 26,151,718 | 26,151,178 | 30,981,551 | 22,648,545 | (3,503,633) |
Human resources (full-time equivalents)
| 2018–19 Planned full-time equivalents |
2018–19 Actual full-time equivalents |
2018–19 Difference (Actual full-time equivalents minus Planned full-time equivalents) |
|---|---|---|
| 143.20 | 120.24 | (22.96) |
Financial, human resources and performance information for the NEB’s Program Inventory is available in the GC InfoBase.Footnote 16
Energy Information
Description
Collecting, monitoring, analyzing and publishing information on energy markets and supply, sources of energy, and the safety and security of pipelines and international power lines.
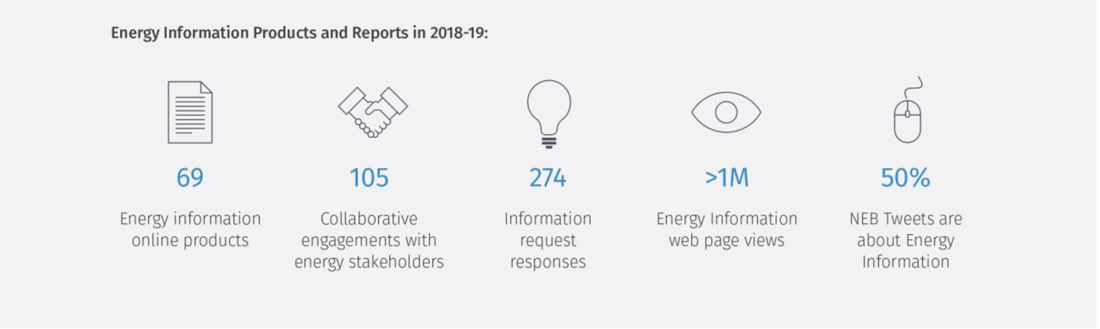
Energy Information Products and Reports in 2018–19:
- 69 Energy information online products
- 105 Collaborative engagements with energy stakeholders
- 274 Information request responses
- >1M Energy Information web page views
- 50% NEB Tweets are about Energy Information
Results
Key NEB Energy Reports Released in 2018–19
Over 2018–19, the NEB developed a data-driven strategy which included new methods for assessing what issues are of most interest to Canadians, and what data and products are most effective in demonstrating industry outcomes, public safety and NEB performance. As a part of this strategy, we also increased opportunities for Canadians, other regulators and non-government organizations to collaborate and work in partnership with the NEB on pipeline safety and energy market information products. During the course of the year, the NEB:
- Partnered with Ingenium: Canadian Museums for Science and InnovationFootnote 17 to create a lesson plan for high school studentsFootnote 18 that teaches them about energy in Canada. It is based on the NEB’s Canada’s Energy Future 2018: Energy Supply and Demand Projections to 2040Footnote 19 analysis and uses the Exploring Canada’s Energy FutureFootnote 20 interactive data visualization tool. The lesson plan, which was downloaded 1436 times during the year, is designed to encourage students’ own observations about energy generation and consumption, provide them with the tools to engage in important conversations about energy in Canada, and increase their energy literacy.
- Collaborated with Natural Resources Canada, Environment and Climate Change Canada, and Statistics Canada on a project to centralize all national energy data in a single online Canadian Energy Information PortalFootnote 21. This portal provides Canadians with a single point of access to a wide variety of statistics and measures of the country's energy sector. The portal also features an interactive dashboard that provides a comprehensive picture of the Canadian energy sector, with a focus on monthly and provincial usage. The initiative will benefit anyone interested in obtaining data on energy who may not have prior knowledge of where or how to find that information, and create a more efficient mechanism for both NEB employees and members of the public who regularly use energy data.
- Released new Import and Export Visualizations, and the 2018 edition of the Energy Futures Report, which includes two new scenarios regarding Canada’s energy future. In addition, the NEB updated its online Condition Compliance Table and Pipeline Throughput data. We continued to produce a portfolio of publications on energy supply, demand and infrastructure as part of the our ongoing market monitoring and assessment of Canadian energy requirements and trends.
- Created a pipeline information portal that is easily accessible and understandable by any user, including an updated and improved Interactive Pipeline MapFootnote 22; a new Safety Performance DashboardFootnote 23; and, a more comprehensive dataset of all conditions associated with approved pipeline projectsFootnote 24. Feedback from Indigenous Peoples and landowners has been positive, indicating that having access to information about incidents, owners and geographical locations of pipelines is a valuable tool that enhances their ability to interact both the pipeline companies, and with the NEB as the regulator.
- Released two reports (Western Canadian Crude Oil Supply, Markets and Pipeline CapacityFootnote 25, and Optimizing Oil Pipeline and Rail Capacity out of Western CanadaFootnote 26) in response to a request from the Minister of Natural Resources on how to optimize oil transportation capacity on existing pipelines and rail. The request was made at a time when crude oil prices were heavily discounted in Canada creating important challenges for Canadian oil producers. The reports found that oil pipeline systems are currently running at capacity and market players are operating within the rules set up in tariffs and legislation.
Program targets were exceeded and response to new products were consistently high during 2018–19, from in-depth reports on energy analysis to innovative online energy quizzesFootnote 27 and snapshots. The Energy Information program continues to be instrumental in supporting energy literacy across many platforms, and in conveying the role and the work of the NEB to a broader audience.
Results achieved
| Departmental results | Performance indicators | Target | Date to achieve target | 2018–19 Actual results |
2017–18 Actual results |
2016–17 Actual results |
|---|---|---|---|---|---|---|
| Canadians have access to and use energy information for knowledge, research and decision making. | Number of times energy information is accessed. | 750,000 | Annually | 1,216,873 | 986,347 | 879, 831 |
| Percentage of surveyed web users who agree that energy information is useful for knowledge, research or decision making. | 75% | Annually | 90% | 84% | Not availableTable Notee a | |
| Canadians have access to community-specific NEB-regulated infrastructure information. | Increased information specific to National Energy Board-regulated infrastructure in communities. | 5 new datasets | Annually | 15 | 5 | 7 |
| Canadians have opportunities to collaborate and provide feedback on NEB information products. | Number of opportunities that Canadians have to collaborate and provide feedback on energy information products. | 42 | Annually | 105 | 76 | Not availableTable Note a |
Budgetary financial resources (dollars)
| 2018–19 Main Estimates |
2018–19 Planned spending |
2018–19 Total authorities available for use |
2018–19 Actual spending (authorities used) |
2018–19 Difference (Actual spending minus Planned spending) |
|---|---|---|---|---|
| 4,931,394 | 4,931,394 | 6,520,219 | 9,554,137 | 4,622,743 |
Human resources (full-time equivalents)
| 2018–19 Planned full-time equivalents |
2018–19 Actual full-time equivalents |
2018–19 Difference (Actual full-time equivalents minus Planned full-time equivalents) |
|---|---|---|
| 36.90 | 47.78 | 10.88 |
Financial, human resources and performance information for the NEB’s Program Inventory is available in the GC InfoBase.Footnote 28
Engagement
Description
Engaging with stakeholders and Indigenous Peoples on topics within the NEB’s mandate and role, beyond engagement on specific projects.
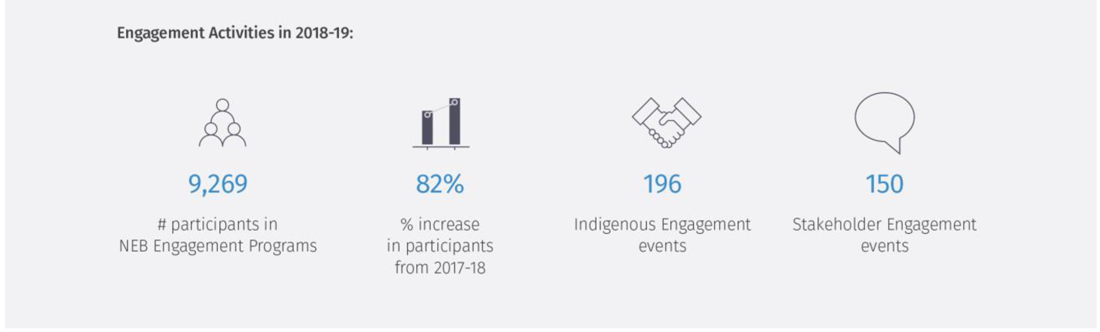
Engagement Activities in 2018–19:
- 9,269 # participants in NEB Engagement Programs
- 82% % increase in participants from 2017–18
- 196 Indigenous Engagement events
- 150 Stakeholder Engagement events
Results
The NEB is committed to enhancing regulatory outcomes through system-wide engagement approaches. In 2018–19, the NEB created new and additional opportunities for engagement between the NEB, Indigenous Peoples and stakeholders. Key initiatives included:
- The establishment of a Three-Year Focus Area on Reconciliation, reflecting an organization-wide understanding and agreement that as we modernize assessment and lifecycle oversight activities, we must also reconcile our relationships with Indigenous Peoples and engage differently.
- Development of an Indigenous Cultural Competence Framework that will shape our policies, processes and training going forward. The goal of the Framework is to provide specific, consistent and structured knowledge and skills that improve our ability to competently and respectfully engage with Indigenous People.
- Provision of support and resources to the IAMC committees for the TMEP and Enbridge Line 3 projects, which provide Indigenous groups and communities with direct participation in monitoring activities alongside NEB inspectors. The NEB will also continue to formalize ways for Indigenous Peoples to participate directly in the NEB’s regulatory processes in a sustainable manner.
- Extensive consultation and information-sharing through the NEB’s Land Matters Group (LMG) and the LMG Advisory Committee on regulatory implementation of Bill C-69, including early consultation on issues of significant interest like Compensation Dispute ResolutionFootnote 29, Power Line Damage Prevention RegulationsFootnote 30, and the development of a Land Matters Advisory Service.
An investment of additional staff in our Montreal and Vancouver regional offices, including subject matter experts on damage prevention, emergency management, environmental protection and pipeline integrity, has strengthened the NEB’s ability to engage proactively with Indigenous groups, regional municipalities and local stakeholders on issues particular to those areas.
The Vancouver Regional Office’s ongoing meetings with the Lower Mainland Municipalities allowed technical staff from the NEB to meet face-to-face with municipal stakeholders regarding increased costs incurred by municipalities as a result of work conducted near NEB-regulated pipelines and identify options to address these concerns. Early engagement in this area will inform the on-going development of Cost ApportionmentFootnote 31 regulations.
The Montreal Regional Office (MRO) worked with officials from the Communauté métropolitaine de Montréal and the Quebec Government to finalize the Cadre de référence Intervention Pipelines [in French]Footnote 32, a framework aimed at clarifying the roles and responsibilities of Emergency Management officials from all levels of government in the event of a pipeline incident in the province. The MRO has also engaged extensively with officials from Public Safety Quebec, Public Safety Canada and other municipalities, including the City of Montreal to organize Diapason 2, a two-day table-top incident response exercise involving more than 150 participants. This was the second table-top exercise organized in the region, and these exercises continue to be well-attended and well-received.
Results achieved
| Departmental results | Performance indicators | Target | Date to achieve target | 2018–19 Actual results |
2017–18 Actual results |
2016–17 Actual results |
|---|---|---|---|---|---|---|
| Stakeholders and Indigenous Peoples share their perspectives and provide feedback regarding the NEB mandate and role. | Number of participants in National Energy Board engagement programs. | 5,000 | Annually | 9,269 | 4,270 | 723 |
| NEB engagement activities with stakeholders and Indigenous Peoples are meaningful. | Percentage of surveyed stakeholders who engaged with the National Energy Board who indicate that the engagement was meaningful. | 75% | Annually | 84% | 76% | Not availableTable Note a |
| Percentage of surveyed Indigenous Peoples who engaged with the National Energy Board who indicate that the engagement was meaningful. | 75% | Annually | 80% | 80% | Not availableTable Note a | |
Budgetary financial resources (dollars)
| 2018–19 Main Estimates |
2018–19 Planned spending |
2018–19 Total authorities available for use |
2018–19 Actual spending (authorities used) |
2018–19 Difference (Actual spending minus Planned spending) |
|---|---|---|---|---|
| 6,462,601 | 6,462,601 | 9,115,931 | 5,811,773 | (650,828) |
Human resources (full-time equivalents)
| 2018–19 Planned full-time equivalents |
2018–19 Actual full-time equivalents |
2018–19 Difference (Actual full-time equivalents minus Planned full-time equivalents) |
|---|---|---|
| 23.00 | 33.99 | 10.99 |
Financial, human resources and performance information for the NEB’s Program Inventory is available in the GC InfoBase.Footnote 33
Internal Services
Description
Internal Services are those groups of related activities and resources that the federal government considers to be services in support of programs and/or required to meet corporate obligations of an organization. Internal Services refers to the activities and resources of the 10 distinct service categories that support Program delivery in the organization, regardless of the Internal Services delivery model in a department. The 10 service categories are:
- Acquisition Management Services
- Communications Services
- Financial Management Services
- Human Resources Management Services
- Information Management Services
- Information Technology Services
- Legal Services
- Materiel Management Services
- Management and Oversight Services
- Real Property Management Services
Building on the management system rigor established in the regulatory programs, the NEB formalized a performance framework for Internal Services, to assess performance and to align Internal Service program plans and priorities with the NEB’s broader program strategies.
As a part of the Internal Services performance framework, the NEB clarified and strengthened the role of the Management and Oversight program as the steward of the NEB’s management system, to imbed management system principles across every NEB program. This integrated management system approach will support NEB staff and leaders in driving continual improvement in the delivery of our Departmental Results and our mandate.
The work of the NEB is driven through data analysis, information exchange and performance measurement. The world of data and information is continually changing, and over 2018–19 the NEB focused on a transformation of how we manage and use data to enable and support our staff and to meet the energy information needs of Canadians.
The result is a three-year strategy to:
- provide Canadians with greater access to our data and information;
- increase opportunities for citizen science; and,
- introduce new technologies and approaches to data collection.
Results
Budgetary financial resources (dollars)
| 2018–19 Main Estimates |
2018–19 Planned spending |
2018–19 Total authorities available for use |
2018–19 Actual spending (authorities used) |
2018–19 Difference (Actual spending minus Planned spending) |
|---|---|---|---|---|
| 0 | 0 | 14,710,000Table Note a | 14,710,000 | 0 |
| 19,946,812 | 19,946,812 | 23,527,623 | 32,009,262 | 12,062,450 |
Human resources (full-time equivalents)
| 2018–19 Planned full-time equivalents |
2018–19 Actual full-time equivalents |
2018–19 Difference (Actual full-time equivalents minus Planned full-time equivalents) |
|---|---|---|
| 143.10 | 170.58 | 27.48 |
Financial, human resources and performance information for the NEB’s Program Inventory is available in the GC InfoBase.Footnote 35
- Date modified: