ARCHIVED – National Energy Board – 2015–16 Departmental Performance Report – Section II: Expenditure Overview
This page has been archived on the Web
Information identified as archived is provided for reference, research or recordkeeping purposes. It is not subject to the Government of Canada Web Standards and has not been altered or updated since it was archived. Please contact us to request a format other than those available.
Section II: Expenditure Overview
Actual Expenditures
| 2015–16 Main Estimates |
2015–16 Planned Spending |
2015–16 Total Authorities Available for Use |
2015–16 Actual Spending (authorities used) |
2015–16 Difference (actual minus planned) |
|---|---|---|---|---|
| 76,820,510 | 77,550,511 | 96,437,428 | 82,396,568 | 4,846,057 |
| 2015–16 Planned |
2015–16 Actual |
2015–16 Difference (actual minus planned) |
|---|---|---|
| 471.2 | 457.5 | (13.8) |
Budgetary Performance Summary
| Strategic Outcome(s), Program(s) and Internal Services |
2015–16 Main Estimates |
2015–16 Planned Spending |
2016–17 Planned Spending |
2017–18 Planned Spending |
2015–16 Total Authorities Available for Use |
2015–16 Actual Spending (authorities used) |
2014–15 Actual Spending (authorities used) |
2013–14 Actual Spending (authorities used) |
|---|---|---|---|---|---|---|---|---|
| 1.1 Energy Regulation Program | 49,588,459 | 52,632,974 | 61,322,894 | 44,906,857 | 62,723,358 | 43,185,092 | 45,310,493 | 47,970,746 |
| 1.2 Energy Information Program | 5,982,273 | 5,620,814 | 7,648,605 | 7,018,161 | 8,475,092 | 9,018,344 | 6,567,390 | 6,156,305 |
| Subtotal | 55,570,732 | 58,253,788 | 68,971,499 | 51,925,018 | 71,198,450 | 52,203,436 | 51,877,883 | 54,127,051 |
| Internal Services Subtotal | 21,249,778 | 19,296,723 | 24,633,776 | 21,920,428 | 25,238,978 | 30,193,132 | 35,443,200 | 27,555,630 |
| Total | 76,820,510 | 77,550,511 | 93,605,275 | 73,845,446 | 96,437,428 | 82,396,568 | 87,321,083 | 81,682,681 |
There was an increase of $4.8 million in actual spending during 2015–16 compared to planned spending. This is mainly due to increased stakeholder engagement for the NEB’s National Engagement Initiative, safety and environmental protection activities, development and implementation of the Operations Regulatory Compliance Application (ORCA), as well as the development of new governance tools to support the NEB’s strategic outcome.
The NEB’s total spending authority increased to $96.4 million from planned spending of $77.5 million in 2015–16. This increase stems from Budget 2015 which foresaw an increase of $80 million to the appropriations of the NEB for safety and environmental protection and engagement with Canadians. This funding is divided over five years and approximately $18.1 million (23%) was allocated to 2015–2016.
The $18.1 million was only available to the NEB very late in the fiscal year (March 2016), because Parliament voted the funds later than usual due to the federal election in October 2015. This further delayed the actual receipt of the funding by the NEB and as a result only $5.9 million of the funds could be used. A small organization like the NEB needs lead time to spend such extensive increases in a timely fashion, as it has little flexibility to risk-manage large amounts of spending without Parliamentary
authorization.
While the NEB had total authorities of $96.4 million, actual spending was $82.4 million which resulted in a lapse of $14 million as follows:
- $12.2 million attributed to late Parliamentary authorization of Budget 2015 funding; and
- Approximately $5 million resulted from delays beyond the control of the NEB for major applications (Energy East and Imperial).
These lapses were partially offset by $3.2 million which was absorbed for eligible paylist and collective bargaining amounts. Despite the total lapse of $14 million, the NEB was able to deliver on all programs.
FTEs and associated salaries from Legal Services and Communications Business Unit were part of planned spending in the Energy Regulation Program in the 2015–16 RPP, however these FTEs were moved into Internal Services and thus account for the variance between actual and planned spending.
Departmental Spending Trend
Text description of this graph
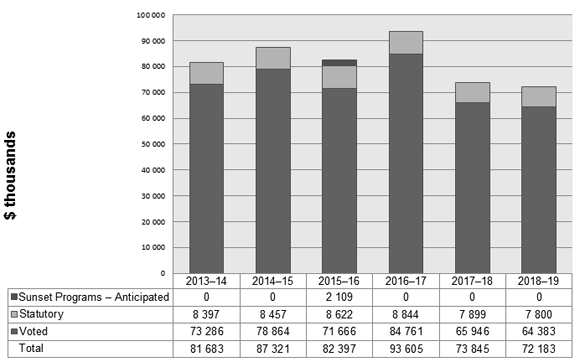
Departmental Spending Trend Graph
This bar graph shows the National Energy Board’s planned and actual spending for the fiscal years 2013–14 to 2018–19.
Total Spending and planned spending by period is as follows:
- 2013–14: $81.7 million
- 2014–15: $87.3 million
- 2015–16: $82.4 million
- 2016–17: $93.6 million
- 2017–18: $73.8 million
- 2018–19: $72.2 million
The Spending Trend Graph shows the NEB’s actual spending (2013–14 through 2015–16) and planned spending (2016–17 through 2018–19).
The NEB’s expenditures in 2015–16 show a decrease of $4.9 million from the prior fiscal year, due to the difference in increased spending in some areas and decreased spending in others, primarily in the following:
- Increased salaries ($2.2 million);
- Increased cost of Information Technology services ($1.3 million) mainly related to: stakeholder engagement initiatives; safety and environmental protection; the implementation of government-wide systems such as Phoenix, the pay system; My GCHR, the Human Resource Information Technology application; Canada.ca; and Open Government;
- A decrease in the amount of severance termination benefits paid out the previous year due to the elimination of the employee severance pay program in 2014–15 ($4.6 million);
- Decreased costs associated with the move to a new office in Calgary ($3.4 million); and
- Decreased costs for general goods and services such as training, and hospitality ($0.4 million).
2017–18 planned spending is $19.8 million less than 2016–17 planned spending. This is mainly due to:
- The expiration of temporary funding from Treasury Board Submissions 2012 and 2014 at the end of 2016–17 ($5.7 million) that was for NEB safety and security programs as well as public awareness;
- The expiration of temporary funding for Mega Projects, the majority of which expires at the end of 2016–17 ($6.4 million);
- Decreased funding for the Operating and Maintenance portion of Budget 2015 which was front-end loaded with contracting and training to ramp-up initiatives related to safety and environmental protection and engaging with Canadians ($4.0 million); and
- Decreased funding for operational budget carry forward from 2016–17 to 2017–18 as it is expected the NEB’s full appropriation will be spent in 2016–17 ($3.3 million).
Approximately 95 percent of the NEB’s appropriations are recovered from regulated companies and monies go directly to the Consolidated Revenue Fund by virtue of the National Energy Board Cost Recovery Regulations, enacted pursuant to Section 24.1(1) of the National Energy Board Act. The NEB does not have the authority to unilaterally raise its ratio for cost recovery from regulated companies. Parliament would make that decision.
The NEB does not currently recover costs related to its work under the Canada Oil and Gas Operations Act (COGOA) and the Canada Petroleum Resources Act, which currently represent about 5 percent of the NEB’s operating costs. The Energy Safety and Security Act, which came into force on 26 February 2016, allows the Governor in Council to make regulations to recover costs from COGOA-regulated companies.
Expenditures by Vote
For information on the National Energy Board’s organizational voted and statutory expenditures, consult the Public Accounts of Canada 2016.
Alignment of Spending With the Whole-of-Government Framework
| Program | Spending Area | Government of Canada Outcome | 2015–16 Actual Spending |
|---|---|---|---|
| 1.1 Energy Regulation | Economic affairs | Strong economic growth | 43,185,092 |
| 1.2 Energy Information | Economic affairs | Strong economic growth | 9,018,344 |
| Spending Area | Total Planned Spending | Total Actual Spending |
|---|---|---|
| Economic Affairs | 58,253,788 | 52,203,436 |
| Social Affairs | 0 | 0 |
| International Affairs | 0 | 0 |
| Government Affairs | 0 | 0 |
Financial Statements and Financial Statements Highlights
Financial Statements
The NEB’s Financial Statements can be found on the NEB’s website.
Financial Statements Highlights
The National Energy Board operates on a full accrual accounting basis according to Treasury Board’s policy for reporting based on generally accepted accounting principles (GAAP). The tables below provide highlights from the NEB’s Statement of Operations and Statement of Financial Position, as presented in its 2015–16 financial statements. As such, differences do exist between these tables and those presented in other sections of the Departmental Performance Report, which are prepared on the modified cash basis of accounting.
| Financial Information | 2015–16 Planned Results |
2015–16 Actual |
2014–15 Actual |
Difference (2015–16 actual minus 2015–16 planned) |
Difference (2015–16 actual minus 2014–15 actual) |
|---|---|---|---|---|---|
| Total expenses | 91,503,211 | 98,624,642 | 90,281,795 | 7,121,431 | 8,342,847 |
| Total revenues | - | - | - | - | - |
| Net cost of operations before government funding and transfers |
91,503,211 | 98,624,642 | 90,281,795 | 7,121,431 | 8,342,847 |
The variance between 2015–16 actual and planned expenditures is primarily due to additional funding received (Budget 2015) in the fourth quarter of 2015–16 to cover expenses related to safety and environmental protection, and enhancing engagement with Canadians.
The significant increase in actual expenditures from the previous year is primarily due to an increase in transfer payments for the Participant Funding Program ($2.2 million); an increase in salaries mainly related to hiring FTEs under Budget 2015 for safety and environmental protection and enhanced engagement with Canadians ($4.2 million), an increase in amortization mainly related to a leasehold improvement to the new office in Calgary ($1.3 million) and an increase in professional services mainly related to central initiatives, change management and the hearing process ($3.2 million). At the same time there was a decrease in the relocation costs to a new office within Calgary ($2.6 million).
| Financial Information | 2015–16 | 2014–15 | Difference (2015–16 minus 2014–15) |
|---|---|---|---|
| Total net liabilities | 19,031,783 | 28,439,130 | (9,407,347) |
| Total net financial assets | 13,189,146 | 11,847,875 | 1,341,271 |
| Departmental net debt | 5,843,637 | 16,591,255 | (10,747,618) |
| Total non-financial assets | 22,873,096 | 24,928,416 | (2,055,320) |
| Departmental net financial position | 17,029,459 | 8,337,161 | 8,692,298 |
Total net liabilities and Departmental net debt have a decrease of $9.4 million and $10.7 million, respectively. Overall Departmental net financial position has improved by $8.7 million. This is mainly due to adjustment of a levy under the Section 5.2(1) of the National Energy Board Recovery Regulations that was invoiced for levies and collected from newly regulated parties in 2014–15. In 2014–15, there were payables of $11 million, representing levies collected from newly regulated parties. These amounts reduced the cost recovery levies of the other regulated parties and were recorded as payable to these parties until this adjustment was made in the year after the Section 5.2(1) levy had been invoiced.
- Date modified: