Canada Energy Regulator – 2022–23 Departmental Results Report – Spending and human resources
Spending
Spending 2020–21 to 2025–26
The following graph presents planned (voted and statutory spending) over time.
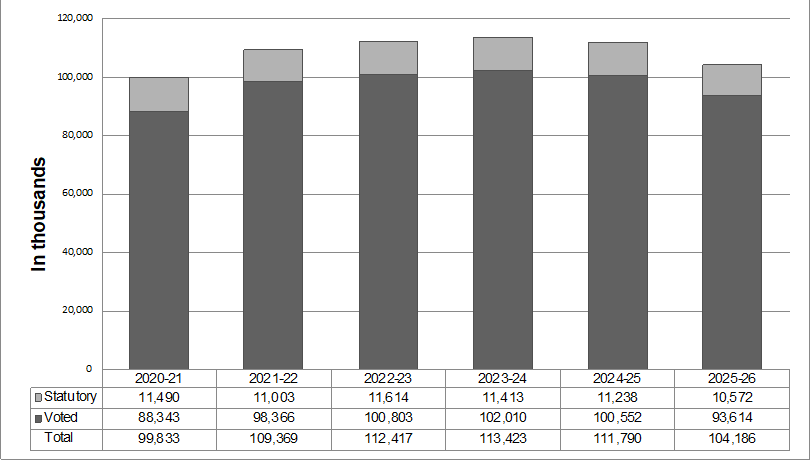
Graphic description
Departmental Spending 2020–21 to 2025–26 (In thousands)
This bar chart shows the Canada Energy Regulator's six year (voted and statutory) spending trend.
2020–21 Statutory: 11,490
2020–21 Voted: 88,343
2020–21 Total: 99,833
2021–22 Statutory: 11,003
2021–22 Voted: 98,366
2021–22 Total: 109,369
2022–23 Statutory: 11,614
2022–23 Voted: 100,803
2022–23 Total: 112,417
2023–24 Statutory: 11,413
2023–24 Voted: 102,010
2023–24 Total: 113,423
2024–25 Statutory: 11,238
2024–25 Voted: 100,552
2024–25 Total: 111,790
2025-26 Statutory: 10,572
2024–25 Voted: 93,614
2024–25 Total: 104,186
The CER is funded through Parliamentary appropriations. The Government of Canada currently recovers the majority (98.6%) of the appropriation from the industry the CER regulates. All collections from cost recovery invoices are deposited to the account of the Receiver General for Canada and credited to the Consolidated Revenue Fund.
Pipeline and power line companies that hold authorizations under the Canadian Energy Regulator Act are subject to cost recovery. Applications before the CER for new facilities are not subject to cost recovery until the facility is placed into service, unless the company does not have any prior facilities regulated by the CER in which case a one-time levy is assessed following the authorization of construction.
Cost recovery is carried out on a calendar year basis.
Budgetary performance summary for core responsibilities and internal services (dollars)
The “Budgetary performance summary for core responsibilities and internal services” table presents the budgetary financial resources allocated for Canada Energy Regulator’s core responsibilities and for internal services.
Core responsibilities and internal services |
2022–23 |
2022–23 |
2023–24 |
2024–25 |
2022–23 |
2020–21 |
2021–22 |
2022–23 |
|---|---|---|---|---|---|---|---|---|
Energy Adjudication |
18,753,370 |
18,753,370 |
27,016,679 |
26,705,288 |
22,605,484 |
20,864,381 |
17,722,847 |
23,732,083 |
Safety and Environment Oversight |
23,618,055 |
23,618,055 |
23,671,971 |
23,087,801 |
26,946,258 |
23,152,134 |
24,544,585 |
25,420,546 |
Energy Information |
6,919,278 |
6,919,278 |
8,607,939 |
8,607,939 |
9,094,696 |
5,934,378 |
8,716,482 |
7,502,034 |
Engagement |
9,262,659 |
9,262,659 |
10,149,308 |
9,413,045 |
10,747,904 |
9,611,208 |
8,732,565 |
8,463,770 |
Subtotal |
58,553,362 |
58,553,362 |
69,445,897 |
67,814,073 |
69,394,342 |
59,562,101 |
59,716,479 |
65,118,433 |
Internal services |
41,713,697 |
41,713,697 |
43,976,647 |
43,976,306 |
48,748,266 |
39,028,902 |
49,652,874 |
47,298,542 |
Internal Services |
|
|
|
|
|
1,241,925 |
|
|
Total |
100,267,059 |
100,267,059 |
113,422,544 |
111,790,379 |
118,142,608 |
99,832,928 |
109,369,353 |
112,416,975 |
Variance between 2020–21 Actual spending and 2021–22 Actual spending
The 2021–22 actual spending is $9.54 million higher than the 2020–21 actual spending, and the variance is primarily due to:
- an increase of $4.58 million related to compensation adjustments to reflect changes to terms and conditions of service or employment in the federal public administration;
- an increase of $2.98 million mainly related to a Budget 2020 initiative to improve the CER’s ability to interpret and make data available digitally to Canadians;
- an increase of $2.10 million related to a Budget 2018 initiative to transition to new impact assessment and regulatory processes;
- an increase of $0.76 million related to employee benefit plan costs;
- an increase of $0.29 million mainly related to the SAP implementation project;
- an increase of $0.07 million related to Budget 2017 Indigenous Advisory and Monitoring Committees as well as communications and access to information capacity; and
- a decrease of $1.24 million mainly related to the remission of a levy to Vector Pipeline Limited Partnership in fiscal year 2020–21.
Variance between 2021–22 Actual spending and 2022–23 Actual spending
The 2022–23 actual spending is $3.05 million higher than the 2021–22 actual spending, and the variance is primarily due to:
- an increase of $6.49 million related to a Budget 2022 funding for regulatory renewal activities including Indigenous engagement and net-zero modelling; as well as funding to implement the Impact Assessment Act;
- an increase of $1.67 million related to other compensation adjustments including changes to terms and conditions of service or employment in the federal public administration;
- an increase of $0.61 million related to 2022–23 employee benefit plan costs;
- a decrease of $0.96 million related to Budget 2017 Indigenous Advisory and Monitoring Committees as well as communications and access to information capacity;
- a decrease of $1.29 million related to a Budget 2018 initiative to transition to new impact assessment and regulatory processes;
- a decrease of $1.41 million mainly related to a Budget 2020 initiative to improve the CER’s ability to interpret and make data available digitally to Canadians; and
- a decrease of $2.06 million mainly related to SAP implementation project.
Variance between 2022–23 Planned spending and 2022–23 Actual spending
The 2022–23 actual spending is $12.15 million higher than the 2022–23 planned spending, and the variance is primarily due to:
- an increase of $7.26 million related to a Budget 2022 funding for regulatory renewal activities including Indigenous engagement and net-zero modelling; as well as funding to implement the Impact Assessment Act;
- an increase of $5.94 million related to other compensation adjustments including changes to terms and conditions of service or employment in the federal public administration;
- an increase of $1.51 million related to 2022–23 employee benefit plan costs;
- a decrease of $0.29 million mainly related to a Budget 2020 initiative to improve the CER’s ability to interpret and make data available digitally to Canadians; and
- a decrease of $2.27 million related to a Budget 2018 initiative to transition to new impact assessment and regulatory processes.
Variance between 2022–23 Total authorities available for use and 2022–23 Actual spending
The 2022–23 actual spending is $5.73 million lower than the 2022–23 total authorities, and the variance is primarily due to:
- an increase of $4.16 million related to other compensation adjustments including changes to terms and conditions of service or employment in the federal public administration;
- a decrease of $0.29 million mainly related to a Budget 2020 initiative to improve the CER’s ability to interpret and make data available digitally to Canadians;
- a decrease of $2.27 million related to a Budget 2018 initiative to transition to new impact assessment and regulatory processes; and
- a decrease of $7.33 million related to a Budget 2022 funding for regulatory renewal activities including Indigenous engagement and net-zero modelling; as well as funding to implement the Impact Assessment Act.
Variance between 2022–23 Total authorities available for use and 2022–23 Planned spending
The 2022–23 total authorities is $17.88 million higher than the 2022–23 planned spending, and the variance is primarily due to:
- an increase of $14.59 million related to a Budget 2022 funding for regulatory renewal activities including Indigenous engagement and net-zero modelling; as well as funding to implement the Impact Assessment Act;
- an increase of $1.94 million related to retroactive payments as a result of collective agreement renewal;
- an increase of $1.88 million related to operating budget carry forward from 2021–22 to 2022–23;
- an increase of $0.42 million mainly related to other compensation adjustments including
- changes to terms and conditions of service or employment of the federal public administraton; and
- a decrease of $0.95 million related 2022–23 employee benefit plan costs.
Variance between 2023–24 Planned spending and 2022–23 Planned spending
The 2023–24 planned spending is $13.16 million higher than the 2022–23 planned spending, and the variance is primarily due to:
- an increase of $10.02 million related to a Budget 2022 funding for regulatory renewal activities including Indigenous engagement and net-zero modelling; as well as funding to implement the Impact Assessment Act;
- an increase of $2.57 million related to a Budget 2020 initiative to improve the CER’s ability to interpret and make data available digitally to Canadians;
- an increase of $1.71 million related to a Budget 2018 initiative to transition to new impact assessment and regulatory processes;
- an increase of $1.31 million related to employee benefit plans; and
- a decrease of $2.45 million mainly related to compensation adjustments to reflect changes to terms and conditions of service or employment in the federal public administration.
Variance between 2023–24 Planned spending and 2024–25 Planned spending
The $1.63 million reduction in 2024–25 planned spending compared to 2023–24 planned spending is primarily related to Budget 2022 Indigenous Advisory and Monitoring Committees.
Human resources
The “Human resources summary for core responsibilities and internal services” table presents the full-time equivalents (FTEs) allocated to each of Canada Energy Regulator’s core responsibilities and to internal services.
Human resources summary for core responsibilities and internal services
Core responsibilities and internal services |
2020–21 |
2021–22 |
2022–23 |
2022–23 |
2023–24 |
2024–25 |
|---|---|---|---|---|---|---|
Energy Adjudication |
129.4 |
104.1 |
101.5 |
121.4 |
126.5 |
124.5 |
Safety and Environment Oversight |
142.5 |
150.7 |
132.5 |
137.7 |
135.0 |
131.0 |
Energy Information |
30.4 |
48.2 |
33.1 |
41.6 |
56.1 |
56.1 |
Engagement |
56.9 |
51.4 |
46.1 |
44.9 |
51.1 |
48.1 |
Subtotal |
359.2 |
354.4 |
313.2 |
345.5 |
368.7 |
359.7 |
Internal Services |
162.4 |
204.3 |
176.8 |
225.7 |
188.3 |
187.3 |
Total |
521.6 |
558.7 |
490.0 |
571.2 |
557.0 |
547.0 |
Variance between 2020–21 Actual full-time equivalents and 2021–22 Actual full-time equivalents
The increase of 37.1 full-time equivalents from 2020–21 actual full-time equivalents to 2021–22 actual full-time equivalents is primarily due to:
- an increase of 19.0 full-time equivalents related to changes across the organization to meet operational requirements;
- an increase of 14.9 full-time equivalents related to a Budget 2020 initiative to improve the CER’s ability to interpret and make data available digitally to Canadians;
- an increase of 4.3 full-time equivalents related to a Budget 2018 initiative to transition to new impact assessment and regulatory processes; and
- a decrease of 1.1 full-time equivalents related to Budget 2017 Indigenous Advisory and Monitoring Committees.
Variance between 2021–22 Actual full-time equivalents and 2022–23 Actual full-time equivalents
The increase of 12.5 full-time equivalents from 2021–22 actual full-time equivalents to 2022–23 actual full-time equivalents is primarily due to:
- an increase of 40.1 full-time equivalents related to a Budget 2022 funding for regulatory renewal activities including Indigenous engagement and net-zero modelling; as well as funding to implement the Impact Assessment Act;
- a decrease of 5.4 full-time equivalents related to Budget 2017 Indigenous Advisory and Monitoring Committees;
- a decrease of 5.8 full-time equivalents related to a Budget 2018 initiative to transition to new impact assessment and regulatory processes;
- a decrease of 6.1 full-time equivalents related to changes across the organization to meet operational requirements; and
- a decrease of 10.3 full-time equivalents related to a Budget 2020 initiative to improve the CER’s ability to interpret and make data available digitally to Canadians.
Variance between 2022–23 Planned full-time equivalents and 2022–23 Actual full-time equivalents
The increase of 81.2 full-time equivalents from 2022–23 actual full-time equivalents to 2022–23 planned full-time equivalents is primarily due to:
- an increase of 43.2 full-time equivalents related to changes across the organization to meet operational requirements;
- an increase of 40.1 full-time equivalents related to a Budget 2022 funding for regulatory renewal activities including Indigenous engagement and net-zero modelling; as well as funding to implement the Impact Assessment Act;
- an increase of 3.3 full-time equivalents related to a Budget 2020 initiative to improve the CER’s ability to interpret and make data available digitally to Canadians; and
- a decrease of 5.4 full-time equivalents related to a Budget 2018 initiative to transition to new impact assessment and regulatory processes;
Variance between 2022–23 Planned full-time equivalents and 2023–24 Planned full-time equivalents
The increase of 67.0 full-time equivalents from 2022–23 planned full-time equivalents to 2023–24 planned full-time equivalents is primarily due to:
- an increase of 38.0 full-time equivalents related to a Budget 2022 funding for regulatory renewal activities including Indigenous engagement and net-zero modelling; as well as funding to implement the Impact Assessment Act;
- an increase of 15.0 full-time equivalents related to a Budget 2018 initiative to transition to new impact assessment and regulatory processes;
- an increase of 14.7 full-time equivalents related to a Budget 2020 initiative to improve the CER’s ability to interpret and make data available digitally to Canadians; and
- a decrease of 0.7 full-time equivalents related to changes across the organization to meet operational requirements.
Variance between 2023–24 Planned full-time equivalents and 2024–25 Planned full-time equivalents
The decrease of 10 2024–25 planned full-time equivalents from 2023–24 planned fulltime equivalents is primarily related to Budget 2017 Indigenous Advisory and Monitoring Committees.
Expenditures by vote
For information on the Canada Energy Regulator’s organizational voted and statutory expenditures, consult the Public Accounts of Canada.
Government of Canada spending and activities
Information on the alignment of the Canada Energy Regulator’s spending with Government of Canada’s spending and activities is available in GC InfoBase.
Financial statements and financial statements highlights
Canada Energy Regulator’s financial statements (unaudited) for the year ended March 31, 2023, are available on the department’s website
Financial statements
Condensed Statement of Operations (unaudited) for the year ended March 31, 2023 (dollars)
Financial information |
2022–23 |
2022–23 |
2021–22 |
Difference |
Difference |
|---|---|---|---|---|---|
Total expenses |
118,101,482 |
131,032,419 |
124,893,316 |
12,930,937 |
6,139,103 |
Total revenues |
– |
– |
– |
– |
– |
Net cost of operations before government funding and transfers |
118,101,482 |
131,032,419 |
124,893,316 |
12,930,937 |
6,139,103 |
The 2022–23 planned results information is provided in Canada Energy Regulator’s Future-Oriented Statement of Operations and Notes 2022–23.
The actual net cost of operations before government funding and transfers in 2022–23 was $12.93 million higher than the planned results for the same fiscal year. The net increase is primarily due to:
- an increase of $7.26 million related to a Budget 2022 funding for regulatory renewal activities including Indigenous engagement and net-zero modelling; as well as funding to implement the Impact Assessment Act;
- an increase of $6.01 million related to other compensation adjustments including changes to terms and conditions of service or employment in the federal public administration.
- an increase of $1.51 million related to 2022–23 employee benefit plan costs;
- a decrease of $0.29 million mainly related to a Budget 2020 initiative to improve the CER’s ability to interpret and make data available digitally to Canadians;
- a decrease of $2.27 million related to a Budget 2018 initiative to transition to new impact assessment and regulatory processes; and
- a net increase of $0.71 million related to professional services, information and technology hardware updates.
The actual net cost of operations before government funding and transfers in 2022–23 was $6.14 million higher than the actual results for the previous fiscal year. The net increase is primarily due to:
- an increase of $6.49 million related to a Budget 2022 funding for regulatory renewal activities including Indigenous engagement and net-zero modelling; as well as funding to implement the Impact Assessment Act;
- an increase of $0.61 million related to 2022–23 employee benefit plan costs;
- an increase of $0.48 million related to other compensation adjustments including changes to terms and conditions of service or employment in the federal public administration;
- a decrease of $0.96 million related to Budget 2017 Indigenous Advisory and Monitoring Committees as well as communications and access to information capacity;
- a decrease of $1.29 million related to a Budget 2018 initiative to transition to new impact assessment and regulatory processes;
- a decrease of $1.41 million mainly related to a Budget 2020 initiative to improve the CER’s ability to interpret and make data available digitally to Canadians; and
- a net increase of $2.22 million mainly related to the net reduction in capitalized expenses for IT software development.
Condensed Statement of Financial Position (unaudited) as of March 31, 2023 (dollars)
Financial information |
2022–23 |
2021–22 |
Difference |
|---|---|---|---|
Total net liabilities |
27,532,639 |
23,228,677 |
4,303,962 |
Total net financial assets |
14,456,611 |
10,456,480 |
4,000,131 |
Departmental net debt |
13,076,028 |
12,772,197 |
303,831 |
Total non-financial assets |
9,688,687 |
13,078,019 |
(3,389,332) |
Departmental net financial position |
(3,387,341) |
305,822 |
(3,693,163) |
Departmental net financial position in 2022–23 decreased by $3.69 million, in comparison to 2021–22. The difference is mainly due to a decrease in tangible capital assets and an increase in employee future benefits.
The 2022–23 planned results information is provided in Canada Energy Regulator’s Future-Oriented Statement of Operations and Notes 2022–23.
- Date modified: