ARCHIVED – Canada Energy Regulator – 2020–21 Departmental Plan
This page has been archived on the Web
Information identified as archived is provided for reference, research or recordkeeping purposes. It is not subject to the Government of Canada Web Standards and has not been altered or updated since it was archived. Please contact us to request a format other than those available.
Spending and human resources
Planned spending
Departmental spending 2017–18 to 2022–23
The following graph presents planned (voted and statutory) spending over time.
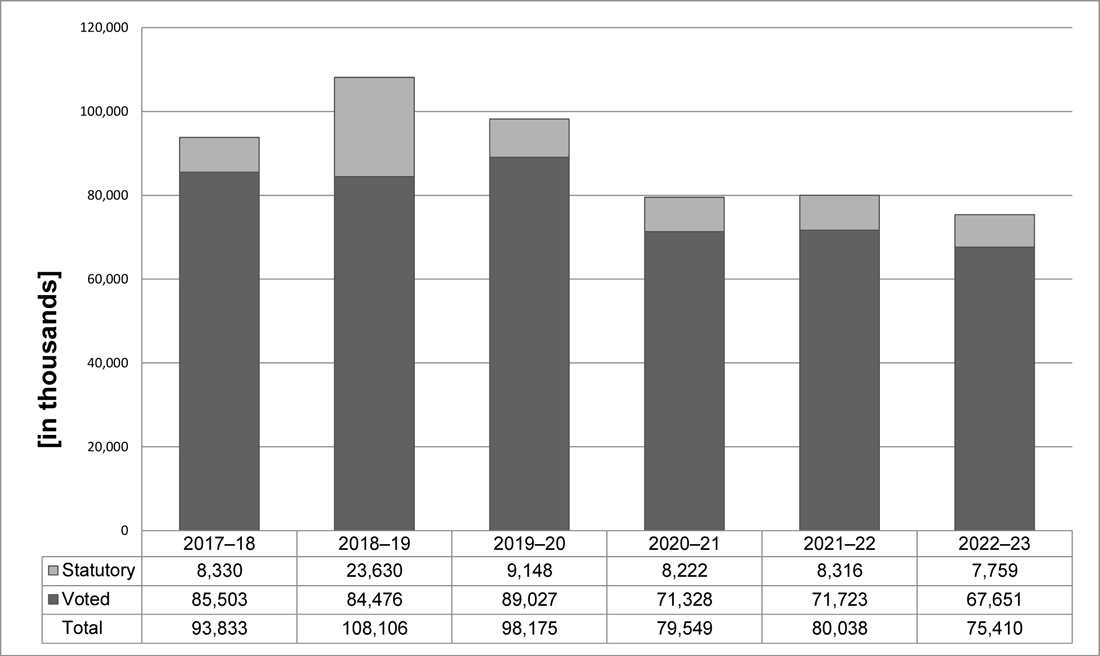
Description of this graph
Departmental Spending 2017–18 to 2022–23
This bar chart shows the Canada Energy Regulator’s six-year spending trend. It includes actual spending for the fiscal years 2017–18 and 2018–19, forecast spending for the year 2019–20 and planned spending for the years 2020–21 to 2022–23.
Actual Spending by period is as follows:
- 2017–18: $93,833
- 2018–19: $108,106
Forecast Spending by period is as follows:
- 2019–20: $98,175
Planned Spending by period is as follows:
- 2020–21: $79,549
- 2021–22: $80,038
- 2022–23: $75,410
Budgetary planning summary for core responsibilities and Internal Services (dollars)
The following table shows actual, forecast and planned spending for each of the CER’s core responsibilities and to Internal Services for the years relevant to the current planning year.
| Core Responsibilities and Internal Services | 2017–18 expendituresTable Note a |
2018–19 expendituresTable Note a |
2019–20 forecast spendingTable Note b |
2020–21 budgetary spending (as indicated in Main Estimates) |
2020–21 planned spending |
2021–22 planned spending |
2022–23 planned spending |
|---|---|---|---|---|---|---|---|
| Energy Adjudication | 24,293,849 | 23,372,250 | 21,240,882 | 19,870,310 | 19,870,310 | 20,094,039 | 19,380,574 |
| Safety and Environment Oversight | 23,004,346 | 22,648,545 | 24,616,508 | 17,875,000 | 17,875,000 | 18,449,404 | 16,228,045 |
| Energy Information | 10,444,458 | 9,554,137 | 8,840,227 | 4,459,939 | 4,459,939 | 4,554,897 | 4,466,668 |
| Engagement | 4,898,235 | 5,811,773 | 11,173,666 | 7,898,891 | 7,898,891 | 7,843,943 | 7,006,488 |
| Subtotal | 62,640,888 | 61,386,705 | 65,871,283 | 50,104,140 | 50,104,140 | 50,942,283 | 47,081,775 |
| Internal Services | 31,192,102 | 32,009,262 | 32,304,156 | 29,445,190 | 29,445,190 | 29,096,036 | 28,328,705 |
| Internal Services – GIC Remission LevyTable Note c | 0 | 14,710,000 | 0 | 0 | 0 | 0 | 0 |
| Total | 93,832,990 | 108,105,967 | 98,175,439 | 79,549,330 | 79,549,330 | 80,038,319 | 75,410,480 |
An increase of $14.3 million from 2017–18 expenditures to 2018–19 expenditures is primarily due to:
- an increase of $14.7 million related to Governor in Council’s remission of levy to the Northern Gateway Pipeline project;
- an increase of $2.6 million Participant Funding Program mainly related to Trans Mountain Expansion Project Reconsiderations as well as Budget 2018 Transition to New Impact Assessment and Regulatory Processes;
- a net decrease of $1.3 million mainly for communication and professional services; and
- a net decrease of $1.7 million personnel costs as a result of collective agreement renewal signed in 2017–18.
A decrease of $9.93 million from 2018–2019 expenditures to 2019–20 forecasting spending is primarily due to the following:
- a decrease of $14.71 million related to a levy remission to Northern Gateway Pipelines Limited;
- a decrease of $1.14 million related to Trans Mountain Expansion Project Reconsiderations;
- an increase of $3.67 million related to Budget 2019 Canada Energy Regulator Transition Costs; and
- a net increase of $2.25 million mainly related to Budget 2018 transition to new impact assessment and regulatory processes.
The 2020–21 planned spending is $18.63 million lower than the 2019–20 forecast spending primarily due to:
- a decrease of $13.3 million related to Budget 2015 Energy Transportation Infrastructure;
- a decrease of $5.3 million related to Budget 2017 Pipeline Safety Lifecycle Oversight;
- a decrease of $0.6 million related to Budget 2017 Communication and Access to Information Capacity;
- a decrease of $3.7 million related to Budget 2019 Canada Energy Regulator transition costs;
- a decrease of $0.34 million related to Budget 2017 Indigenous Advisory and Monitoring Committee;
- a decrease of $0.24 million related to Budget 2018 transition to new impact assessment and regulatory processes;
- a decrease of $0.22 million related to Trans Mountain Expansion Project Reconsiderations;
- a decrease of $3.2 million related to Operating Budget Carry Forward; and
- a decrease of $2.08 million related to employee benefit plan; and
- an increase of $10.35 million related to compensation adjustments made to terms and conditions of service or employment of the federal public administration.
The 2022–23 planned spending is $4.6 million lower than the 2021–22 planned spending primarily due to:
- a decrease of $1.7 million in funding related to Budget 2017 Indigenous Advisory and Monitoring Committees;
- a decrease of $1.0 million in funding related to Budget 2018 transition to new impact assessment and regulatory processes; and
- a decrease of $1.9 million related to compensation adjustments made to terms and conditions of service or employment of the federal public administration.
The CER will be seeking renewal of this temporary funding in future budgets. If the funding is not renewed, the organization would need to make adjustments to its programs and expected results.
The CER is funded through parliamentary appropriations. The Government of Canada recovers approximately 98 percent of the appropriation from the industry the CER regulates. All collections from cost recovery invoices are deposited to the account of the Receiver General for Canada credited to the Consolidated Revenue Fund.
Pipeline and power line companies regulated by the CER (authorized under the CER Act) are subject to cost recovery. Applications before the CER or new facilities are not subject to cost recovery until the facility is placed into service, unless the company does not have any prior facilities regulated by the CER in which case a one-time levy is assessed following the authorization of construction.
Cost recoveryFootnote 27 is carried out on a calendar year basis.
Planned human resources
The following table shows actual, forecast and planned full-time equivalents (FTEs) for each core responsibility in the CER’s departmental results framework and to Internal Services for the years relevant to the current planning year.
Human resources planning summary for core responsibilities and Internal Services
| Core Responsibilities and Internal Services | 2017–18 actual full-time equivalentsTable Note a |
2018–19 actual full-time equivalentsTable Note a |
2019–20 forecast full-time equivalentsTable Note b |
2020–21 planned full-time equivalents |
2021–22 planned full-time equivalents |
2022–23 planned full time equivalents |
|---|---|---|---|---|---|---|
| Energy Adjudication | 125.8 | 103.9 | 119.3 | 108.2 | 108.5 | 106.8 |
| Safety and Environment Oversight | 124.5 | 120.2 | 161.0 | 114.0 | 114.3 | 103.3 |
| Energy Information | 55.5 | 47.8 | 33.9 | 29.0 | 29.1 | 29.2 |
| Engagement | 24.0 | 34.0 | 26.1 | 39.3 | 39.4 | 35.0 |
| Subtotal | 329.7 | 305.9 | 340.3 | 290.5 | 291.3 | 274.3 |
| Internal Services | 151.6 | 170.6 | 168.7 | 162.5 | 161.7 | 162.7 |
| Total | 481.3 | 476.5 | 509.0 | 453.0 | 453.0 | 437.0 |
The increase in planned full-time equivalents from 2018–19 to 2019–20 is due to Budget 2018 Modernization funding in hiring technical specialists to assist the organization to implement the proposed CER Act.
The decrease of 16 full-time equivalents from 2022–23 planned full-time equivalents in comparison to the 2021–22 planned full-time equivalents is mainly attributed to the:
- decrease of 10 full-time equivalents related to Budget 2017 Indigenous Advisory and Monitoring Committees for energy infrastructure projects; and
- decrease of 6 full-time equivalents related to Budget 2018 Transition to new impact assessment and regulatory processes.
Estimates by vote
Information on the CER’s organizational appropriations is available in the 2020–21 Main EstimatesFootnote 28.
Condensed future-oriented statement of operations
The condensed future-oriented statement of operations provides an overview of the CER’s operations for 2019–20 to 2020–21.
The amounts for forecast and planned results in this statement of operations were prepared on an accrual basis. The amounts for forecast and planned spending presented in other sections of the Departmental Plan were prepared on an expenditure basis. Amounts may therefore differ.
A more detailed future-oriented statement of operations and associated notes, including a reconciliation of the net cost of operations to the requested authorities, are available on the CER’s websiteFootnote 29.
Future Oriented Condensed Statement of Operations for the year ended March 31, 2020 (dollars)
Condensed future oriented statement of operations for the year ending March 31, 2021 (dollars)
| Financial information | 2019–20 forecast resultsTable Note a |
2020–21 planned results |
Difference (2020–21 planned results minus 2019–20 forecast results) |
|---|---|---|---|
| Total expenses | 115,420,832 | 96,794,722 | (18,626,110) |
| Total revenues | 0 | 0 | 0 |
| Net cost of operations before government funding and transfers | 115,420,832 | 96 794 722 | (18,626,110) |
The CER’s planned results for 2020–21 is $18.63 million less than the 2019–20 forecast results. This is primarily due to the following items:
- a decrease of $13.3 million in funding related to Budget 2015 Energy Transportation Infrastructure;
- a decrease of $6.39 million related to Budget 2017 (Pipeline Safety Lifecycle Oversight, Communications and Access to Information Capacity and Indigenous Advisory and Monitoring Committees);
- a decrease of $3.7 million related to Budget 2019 Canada Energy Regulator Transition Costs;
- a decrease of $3.2 million related to Budget 2018–19 Operating Budget Carry Forward;
- an increase of $7.27 million related to compensation adjustments made to terms and conditions of service or employment of the federal public administration; and
- a net increase of $0.69 million mainly related to employee benefit plan.
- Date modified: