Canada Energy Regulator – 2022–23 Departmental Plan
Planned spending and human resources
This section provides an overview of the department’s planned spending and human resources for the next three fiscal years and compares planned spending for 2022–23 with actual spending for the current year and the previous year.
Planned spending
Departmental spending 2019–20 to 2024–25
The following graph presents planned spending (voted and statutory expenditures) over time.
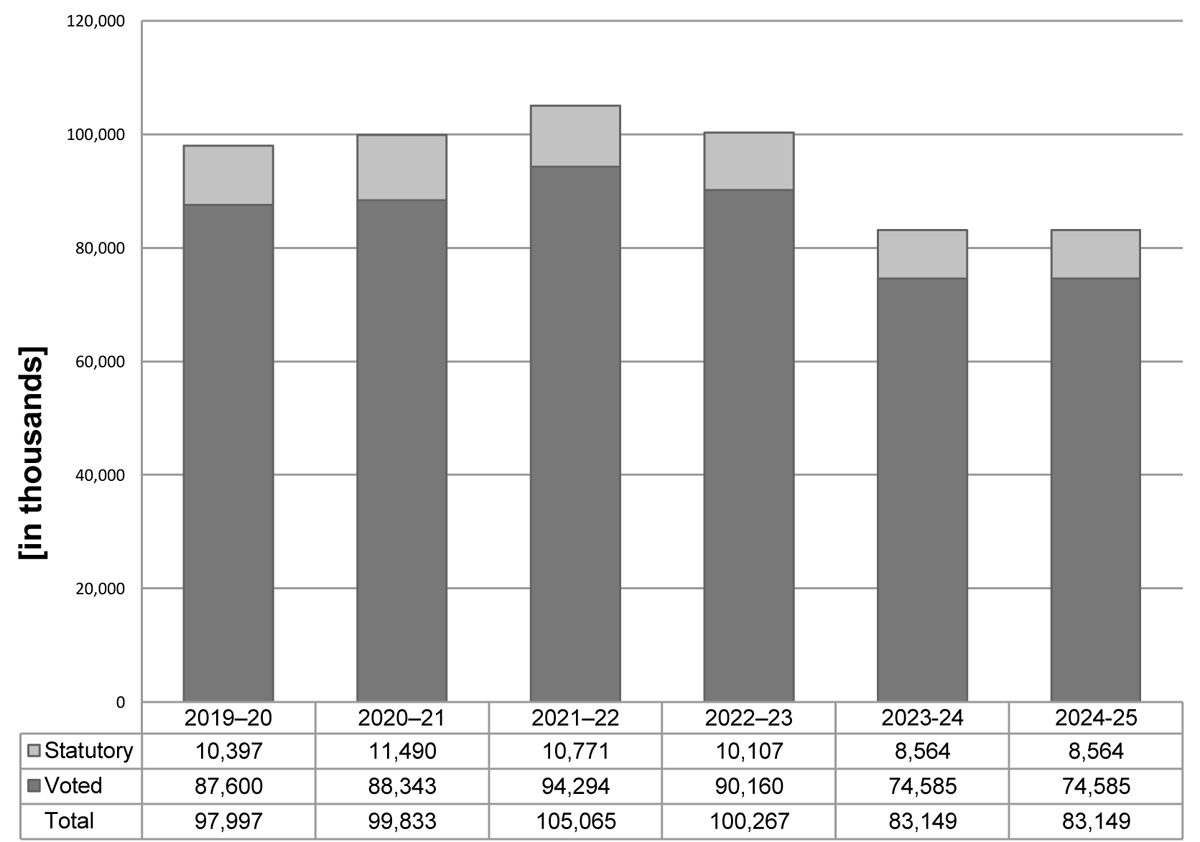
Description of this graph
Departmental spending 2019–20 to 2024–25
This bar chart shows the Canada Energy Regulator’s six-year spending trend. It includes actual spending for the fiscal years 2019–20, 2020–21 and 2021–22, forecast spending for the year 2022–23 and planned spending for the years 2023–24 to 2024–25.
Actual Spending by period is as follows:
- 2019–20: $97,997
- 2020–21: $99,833
- 2021–22: $105,065
Forecast Spending by period is as follows:
- 2022–23: $100,267
Planned Spending by period is as follows:
- 2023–24: $83,149
- 2024–25: $83,149
Budgetary planning summary for core responsibilities and internal services (dollars)
The following table shows information on spending for each of the CER’s core responsibilities and for its internal services for 2022–23 and other relevant fiscal years.
Core responsibilities and internal services |
2019–20 |
2020–21 |
2021–22 |
2022–23 budgetary spending |
2022–23 |
2023–24 |
2024–25 |
|---|---|---|---|---|---|---|---|
Energy Adjudication |
21,550,144 |
20,864,381 |
18,507,474 |
18,753,370 |
18,753,370 |
15,667,637 |
15,667,636 |
Safety and Environment Oversight |
24,588,408 |
23,152,134 |
23,875,399 |
23,618,055 |
23,618,055 |
21,460,856 |
21,460,858 |
Energy Information |
9,235,424 |
5,934,378 |
7,876,532 |
6,919,278 |
6,919,278 |
5,174,538 |
5,174,538 |
Engagement |
7,611,046 |
9,611,208 |
9,353,847 |
9,262,659 |
9,262,659 |
5,635,459 |
5,635,458 |
Subtotal |
62,985,022 |
59,562,101 |
59,613,252 |
58,553,362 |
58,553,362 |
47,938,490 |
47,938,490 |
Internal services |
35,011,968 |
39,028,902 |
45,451,417 |
41,713,697 |
41,713,697 |
35,210,475 |
35,210,475 |
Internal Services – GIC Remission LevyTable Note 3 |
|
1,241,925 |
|
|
|
|
|
Total |
97,996,990 |
99,832,928 |
105,064,669 |
100,267,059 |
100,267,059 |
83,148,965 |
83,148,965 |
Variance between 2019–20 actual expenditures and 2020–21 actual expenditures
The 2020–21 actual expenditures are $1.84 million higher than the 2019–20 actual expenditures mainly due to:
- a decrease of $2.33 million related to TransportationNote 4 as a result of COVID-19 restrictions;
- an increase of $1.24 million related to remission to Vector Pipeline Limited Partnership;
- an increase of $1.93 million related to information and technology hardware updates; and
- an increase of $1.0 million mainly related to the Financial System Modernization Project.
Variance between 2020–21 actual expenditures and 2021–22 forecast spending
The 2021–22 forecast spending is $5.23 million higher than the 2020–21 actual expenditures mainly due to:
- an increase of $4.91 million mainly related funding to improve the CER’s ability to interpret and make data available digitally to Canadians;
- an increase of $1.80 million related to Budget 2018 transition to new impact assessment and regulatory processes funding; and
- a decrease of $1.48 million mainly related to the remission of levy to Vector Pipeline Limited Partnership in fiscal year 2020–21.
Variance between 2021–22 forecast spending and 2022–23 planned spending
The 2022–23 planned spending is $4.80 million lower than the 2021–22 forecast spending is mainly due to:
- a decrease of $1.76 million related to Budget 2017 IAMCs funding for energy infrastructure projects;
- a decrease of $3.56 million related to funding to improve the CER’s ability to interpret and make data available digitally to Canadians;
- a decrease of $0.78 million mainly related to employee benefit plan; and
- an increase of $1.30 million related to Budget 2018 transition to new impact assessment and regulatory processes funding.
Variance between 2022–23 planned spending and 2023–24 planned spending
The 2023–24 planned spending is $17.12 million lower than the 2022–23 planned spending mainly due to:
- a decrease of $8.92 million related to Budget 2018 transition to new impact assessment and regulatory processes funding;
- a decrease of $3.72 million related to funding to improve the CER’s ability to interpret and make data available digitally to Canadians;
- a decrease of $2.94 million related to compensation adjustments made to terms and conditions of service or employment of the federal public administration; and
- a decrease of $1.54 million mainly related to employee benefit plan.
Planned human resources
The following table shows information on human resources, in full-time equivalents (FTEs), for each of the CER’s core responsibilities and for its internal services for 2022–23 and the other relevant years.
Human resources planning summary for core responsibilities and internal services
Core responsibilities and internal services |
2019–20 |
2020–21 |
2021–22 |
2022–23 |
2023–24 |
2024–25 |
|---|---|---|---|---|---|---|
Energy Adjudication |
119.2 |
129.4 |
102.9 |
101.5 |
88.5 |
88.5 |
Safety and Environment Oversight |
131.0 |
142.5 |
148.9 |
132.5 |
122 |
122 |
Energy Information |
43.8 |
30.4 |
47.6 |
33.1 |
30.1 |
30.1 |
Engagement |
37.8 |
56.9 |
50.8 |
46.1 |
28.1 |
28.1 |
Subtotal |
331.8 |
359.2 |
350.2 |
313.2 |
268.7 |
268.7 |
Internal services |
162.2 |
162.4 |
201.9 |
176.8 |
162.3 |
162.3 |
Total |
494.0 |
521.6 |
552.1 |
490.0 |
431.0 |
431.0 |
Variance between 2019–20 actual FTEs and 2020–21 actual full-time equivalents
The increase of 27.6 FTEs from 2019–20 actual to the 2020–21 actual is mainly to stabilize the CER’s operations and improve its ability to interpret and make data available digitally to Canadians.
Variance between 2020–21 actual FTEs and 2021–22 forecast full-time equivalents
The increase of 30.5 FTEs from 2020–21 actual to the 2021–22 forecast is mainly due to:
- an increase of 10 FTEs related to Budget 2018 transition to new impact assessment and regulatory processes funding; and
- an increase of 20.5 FTEs mainly related to funding to improve the CER’s ability to interpret and make data available digitally to Canadians.
Variance between 2021–22 forecast FTEs and 2022–23 planned fulltime equivalents
The decrease of 62.1 FTEs from 2021–22 forecast to the 2022–23 planned is mainly due to:
- a decrease of 10 FTEs related to Budget 2017 IAMC funding for energy infrastructure projects;
- a decrease of 6 FTEs related to Budget 2018 transition to new impact assessment and regulatory processes funding;
- a decrease of 30 FTEs related to funding to improve the CER’s ability to interpret and make data available digitally to Canadians; and
- a decrease of 16.1 FTEs related to changes in funding levels.
Variance between 2022–23 planned FTEs and 2023–24 planned fulltime equivalents
The decrease of 59 FTEs from 2022–23 planned to the 2023–24 planned is mainly due to:
- a decrease of 43 FTEs related to Budget 2018 transition to new impact assessment and regulatory processes funding; and
- a decrease of 16 FTEs related to changes in funding levels.
Estimates by vote
Information on the CER’s organizational appropriations is available in the 2022–23 Main Estimates.Footnote 34.
Future-oriented condensed statement of operations
The future oriented condensed statement of operations provides an overview of the CER’s operations for 2021–22 to 2022–23.
The forecast and planned amounts in this statement of operations were prepared on an accrual basis. The forecast and planned amounts presented in other sections of the Departmental Plan were prepared on an expenditure basis. Amounts may therefore differ.
A more detailed future oriented statement of operations and associated notes, including a reconciliation of the net cost of operations with the requested authorities, are available on the CER’s websiteFootnote 35.
Future oriented condensed statement of operations for the year ending March 31, 2023 (dollars)
Financial information |
2021–22 |
2022–23 |
Difference |
|---|---|---|---|
Total expenses |
122,876,092 |
118,101,482 |
(4,774,610) |
Total revenues |
– |
– |
– |
Net cost of operations before government funding and transfers |
122,876,092 |
118,101,482 |
(4,774,610) |
Variance between 2021–22 forecast results and 2022–23 planned results
The 2022–23 planned results are $4.80 million lower than the 2021–22 forecast results mainly due to:
- an increase of $1.30 million related to Budget 2018 transition to new impact assessment and regulatory processes funding;
- a decrease of $1.76 million related to Budget 2017 IAMCs for energy infrastructure projects funding;
- a decrease of $3.56 million related to funding to improve the CER’s ability to interpret and make data available digitally to Canadians; and
- a decrease of $0.78 million mainly related to employee benefit plan.
- Date modified: