ARCHIVED – Canadian Energy Overview 2013 - Energy Briefing Note
This page has been archived on the Web
Information identified as archived is provided for reference, research or recordkeeping purposes. It is not subject to the Government of Canada Web Standards and has not been altered or updated since it was archived. Please contact us to request a format other than those available.
ISSN 1917-506X
June 2014
Copyright/Permission to Reproduce
Preface
This is the eighth year the National Energy Board (NEB) has published the Canadian Energy Overview (CEO) which provides basic data on Canadian energy supply and markets. The 2013 CEO complements the NEB analytical report, Canadian Energy Dynamics 2013, which discusses a number of important energy developments that occurred in 2013. These products contribute to the transparency of Canadian energy markets and support Canadian energy literacy.
This year we are presenting the CEO information in a new way. We are using a web-based approach to display the tables and figures with limited narrative. This narrative is provided only in some cases, as useful context to explain the trends depicted. Additionally, text descriptions are provided for all tables and charts.
Table 1 - Key Canadian Energy and Economy Statistics
| 2012 | 2013 | % Change | |
|---|---|---|---|
| The energy industry's direct contribution to GDP (per cent) | 9.5 | 9.6 | 1.1 |
| Annual energy export revenues (billion $) | 105.1 | 111.0 | 5.7 |
| The energy industry's contribution to Canadian export revenues (per cent) | 22.7 | 23.3 | 2.6 |
| Average West Texas Intermediate (WTI) Crude Oil Price (US$ per barrel) | 94.1 | 97.9 | 4.0 |
Sources: Statistics Canada, U.S. Energy Information Administration (EIA)
Text version
This table presents statistics about Canadian energy and the Canadian economy. Between 2012 and 2013, the direct contribution of the energy industry to Gross Domestic Product (GDP) was relatively stable. Annual energy export revenues grew from 2012 to 2013 as did their share of total merchandise export revenues. The average WTI crude price was higher in 2013 than in 2012.
Figure 1 - Net Energy Export Revenues
(Billion $)
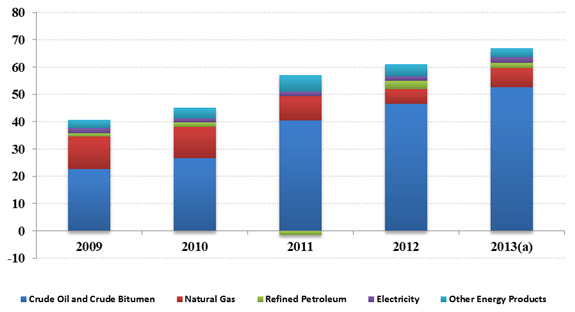
(a) Estimates
Source: Statistics Canada
Text version
This stacked bar graph illustrates net energy export revenues by energy commodity in billions of dollars from 2009 to 2013. In 2013, net energy exports totaled nearly $70 billion, led by crude oil and crude bitumen at about $55 billion, with natural gas, refined petroleum, electricity and other energy products contributing about $7 billion, $1.8 billion, $2.0 billion and $3.5 billion, respectively. Crude oil and crude bitumen have contributed the largest share to net energy export revenues in each year from 2009 to 2013 and this share has grown over time.
Table 2 - Domestic Energy Production by Energy Source (petajoules)
| 2009 | 2010 | 2011 | 2012 | 2013[a] | % Change (2012-2013) |
|
|---|---|---|---|---|---|---|
| Petroleum[b] | 6 785 | 7 090 | 7 506 | 8 057 | 8 795 | 9.2 |
| Natural gas[c] | 5 984 | 5 772 | 5 765 | 5 484 | 5 555 | 1.3 |
| Hydroelectricity | 1 314 | 1 253 | 1 339 | 1 357 | 1 396 | 2.9 |
| Nuclear Electricity | 306 | 308 | 318 | 322 | 349 | 8.4 |
| Coal | 1 382 | 1 535 | 1 524 | 1 520 | 1 593 | 4.8 |
| Wind, Tidal and Solar Electricity[d] | 24 | 32 | 37 | 42 | 33 | -19.9 |
| Other[e] | 534 | 548 | 567 | 487 | 474 | -2.7 |
| Total | 16 330 | 16 537 | 17 056 | 17 268 | 18 194 | 5.4 |
| Annual Growth | -3.9% | 1.3% | 3.1% | 1.2% | 5.4% |
[a] Estimates
[b] Petroleum includes crude oil and gas plant natural gas liquids, upgraded and non-upgraded bitumen and condensate; estimate for 2012
[c] Marketable natural gas; estimate for 2012
[d] Monthly estimates compiled for 2013 exclude smaller producers so the 2013 number may be revised upwards when annual estimates are released. See note for Table 5.
[e] Includes solid wood waste, spent pulping liquor, wood and other fuels for electricity generation; estimates
Sources: NEB, Statistics Canada, Natural Resources Canada
Text version
The table displays domestic energy production by energy source including petroleum; natural gas; hydroelectricity; nuclear electricity; coal; wind, tidal and solar electricity; and other, from 2009 to 2013. Over the period, total energy production increased each year, and reached an estimate of 18 194 petajoules in 2013. Natural gas production increased, in 2013, for the first time since 2009.
Table 3 - Domestic Secondary Energy[1] Consumption (petajoules)
| 2009 | 2010 | 2011 | 2012 | 2013[a] | % Change, (2012-2013) |
|
|---|---|---|---|---|---|---|
| Residential | 1 321 | 1 265 | 1 352 | 1 282 | 1 292 | 0.7 |
| Commercial | 1 049 | 1 027 | 1 080 | 1 044 | 1 064 | 1.9 |
| Industrial | 2 231 | 2 351 | 2 470 | 2 552 | 2 589 | 1.4 |
| Transportation | 2 531 | 2 619 | 2 598 | 2 586 | 2 666 | 3.1 |
| Total | 7 132 | 7 262 | 7 499 | 7 464 | 7 610 | 2.0 |
| Annual % Change | 1.8 | 3.3 | -0.5 | 2.0 |
[a] Note: Energy demand values for 2012 and prior are based on Statistics Canada’s Report on Energy Supply and Demand. Demand in 2013 was estimated using various monthly series available from Statistics Canada. For all years, the values shown may not match those from the National Energy Board’s publication: Canada’s Energy Future 2013 due to differences in categorization of data.
Sources: NEB, Statistics Canada
Text version
This table provides domestic secondary energy consumption by the residential, commercial, industrial and transportation sectors from 2009 to 2013. Domestic energy consumption grew from 2009 to 2011, declined between 2011 and 2012 and grew again between 2012 and 2013 to a total of 7 610 petajoules. In the industrial sector, secondary energy consumption grew every year from 2009 to 2013.
Figure 2 - Number of Wells Drilled - Western Canada
Details
The number of wells drilled in western Canada fell slightly from 2012 levels. Natural gas drilling increased because companies targeted prospects that include natural gas liquids which earn higher prices and, therefore, generate more revenue. Oil drilling declined in 2013, as no new major tight-oil prospects were identified and companies likely settled into developing their existing properties at nearly the same pace as in 2012.
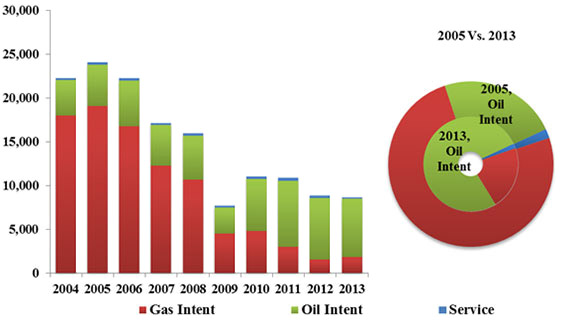
Source: NEB analysis of Divestco Inc. data
Text version
This figure includes a bar and a doughnut graph. The bar graph illustrates the number of wells drilled in western Canada from 2004 to 2013. The number of natural gas wells drilled has declined from approximately 17 900 in 2004 to 1 800 in 2013. The doughnut chart illustrates that in 2005, 20 per cent of wells drilled were for oil compared to 77 per cent in 2013.
Figure 3(A) - Western Canada Sedimentary Basin (WCSB) Oil, Natural Gas and Oil Sands Rights Expenditures - Land Sales Revenues
Details
In western Canada, provincial government revenue from the leasing of petroleum rights fell to $1 billion, the lowest level since 2002, with only British Columbia seeing an increase. As in 2012, industry did not identify any new large oil or gas prospects, which reduced the posting of land and level of bidding.
In 2012, companies committed to spend $2.05 billion on long-term oil and gas exploration to earn the petroleum rights in twelve offshore east coast parcels. In 2013 there was no petroleum-rights bidding in the offshore of Nova Scotia and Newfoundland and Labrador.
In Northern Canada, companies committed to spend $1.2 million to earn the rights to a single parcel in the Central Mackenzie Valley.
(Billion $)
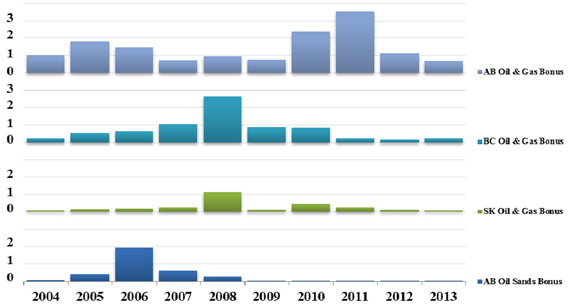
Source: Provincial governments
Text version
This graph illustrates revenues collected by provincial governments for leasing rights to explore for oil and gas, commonly referred to as “land sales”. During the period 2004-2013, Alberta’s annual oil and gas land sales revenues reached a peak of more than $3.5 billion 2011. In 2008, British Columbia and Saskatchewan both experienced a peak in oil and gas land sales revenues of $2.7 billion and $1.2 billion, respectively. Since 2009, Alberta's oil sands land sales revenues have remained below $50 million per year after peaking at nearly $2 billion in 2006.
Figure 3(B) - WCSB Oil, Natural Gas and Oil Sands Land Sales Activity
Area (million hectares)
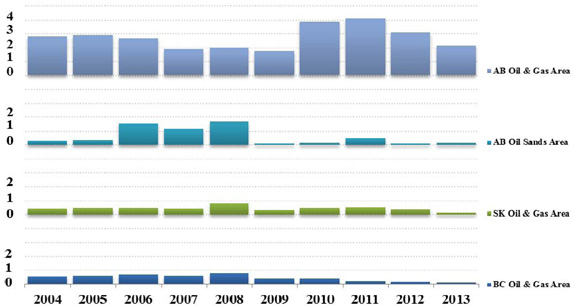
Sources: Provincial governments
Text version
This figure illustrates oil and gas land sales activity in Alberta, British Columbia and Saskatchewan as well as oil sands land sales activity in Alberta. Between 2004 and 2013, the leasing of exploration rights involved an annual average of approximately 2.8 million hectares of land in Alberta. In Saskatchewan the annual average of leasing and exploration rights was about 0.49 million hectares; in British Columbia, it was about 0.46 million hectares; and in the Alberta oil sands, it was about 0.55 million hectares.
Figure 4 - Crude Oil Production
Details
Canadian crude oil production in 2013 increased by 7.7 per cent when compared to 2012, averaging an estimated 0.55 million cubic metres per day or 3.5 million barrels per day. This growth was largely attributable to increased oil sands production, a rebound in East Coast production levels, and increased tight oil production in the WCSB.
In 2013, oil sands derived oil production reached an estimated 0.31 million cubic metres per day (1.95 million barrels per day), with synthetic crude oil increasing by 3.8 per cent and non-upgraded bitumen production increasing by 12.8 per cent over 2012 levels.
Offshore Newfoundland and Labrador oil production increased by 16.3 per cent over 2012 levels, as several fields resumed full production after extended maintenance downtime.
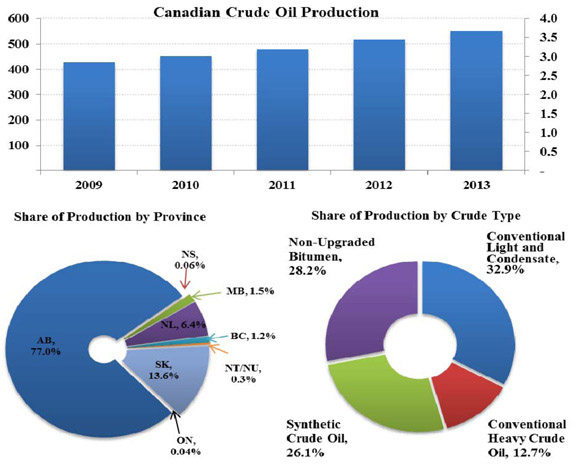
Sources: Provincial energy agencies, Offshore Petroleum Boards, NEB
Text version
The figure contains three separate graphs. The first graph shows Canadian crude oil production from 2009 to 2013 which increased every year.
The pie graph shows the share of crude oil and equivalent production by province as a percentage of total Canadian production. In 2013, Alberta produced about 77 per cent of Canadian production followed by Saskatchewan at 13.6 per cent. Newfoundland, Manitoba, British Columbia, Northwest Territories/Nunavut, Nova Scotia and Ontario produced 6.4, 1.5, 1.2, 0.3, 0.06 and 0.04 per cent, respectively.
The final doughnut graph shows the 2013 production volumes, arranged by type of crude oil. Conventional light and condensate accounted for the greatest amount of production, followed by non-upgraded bitumen, synthetic crude and conventional heavy crude.
Figure 5 - Crude Bitumen Production
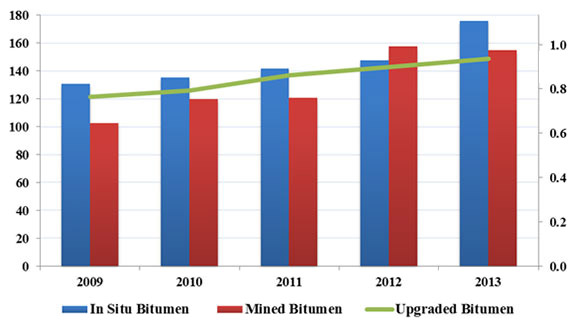
Source: Alberta Energy Regulator (AER)
Text version
In 2013, mining produced 155.2 thousand cubic metres per day (0.98 million barrels per day) of bitumen while in situ production yielded 176.2 thousand cubic metres per day (1.1 million barrels per day) and upgraded bitumen totaled 148.8 thousand cubic metres per day (0.94 million barrels per day).
Figure 6 - WTI and North Sea Brent Oil Price
US$/bbl
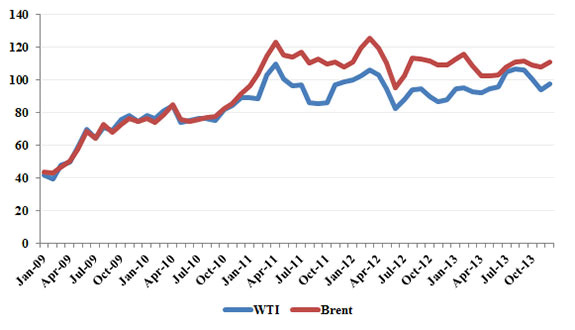
Source: EIA
Text version
This graph shows prices for two light crude oil benchmarks: WTI at Cushing, Oklahoma, and Brent (North Sea) from 2009 to 2013. Since 2011, WTI prices have been lower than Brent, in part due to supply and demand imbalances in the U.S. midcontinent. Brent traded on average US$10.73 above WTI in 2013, a decrease from the 2012 average of US$17.53.
Figure 7 - Mexican Mayan and Western Canadian Select Oil Prices
Details
Posted prices for two heavy crude oil benchmarks: Western Canadian Select (WCS) at Hardisty, Alberta and the similar quality Mexican Mayan at the U.S. Gulf Coast were quite comparable in 2009 through to mid-2010. In the period following, WCS prices began to drop relative to Mexican Mayan reflecting inadequate market access for western Canadian heavy oil. In December 2013, the price differential between WCS and Mexican Mayan was US$18.07 per barrel.
US$/bbl
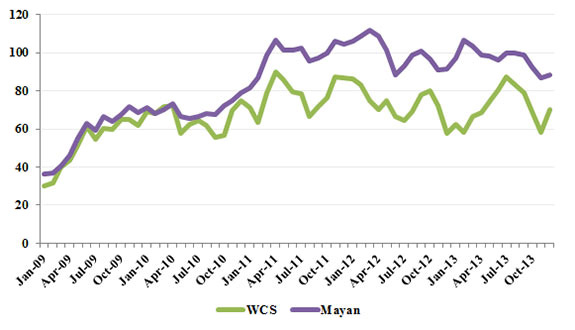
Source: EIA
Text version
This graph shows the prices of WCS and Mayan from 2009 to 2013. Since 2010, WCS was consistently lower priced because of oil transportation bottlenecks in the U.S. Midwest.
Figure 8
Annual Canadian Crude Oil Exports and Imports - A)
Light and Heavy Crude Oil Export Prices - B)
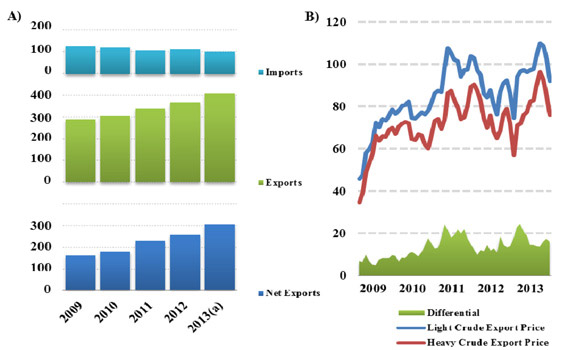
(a) Estimates
Sources: NEB, Statistics Canada
Text version
This figure contains two separate graphs. Graph A) illustrates the annual crude oil exports and imports in Canada. From 2009 to 2013, imports have been relatively flat at around 100 thousand cubic metres per day (0.6 million barrels per day). In contrast, exports have grown from 291 thousand cubic metres per day (1.8 million barrels per day) in 2009 to 408 thousand cubic metres per day (2.6 million barrels per day) in 2013.
Graph B) illustrates the Canadian monthly light and heavy crude oil export prices, along with the differentials between the two prices, in dollars per barrel from 2009 to 2013. Monthly light crude export prices have increased from approximately $49 per barrel in 2009 to $92 per barrel in 2013. Heavy crude export prices have increased from approximately $35 per barrel in 2009 to $76 per barrel in 2013.
Table 4 - World Oil and Canadian Product Prices
| Product | 2012 | 2013 | Change | % Change |
|---|---|---|---|---|
| Gasoline (cents/litre) | 127.5 | 127.9 | 0.4 | 0.3 |
| Diesel (cents/litre) | 125.4 | 128.6 | 3.2 | 2.5 |
| Furnace oil (cents/litre) | 117.7 | 120.4 | 2.7 | 2.3 |
| Western Canadian Select (WCS) (US$/barrel, Hardisty) | 73.2 | 71.5 | -1.7 | -2.3 |
| Edmonton Par (Cdn$/bbl) | 86.0 | 92.8 | 6.8 | 7.9 |
Sources: Natural Resources Canada, EIA
Text version
This table shows the 2012 and 2013 average Canadian product prices for gasoline, diesel and furnace oil and the WCS and Edmonton Par prices for oil.
Figure 9 - North American Gas Prices – Henry Hub (3-day average price)
US$/MMBtu
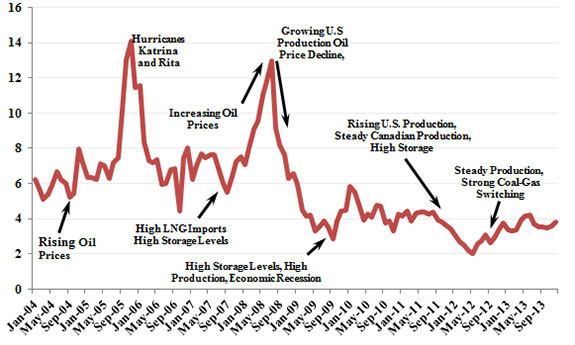
Source: GLJ Publications Inc.
Text version
This graph illustrates monthly Henry Hub gas prices in U.S dollars per million British thermal units from 2004 to 2013. Natural gas prices at Henry Hub averaged US$3.67 per million British thermal units in 2013, 31 per cent above the 2012 level of $2.80. Natural gas prices ranged between US$3.22 and US$4.19 per million British thermal units in 2013. In Alberta, prices averaged $3.17/MMBtu, 33 per cent above their 2012 levels of $2.39/MMBtu.
Figure 10 - Canada and U.S Natural Gas Storage Inventories
Details
The natural gas storage injection season in 2013 ended during the second week of November. At that time, combined Canadian and U.S. natural gas inventories reached their peak level of 128.9 billion cubic metres (4.5 trillion cubic feet). At year-end 2013, storage inventories were at their lowest levels in five years at 98.7 billion cubic metres (3.5 trillion cubic feet).
Tcf
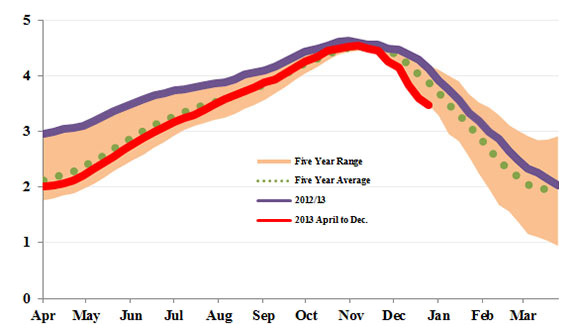
Sources: EIA, Enerdata
Text version
This graph illustrates Canada and the U.S.’s combined natural gas storage inventory levels in trillion cubic feet. It shows the levels for the 2012/2013 fiscal year, April to December of 2013, and the average, minimum and maximum of the past five years. Natural gas inventories follow a seasonal pattern, with a peak in November and a trough through the spring and summer months.
Figure 11 - Canadian Natural Gas Consumption
Details
Overall consumption of natural gas in Canada grew by 4.0 per cent in 2013, to 244.5 million cubic metres per day, up 9.5 million cubic metres per day from 2012 levels. Oil sands consumption of natural gas increased by 4.3 per cent in 2013 and now constitutes 38.1 per cent of industrial consumption (up from 24.4 per cent in 2004) and 13.6 per cent of total Canadian consumption (up from 6.0 per cent in 2004).
106m³/d
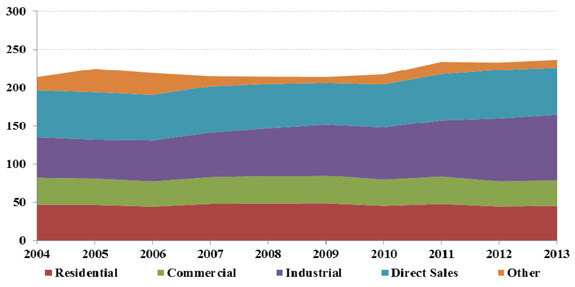
Source: Statistics Canada
Text version
This stacked area chart shows annual natural gas consumption by sector from 2004 to 2013. The sectors are residential, commercial, industrial, direct sales and other. Total consumption increased by 12.6 per cent since 2004, mostly due to rising use of natural gas in the industrial sector.
Figure 12 - Annual Number of Heating Degree Days
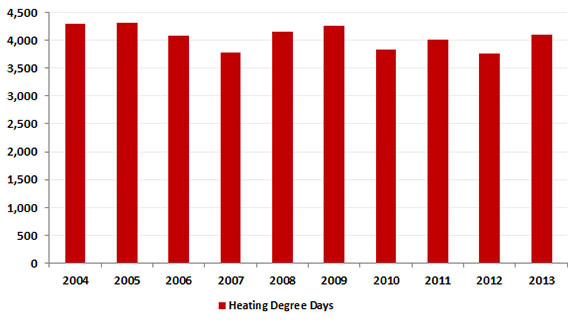
Source: Canadian Gas Association (CGA)
Text version
This bar chart shows the annual number of heating degree days in Canada from 2004 to 2013. Heating degree day is a measurement designed to reflect the demand for energy needed to heat a building and is derived from measurements of outside air temperature. Heating degree days are defined relative to a base temperature which is the outside temperature above which a building needs no heating. Between 2004 and 2013, heating degree days have fluctuated between 3,762 and 4,305 per year.
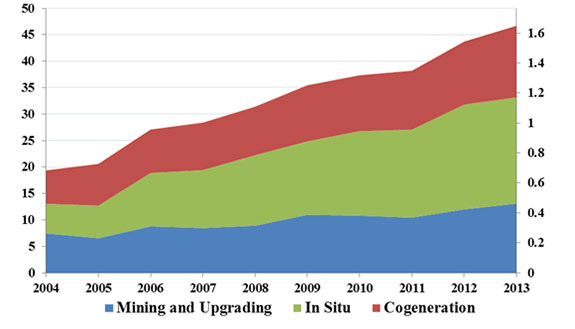
Figure 13 - Average Annual Purchased Natural Gas Requirements for Oil Sands Operations
Details
Alberta oil sands operations use natural gas to generate electricity and steam. Steam is used for in situ oil production and in the production of hydrogen used to upgrade bitumen into synthetic crude oil. Total natural gas purchases for oil sands operations reached 46.7 million cubic metres per day (1.6 billion cubic feet per day) in 2013, up 6.8 per cent from a year earlier.
(a) Estimates
Sources: NEB, AER
Text version
This stacked area graph displays the annual natural gas purchased by type of oil sands operation: mining and upgrading, in situ, and cogeneration. This graph includes cogeneration for both mining and in situ production. Rising in situ production has increased its share of natural gas purchases to 43.0 per cent, up from a 30.0 per cent share in 2004.
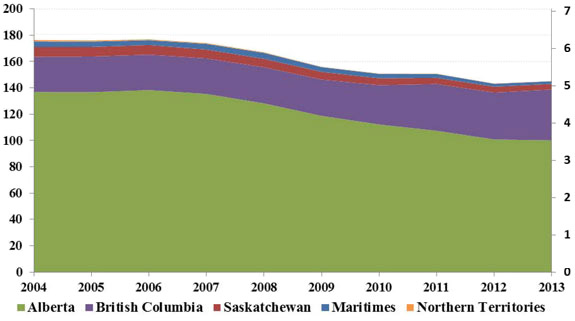
Figure 14 - Canadian Marketable Natural Gas Production
Details
Canadian marketable natural gas production has been relatively flat over the past two years, with 2013 production climbing 1.3 per cent from 2012 to an annual average of 395.6 million cubic metres per day (14.0 billion cubic feet per day) 2013. Activity continues to focus on the liquids-rich gas plays in Alberta and British Columbia. Outside of the WCSB, EnCana’s Deep Panuke offshore facilities started production in September 2013 and continued to ramp up, reversing the downward production trend of Eastern Canada.
(a) Estimates for 2013 data
Sources: NEB via Governments of energy producing provinces and territories
Text version
This stacked area graph shows Canada’s annual marketable natural gas production by province from 2004 to 2013. Total production was 145.2 billion cubic metres (5.1 trillion cubic feet) in 2013, down 18 per cent since 2004. Production grew 1.3 per cent on the year earlier, driven by an 8.5 per cent increase in British Columbia, which has also grown 44 per cent over its 2004 levels.
Figure 15 - Quarterly Canadian Natural Gas Exports and Imports

Source: NEB
Text version
This chart shows quarterly exports and imports of natural gas in Canada from 2011 to 2013. Bars illustrate the exports and imports of natural gas and liquefied natural gas (LNG) imports, while a line illustrates net exports (i.e., the total difference between exports and imports). Net exports averaged 148.7 million cubic metres per day (5.3 billion cubic feet per day) in 2013, down 5 per cent from 2012 levels.
Table 5 - Electricity Supply and Disposition (TW.h)
| 2009 | 2010 | 2011 | 2012 | 2013[a] | % Change (2012-2013) |
|
|---|---|---|---|---|---|---|
| Supply | ||||||
| Total Generation | 595.5 | 588.0 | 618.6 | 614.5 | 611.2 | -0.5 |
| Imports | 18.6 | 20.2 | 16.1 | 11.4 | 10.7 | -6.1 |
| Total Supply | 595.5 | 608.2 | 634.6 | 625.9 | 621.9 | -0.6 |
| Disposition | ||||||
| Demand | 542.2 | 562.6 | 581.8 | 567.4 | 559.2 | -1.5 |
| Exports | 53.3 | 45.6 | 52.8 | 58.5 | 62.7 | 7.3 |
| Total Disposition | 595.5 | 608.2 | 634.6 | 625.9 | 621.9 | -0.6 |
[a] Estimates: summation of monthly estimates
Sources: Statistics Canada, NEB
Note: Monthly electricity generation numbers are based on a survey that excludes smaller producers and certain isolated stations. Annual generation numbers are based on a different survey that includes these smaller producers. Because of this, the summation of the monthly generation estimates has been, on average, 2.8 per cent lower than the numbers reported by the annual survey for the last 8 years. Therefore, the 2013 electricity generation estimates will almost certainly be revised upward upon release of the annual data.
Text version
This table lists electricity supply and disposition from 2009 to 2013.
Table 6 - Electricity Generation (TW.h)
| 2009 | 2010 | 2011 | 2012 | 2013[a] | % Change (2012-2013) |
|
|---|---|---|---|---|---|---|
| Hydroelectric | 365.1 | 348.0 | 372.1 | 376.9 | 387.6 | 2.9 |
| Nuclear | 85.0 | 85.5 | 88.3 | 89.5 | 97.0 | 8.4 |
| Thermal | 136.9 | 142.8 | 145.3 | 133.8 | 117.2 | -12.4 |
| Wind, Tidal & Solar | 6.6 | 8.8 | 10.4 | 11.6 | 9.3 | -19.9 |
| Other | 1.9 | 3.0 | 2.5 | 2.7 | 0.1 | -97.7 |
| Total | 595.5 | 589.0 | 618.6 | 614.5 | 611.2 | -0.5 |
[a] Estimates, summation of monthly estimates, see note from previous table
Source: Statistics Canada
Text version
This table lists electricity production from 2009 to 2013. When compared to 2012, 2013 hydroelectric and nuclear production increased while production from thermal, wind, tidal, solar and other generation sources declined.
Figure 16 - Average Electricity Prices for Canadian Residential Customers, 2012-2013
Cents / kW.h
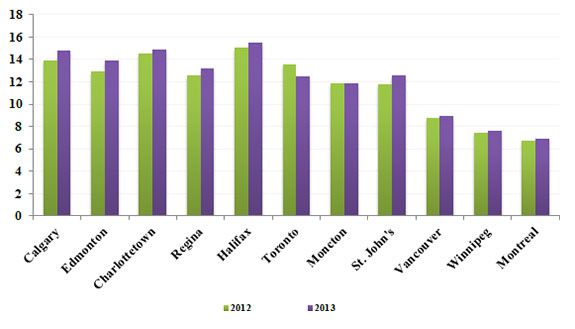
Source: Comparison of Electricity Prices in Major North American Cities, Hydro-Québec, 2013.
Based on 1 April electricity rates in 2012 and 2013 and a monthly consumption of 1 000 kW.h (excludes taxes).
Text version
This bar graph compares the electricity prices that households pay in various cities across Canada. Prices generally increased over 2012 levels, with the exception of Toronto, where it decreased, and in Moncton, where it remained constant. Halifax continued to have the highest electricity price in 2013 at 15.45 cents per kilowatt hour, followed by Charlottetown at 14.87 and Calgary at 14.81. Montreal, Winnipeg and Vancouver continued having the cheapest electricity, with rates of 6.87, 7.63, and 8.91 cents per kilowatt hour, respectively.
Figure 17 - Annual electricity exports and imports
TW.h
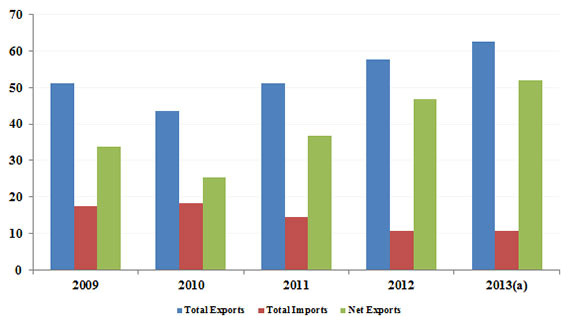
(a) Estimates
Source: NEB
Text version
This side by side bar graph illustrates Canada's annual electricity exports, imports and net exports from 2009 to 2013. Annual electricity exports and net exports grew between 2010 and 2013. In 2013, net electricity exports were approximately 50 Terawatt hours.
Appendix 1: Canadian Oil Reserves at 31 December 2013
| Crude Oil Reserves | |||
|---|---|---|---|
| Initial Reserves | Cumulative Production | Remaining Established Reserves | |
| Conventional Crude Oil | |||
| Light | |||
| British Columbia | 135 | 116 | 19 |
| Alberta | 2 525 | 2 321 | 205 |
| Saskatchewan | 315 | 281 | 34 |
| Manitoba | 60 | 55 | 5 |
| Subtotal - WCSB | 3 035 | 2 773 | 262 |
| Ontario | 16 | 15 | 2 |
| Nova Scotia Offshore | 7 | 7 | 0 |
| Newfoundland Grand Banks | 464 | 233 | 231 |
| Mainland NWT & Yukon | 53 | 44 | 9 |
| Arctic Islands | 1 | 1 | 0 |
| Subtotal - Frontier | 524 | 284 | 240 |
| Subtotal - Light | 3 575 | 3 071 | 503 |
| Heavy | |||
| Alberta | 397 | 332 | 65 |
| Saskatchewan | 720 | 617 | 103 |
| Subtotal - Heavy | 1 117 | 949 | 167 |
| Total - Conventional | 4 691 | 4 021 | 671 |
| Oil Sands | |||
| Mining Projects | 6 157 | 874 | 5 283 |
| In Situ Projects | 21 935 | 532 | 21 403 |
| Total - Oil Sands | 28 092 | 1 406 | 26 686 |
| Total Canada | 32 783 | 5 427 | 27 357 |
Sources:
- Newfoundland & Labrador Offshore Petroleum Board for East Coast
- NEB for estimates of reserves in the Mainland Territories and Arctic Islands
- Alberta ERCB Reserves Report & Supply & Demand Report 2013
- Saskatchewan Reservoir Annual 2009
- British Columbia Hydrocarbon and ByProducts Reserves 2011
- CAPP for Manitoba
- CAPP for Ontario
| Crude Oil Reserves | |||
|---|---|---|---|
| Initial Reserves | Cumulative Production | Remaining Established Reserves | |
| Conventional Crude Oil | |||
| Light | |||
| British Columbia | 843 | 723 | 120 |
| Alberta | 15 812 | 14 531 | 1 281 |
| Saskatchewan | 1 973 | 1 762 | 210 |
| Manitoba | 376 | 345 | 31 |
| Subtotal - WCSB | 19 003 | 17 361 | 1 641 |
| Ontario | 100 | 91 | 9 |
| Nova Scotia Offshore | 44 | 44 | 0 |
| Newfoundland Grand Banks | 2 904 | 1 458 | 1 446 |
| Mainland NWT & Yukon | 331 | 276 | 55 |
| Arctic Islands | 3 | 3 | 0 |
| Subtotal - Frontier | 3 282 | 1 781 | 1 501 |
| Subtotal - Light | 22 385 | 19 233 | 3 152 |
| Heavy | |||
| Alberta | 2 484 | 2 079 | 405 |
| Saskatchewan | 4 509 | 3 866 | 643 |
| Subtotal - Heavy | 6 993 | 5 945 | 1 048 |
| Total - Conventional | 29 378 | 25 178 | 4 200 |
| Oil Sands | |||
| Mining Projects | 38 555 | 5 473 | 33 082 |
| In Situ Projects | 137 357 | 3 331 | 134 026 |
| Total - Oil Sands | 175 912 | 8 804 | 167 108 |
| Total Canada | 205 290 | 33 982 | 171 308 |
Appendix 2 - Canadian Natural Gas Reserves[*] at 31 December 2013
| Natural Gas Reserves | |||
|---|---|---|---|
| Initial Reserves | Cumulative Production | Remaining Established Reserves | |
| Western Canadian Sedimentary Basin | |||
| British Columbia | 1 622 | 698 | 924 |
| Alberta | 5 341 | 4 425 | 916 |
| Saskatchewan | 266 | 211 | 54 |
| Total | 7 228 | 5 335 | 1 894 |
| Ontario | 43 | 36 | 7 |
| Frontier | |||
| New Brunswick | 4 | 1 | 3 |
| Nova Scotia Offshore | 55 | 49 | 6 |
| Newfoundland | 106 | 0 | 106 |
| Mainland NWT & Yukon | 32 | 20 | 13 |
| Mackenzie Delta | 0 | 0 | 0 |
| Subtotal - Frontier | 198 | 70 | 128 |
| Total Canada | 7 470 | 5 441 | 2 028 |
[*] Note: Natural gas reserves are defined as the total amount of marketable gas in discovered pools that can be extracted in current economic conditions.
Sources: Provincial energy agencies, Offshore Petroleum Boards, NEB
| Natural Gas Reserves | |||
|---|---|---|---|
| Initial Reserves | Cumulative Production | Remaining Established Reserves | |
| Western Canadian Sedimentary Basin | |||
| British Columbia | 57 258 | 24 649 | 32 609 |
| Alberta | 188 542 | 156 221 | 32 321 |
| Saskatchewan | 9 372 | 7 449 | 1 923 |
| Total | 255 173 | 188 320 | 66 853 |
| Ontario | 1 526 | 1 280 | 246 |
| Frontier | |||
| New Brunswick | 145 | 43 | 101 |
| Nova Scotia Offshore | 1 942 | 1 744 | 198 |
| Newfoundland | 3 749 | 0 | 3 749 |
| Mainland NWT & Yukon | 1 144 | 694 | 450 |
| Mackenzie Delta | 11 | 7 | 4 |
| Subtotal - Frontier | 6 990 | 2 488 | 4 501 |
| Total Canada | 263 688 | 192 087 | 71 601 |
Endnote
[1] Natural Resources Canada defines secondary energy use as energy used by final consumers for residential, agricultural, commercial, industrial and transportation purposes.
- Date modified: