ARCHIVED – Canada’s Energy Future 2013 - Energy Supply and Demand Projections to 2035 - An Energy Market Assessment
This page has been archived on the Web
Information identified as archived is provided for reference, research or recordkeeping purposes. It is not subject to the Government of Canada Web Standards and has not been altered or updated since it was archived. Please contact us to request a format other than those available.
Feedback
For further information about the report Canada’s Energy Future 2013 - Energy Supply and Demand Projections to 2035, please email us at energyfutures@cer-rec.gc.ca.

November 2013
Copyright/Permission to Reproduce
ISSN 2292-1710
Table Of Contents
- List of Figures
- List of Tables
- List of Acronyms and Abbreviations
- List of Units
- Foreword
- Executive Summary
- Chapter 1: Introduction
- Chapter 2: Energy Context
- Chapter 3: Key Drivers
- Chapter 4: Energy Demand Outlook
- Chapter 5: Crude Oil Outlook
- Chapter 6: Natural Gas Outlook
- Chapter 7: Natural Gas Liquids Outlook
- Chapter 8: Electricity Outlook
- Chapter 9: Coal Outlook
- Chapter 10: Conclusion
- Glossary
- Conversion Tables
- Endnotes
- Appendices
List of Figures
- ES.1 Energy Production in Canada, on an Energy Equivalent Basis
- ES.2 Energy Demand by Sector: Historic and Projected Growth
- 1.1 Price Projections to 2035, All Cases
- 2.1 Combined Canada and U.S. Marketable Natural Gas Production by Type
- 2.2 Canadian Tight Oil Production
- 2.3 U.S. Tight Oil Production
- 2.4 U.S. Vehicle Kilometres Travelled and Transportation Petroleum Consumption
- 2.5 Benchmark Oil Prices
- 2.6 Benchmark Oil Prices and Price Differentials
- 2.7 Railway Car Loading, Fuel Oils and Crude Petroleum, Western Canada
- 2.8 B.C., Alberta and Saskatchewan Combined Production and Consumption
- 2.9 Annual Canadian Electricity Exports, Imports and Export Revenue
- 3.1 WTI Crude Oil Price at Cushing, Oklahoma, All Cases
- 3.2 Henry Hub Natural Gas Price at Louisiana, All Cases
- 3.3 Annual GDP Growth, Reference Case
- 4.1 End-Use Energy Demand by Sector, Reference Case
- 4.2 Residential Energy Demand, Reference Case
- 4.3 Commercial Energy Demand, Reference Case
- 4.4 Industrial Energy Demand, Reference Case
- 4.5 Transportation Energy Demand by Travel Type, Reference Case
- 4.6 Transportation Energy Demand by Fuel, Reference Case
- 4.7 Share of Fuel in Primary Energy Demand, Reference Case
- 4.8 Primary Natural Gas Demand, Reference Case
- 5.1 Total Canadian Crude Oil and Equivalent Production, Reference Case
- 5.2 Oil Sands Production and Projection Comparison, Reference Case
- 5.3 Purchased Natural Gas for Oil Sands Extraction and Upgrading, Reference Case
- 5.4 WCSB Conventional Oil Production, Reference Case
- 5.5 WCSB Incremental Tight Oil Production, Reference Case
- 5.6 Eastern Canada Oil Production, All Cases
- 5.7 Total Canada Oil Production, All Cases
- 5.8 Net Available Oil Supply, Reference Case
- 5.9 Supply and Demand Balance, Light Crude Oil, Reference Case
- 5.10 Supply and Demand Balance, Heavy Crude Oil, Reference Case
- 6.1 Natural Gas Wells Drilled, All Cases, and Average IP Rate
- 6.2 Natural Gas Production by Type, Reference Case
- 6.3 Total Canadian Marketable Gas Production, All Cases
- 6.4 Canadian Net Natural Gas Available for Export, Reference Case
- 6.5 Canadian Net Natural Gas Exports, by Case
- 7.1 Natural Gas Liquids Production, Reference Case
- 7.2 Pentanes Plus Supply and Demand, Reference Case
- 7.3 WCSB Ethane Availability in Raw Gas and Ethane Production, Reference Case
- 7.4 Ethane Supply and Demand Balance, Reference Case
- 8.1 Capacity Additions and Retirements by 2035, Reference Case
- 8.2 Capacity Mix by Primary Fuel, 2012 and 2035, Reference Case
- 8.3 Capacity by Primary Fuel, Reference Case
- 8.4 Generation by Fuel, Reference Case
- 8.5 Electricity Net Available for Export and Interprovincial Interchange, Reference Case
- 9.1 Canadian Coal Production and Disposition, 2010, 2020 and 2035, Reference Case
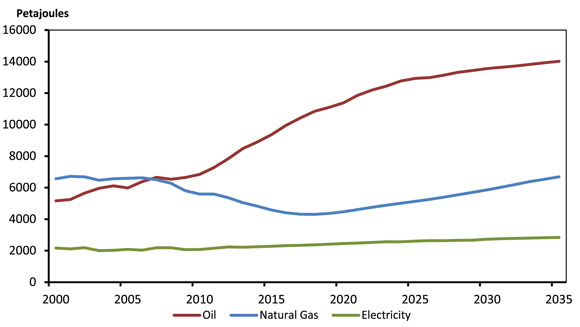
- 10.1 Production of Crude Oil, Natural Gas and Electricity, Reference Case
- 10.2 Comparison of Historical and Projected Growth Rates of Population, Real GDP, and End-use Energy Demand, Reference Case
List of Tables
- 2.1 Long-term Natural Gas Export Licences and Applications Under Review as of 1 October 2013
- 5.1 Remaining Ultimate Potential and Established Reserves, as of 31 December 2012
- 5.2 Estimated Initial Capital Expenditure (CAPEX) and Threshold Prices for New Oil Sands Projects
- 6.1 Remaining Marketable Natural Gas Resources, as of 31 December 2012
List of Acronyms and Abbreviations
List of Units
Foreword
The National Energy Board (NEB or Board) is an independent federal regulator whose purpose is to promote safety and security, environmental protection and efficient infrastructure and markets in the Canadian public interest[1] within the mandate set by Parliament for the regulation of pipelines, energy development, and trade.
The Board’s main responsibilities include regulating the construction and operation of interprovincial and international oil and natural gas pipelines, international power lines, and designated interprovincial power lines. Furthermore, the Board regulates the tolls and tariffs for the pipelines under its jurisdiction. With respect to the specific energy commodities, the Board regulates the export of natural gas, oil, natural gas liquids (NGLs) and electricity, and the import of natural gas. Additionally, the Board regulates oil and natural gas exploration and development on frontier lands and offshore areas not covered by provincial or federal management agreements.
For oil and natural gas exports, the Board’s role is to evaluate whether the oil and natural gas proposed to be exported is surplus to reasonably foreseeable Canadian requirements, having regard to the trends in the discovery of oil or gas in Canada.[2] The Board monitors energy markets, and provides its view of Canadian energy requirements and trends in discovery of oil and natural gas to support its responsibilities under Part VI of the National Energy Board Act (the NEB Act). The Board periodically publishes assessments of Canadian energy supply, demand and markets in support of its ongoing market monitoring. These assessments address various aspects of energy markets in Canada. This report, Canada’s Energy Future 2013: Energy Supply and Demand Projections to 2035 is one such assessment that projects Canadian energy supply and demand trends out to 2035.
While preparing this report, in addition to conducting its own quantitative analysis, the NEB held a series of informal meetings and discussions with industry, academia, other government agencies and departments, non-governmental organizations (NGOs), energy experts, and interested stakeholders. The NEB appreciates the information and comments provided and would like to thank all participants for their time and expertise.
If a party wishes to rely on material from this report in any regulatory proceeding before the NEB, it may submit the material, just as it may submit any public document. Under these circumstances, the submitting party in effect adopts the material and that party could be required to answer questions pertaining to the material.
This report does not provide an indication about whether any application will be approved or not. The Board will decide on specific applications based on the material in evidence before it at that time.
Comments or questions on this report can be directed to:
energyfutures@cer-rec.gc.ca.
Executive Summary
Canada’s Energy Future 2013: Energy Supply and Demand Projections to 2035 (EF 2013) reports enough energy supplies will be available to meet Canada’s growing energy needs for the foreseeable future. Over the next 20 years, the NEB projects energy production levels increasingly greater than domestic needs, resulting in growing amounts of energy available for export.
Total Canadian production grows substantially over the projection period.
Canada has vast energy resources. The oil and natural gas resource base is large enough to meet Canadian needs for many generations, and abundant hydroelectric resources account for the majority of the electricity mix. Considering this resource base, as well as the projected commodity prices and economic drivers, EF 2013 projects total Canadian energy production to grow substantially in the future.
Oil production leads this growth, with 2035 production reaching 928 10³m³/d (5.8 MMb/d), or nearly 75 per cent higher than in 2012. In situ oil sands production makes up the majority of the increase. Natural gas production increases 25 per cent above current levels by 2035, led by higher levels of tight and shale gas development.
Canadian electricity supply also steadily increases over the projection period. Natural gas-fired power generation capacity increases substantially. Coal-fired generation capacity declines, largely a result of federal and provincial regulations. Non-hydro renewable capacity doubles its share of Canada’s electricity capacity mix. Total electricity generation increases 27 per cent over the projection period.
Figure ES.1 - Energy Production in Canada, on an Energy Equivalent Basis
Total Canadian energy use grows moderately.
EF 2013 projects that total energy consumed by Canadians will continue to grow, but at a slower rate than in the past.
Hydrocarbons continue to be the main source of energy to heat homes and businesses, transport people and goods, and many other functions that are integral to Canadians’ standard of living. Canadian demand for oil and natural gas increases by 28 per cent over the projection period. Emerging fuels and technologies, such as solar hot water heating and electric vehicles, continue to gain market share.
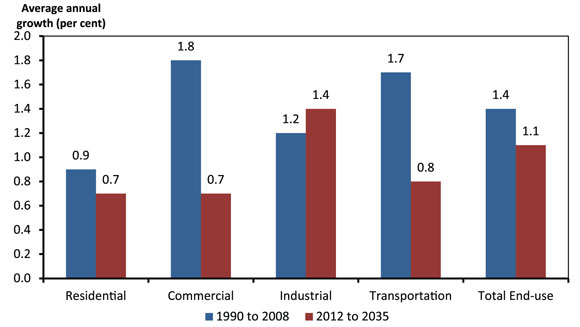
Figure ES.2 - Energy Demand by Sector: Historic and Projected Growth
Canadians use energy more efficiently.
By 2035, the energy used per unit of economic output is projected to be 20 per cent lower than in 2012, due to improvements in energy efficiency. In a reversal of the long-term trend, passenger transportation energy use declines over the projection, largely due to new passenger vehicle emission standards which are expected to improve vehicle fuel efficiency.
Energy available for export increases.
EF 2013 concludes Canada will have more than enough energy to meet its growing needs, with significant amounts of energy available for export. Growth in export markets and the infrastructure to access them are key uncertainties in this report’s projections.
Chapter 1: Introduction
- Canada’s Energy Future 2013: Energy Supply and Demand Projections to 2035 (EF 2013) is a continuation of a series of long-term supply and demand projections that the National Energy Board (NEB) has been producing regularly since 1967.
- In developing EF 2013, the NEB met with various energy experts and interested stakeholders, including representatives from industry and industry associations, government, environmental non-governmental organizations and academia to gather input and feedback on the preliminary projections. The information obtained from these consultations helped shape the key assumptions and final projections.
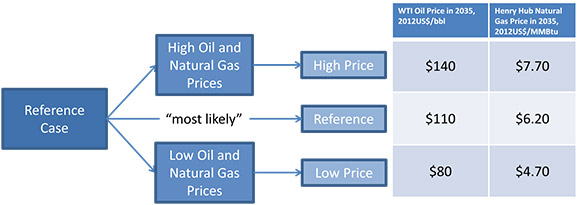
- EF 2013 projects energy supply and demand for Canada to the year 2035. It includes a Reference Case, with baseline projections based on the current macroeconomic outlook, a moderate view of energy prices, and government policies and programs that were law or near-law at the time the report was prepared. It is considered the “most likely” outcome for Canada’s energy future.
- In addition to the Reference Case, EF 2013 considers two sensitivity cases to provide broader perspective and to reflect the uncertainty around energy prices. The sensitivity cases are referred to as the High Price and Low Price Cases.
- The sensitivity cases differ from the Reference Case by changing the underlying price assumptions (Figure 1.1). The NEB’s suite of models helps to estimate the effects on the energy system and economy. Sensitivity analysis is a simple and effective means for analyzing uncertainty by isolating the effect of a change in one variable.
Figure 1.1 - Price Projections to 2035, All Cases
- There are four key assumptions underpinning this analysis:
- All energy production will find markets and infrastructure will be built as needed.
- Environmental and socio-economic considerations, beyond the included policies and programs, are outside the scope of this analysis.
- Only policies and programs that are law or near law at the time of writing are included in the projections. As a result, any policies under consideration, or new policies developed after the projections were completed, are not included in this analysis.
- Energy markets are constantly evolving. The analysis presented in EF 2013 is based on the best available information at the time of finalizing the analysis and results.
- Over the 23-year projection period, it is likely that developments beyond the realm of normal expectations will occur, such as geopolitical events or technological breakthroughs. Likewise, new information will become available and trends, policies and technology will evolve. Readers of this analysis should consider the projections a baseline for discussing Canada’s energy future, not a prediction of what will take place.
- The following chapters discuss the key factors influencing the Reference and sensitivity cases, highlighting key changes in Canadian energy supply and demand trends. Detailed data tables supporting this discussion are available in the Appendices on the NEB website.
Chapter 2: Energy Context
- The North American energy market has changed rapidly over the past several years. Likely the most notable change has been technological advances in drilling and well completion techniques that have rapidly transformed the outlook for North American natural gas and oil production. The impacts of these advances, and other shifting trends in the energy system, have important implications for Canadians and are described in the following section.
The Changing Energy Landscape
Shale and Tight Natural Gas Production
- Less than ten years ago the natural gas market was notably different than it is today. Natural gas producers were drilling as many gas wells as possible to try to maintain production levels and liquefied natural gas (LNG) imports from abroad were increasingly supplementing the North American gas supply. The 2005 edition of the United States (U.S.) Energy Information Administration’s (EIA) Annual Energy Outlook (AEO) projected LNG imports to increase to 494.4 106m³/d (17.5 Bcf/d) by 2025, 22 per cent of total U.S. consumption in that year.[3] The long-term expectation was for a supply-constrained natural gas market, with high gas prices and moderate gas demand growth.
- In a matter of a few years, the landscape for natural gas in North America changed dramatically, switching from a tight supply and demand balance to a market in which natural gas supplies are considerably more abundant at lower costs. A number of LNG export terminals are being proposed in Canada and the U.S., signs that the North American market is currently very well-supplied.
- This reversal can be largely attributed to technological advancements in natural gas drilling and well completion methods. In particular, a combination of extended reach horizontal drilling, multi-stage hydraulic fracturing and pad drilling have allowed producers to recover gas from areas that were previously thought to be technically impossible or not profitable. These technologies have largely been applied in deep shale and tight gas plays with little or no previous development.
- Extended reach horizontal drilling entails drilling down vertically, possibly to depths of two thousand metres or more, and then drilling horizontally within the target formation for considerable distances. As technology has progressed, the length of horizontal legs being drilled has increased.
- Hydraulic fracturing is a technique that has been around for many decades, but the process of creating several fractured zones in a single well within a short period of time - multi-stage hydraulic fracturing - is a much more recent advancement. To hydraulically fracture a well, companies typically pump a mixture of water, chemicals, and proppant[4] into the well at high pressures until the targeted formation cracks, creating a network of fractures through which gas can move from the formation and into the well. Multi-stage hydraulic fracturing processes continue to advance with the number of fracture stages within a well continuing to increase.
- Typically, hydraulic fracturing has focused on tight and shale formations, which both have very low permeability, meaning fluids have a difficult time moving through the formation. These formations can have large amounts of hydrocarbons stored in them.
- Pad drilling involves optimizing horizontal drilling and hydraulic fracturing processes by conducting these operations on multiple wells from a centralized location or well pad. Efficiencies are gained by avoiding the need to disassemble, move and then reassemble the drilling rig for each well, and the ability to stockpile materials and consolidate equipment. The efficiency gains help to control costs by allowing a single drilling rig to drill more wells annually despite their longer horizontal length and greater number of hydraulic fracture stages.
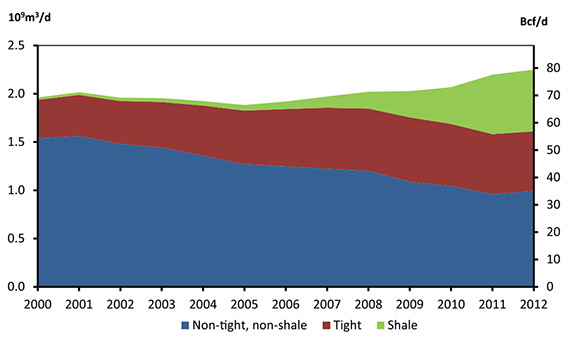
- The combination of these techniques has dramatically improved producers’ ability to recover natural gas. Gas production in the U.S. has increased sharply since 2006 when tight and shale production growth began outpacing declining production from conventional sources. In Canada, shale and tight gas production have partially offset declining conventional production, although total Canadian gas production has continually declined since 2006. Figure 2.1 demonstrates the combined U.S. and Canada natural gas production by type of production.
Figure 2.1 - Combined Canada and U.S. Marketable Natural Gas Production by Type
- As a result of rapidly increasing production, gas prices in North America have been around the US$3-4/MMBtu mark in recent years. This is much lower than prices in the 2006 to 2008 period, when the Henry Hub gas price averaged around US$7.50/MMBtu.
- In the Reference Case, natural gas prices increase gradually and shale and tight gas represent the vast majority of production growth in Canada. Production from the Montney tight gas area in Alberta and British Columbia (B.C.) and the Horn River shale gas area in Northeast B.C. help to reverse production declines and total Canadian production begins to increase by 2019. Later in the projection, several plays such as the Cordova Embayment in B.C. and Duvernay in Alberta begin to contribute to production growth as well
Tight Oil Production
- Soon after technological advances dramatically changed the gas production outlook, oil producers began applying similar technology to produce crude oil. Referred to as tight or shale oil[5], horizontal drilling and multi-stage hydraulic fracturing is applied to very low permeability shale, sandstone, and carbonate geologic formations, making oil production possible from many previously uneconomic or inaccessible reservoirs.
- Tight oil development began with the Bakken play in the Williston Basin area of North Dakota and Montana in the U.S. By year-end 2012, production in North Dakota reached nearly 123 10³m³/d (770 Mb/d)[6], a sevenfold increase over 2005 levels.
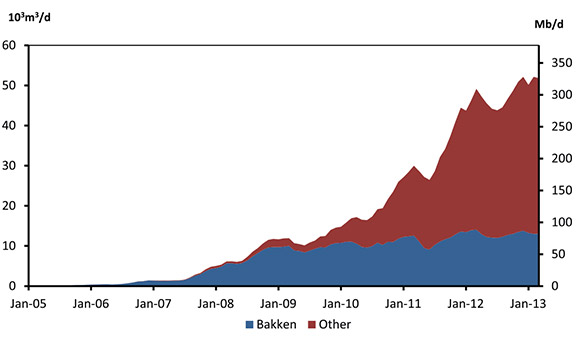
- Initial development of tight oil in Canada was also focused on the Bakken oil play, where the Williston Basin extends into Saskatchewan and Manitoba. Production at year-end 2012 is estimated at 14.2 10³m³/d (89.4 Mb/d), with the vast majority of growth occurring since mid-2007. In addition to the Bakken, several other tight oil plays are being developed in Manitoba, Saskatchewan and Alberta. Tight oil development in Canada is in its early stages and there appear to be numerous possible target formations. Figure 2.2 illustrates production levels for the Bakken and other tight oil plays, such as the Viking, Lower Shaunavon and Cardium formations. Estimated Canadian tight oil production in December 2012 was 52.1 10³m³/d (328 Mb/d), or about 10 per cent of total Canadian crude oil production.
Figure 2.2 - Canadian Tight Oil Production
- As shown in Figure 2.3, U.S. tight oil production has been growing rapidly, led by the Bakken formations in North Dakota and Montana, the Permian Basin, and more recently the Eagle Ford Shale in Texas. The Monterey Shale in California, the Mississippi Lime play in Kansas and Oklahoma, and the Three Forks formation, which underlies the Bakken formation in North Dakota, show considerable potential.
Figure 2.3 - U.S. Tight Oil Production
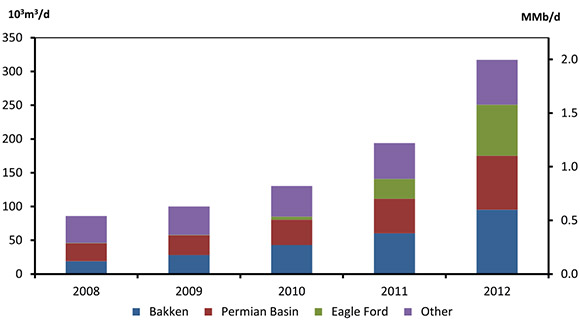
- According to the EIA, the U.S. has reversed a long-term decline in oil production, with 2012 tight oil production growing to 317.3 10³m³/d (2.0 MMb/d), and total U.S. oil production reaching 1 031.8 10³m³/d (6.5 MMb/d).
- In 2012, the U.S. imported 1 349.5 10³m³/d (8.5 MMb/d) of crude oil. In its 2013 AEO, the EIA projects U.S. oil imports to shrink to 1 079.1 10³m³/d (6.8 MMb/d) by 2021, before resuming a growth trend. However, others project this trend of decreasing imports to continue in the longer term. The International Energy Agency (IEA) in its 2012 World Energy Outlook (WEO) projects a continued decline in U.S. oil imports to 2035, largely because of increasing domestic tight oil production. Given the early stage of tight oil development, future production and trade outcomes in the U.S. are particularly uncertain at this time. Currently, Canada’s crude oil is exported entirely to the U.S., so rising U.S. domestic supply could pose some risk to the growth of Canada’s traditional market for exports.
- Shale oil deposits exist in sedimentary basins throughout the world, and the assessment of these resources is gaining momentum. Deposits in countries such as Russia and China hold significant potential, but the economic and social viability of developing these resources is still largely unproven. Whereas producers in Canada and the U.S. benefit from a vast existing oil and gas industry infrastructure, the pace of shale oil development in many other parts of the world is likely to be considerably slower as the required infrastructure could take many years to put in place. The vast worldwide shale oil deposits could potentially provide enough additional supply to impact oil prices if these challenges could be overcome.
Transportation Energy Demand in North America
- In addition to changes in energy supply, energy demand trends in North America are gradually evolving, with implications for the North American energy landscape.
- This is particularly true for oil demand related to the transportation sector. The IEA’s 2012 WEO and the U.S. EIA’s 2013 AEO both expect U.S. oil demand growth in the transportation sector to slow from historical growth rates. This change, along with supply growth, is a key factor underpinning expectations that the U.S. will reduce its reliance on imported oil.
- The U.S. transportation sector represents a large share of North American and global petroleum demand. According to data from the EIA, the U.S. consumed 1 095.0 106m³ (6.89 billion barrels) of refined petroleum products in 2011, 21 per cent of global petroleum consumption and over 80 per cent of North American consumption. Seventy per cent of U.S. refined petroleum product demand was consumed in the transportation sector.
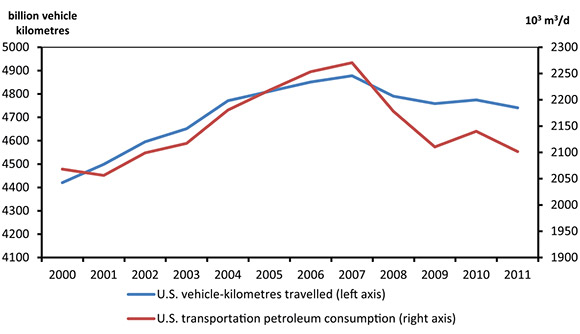
- The recent economic downturn affected transportation activity and energy use in the U.S. Figure 2.4[7] shows that both U.S. vehicle-kilometres travelled (VKT) and transportation petroleum demand began to decline in 2008, due to a combination of the economic downturn and record-high fuel prices.
Figure 2.4 - U.S. Vehicle Kilometres Travelled and Transportation Petroleum Consumption
- A key factor in the IEA and EIA projections of slowing transportation petroleum consumption is vehicle fuel efficiency improvements. Recent and forthcoming passenger and freight vehicle emission regulations are expected to result in improved vehicle efficiency in both Canada and the U.S.
- Demographics are an important factor in economic growth, and economic growth is an important driver of transportation demand. Demographics also have a direct impact on transportation demands, as different age groups tend to have different driving habits.[8] As the population ages, retirements are expected to put downward pressure on demands related to commuting. Recent research from The University of Michigan Transportation Research Institute also shows that a lower proportion of young people are becoming licensed drivers compared to previous generations.[9] This trend may also reduce transportation demands in the long term.
- The increasing use of alternative transportation fuels may also reduce the long-term demand for refined petroleum product transportation fuels in North America. Canada, the U.S., and Mexico have mandatory biofuel requirements, involving biofuels blended with gasoline and diesel. In the passenger vehicle market, there is interest in plug-in electric vehicles (EV) for personal transportation. Natural gas for transportation, particularly for freight using LNG, is also a key alternative that may experience growth, with much of the interest in long haul trucking and operations where the vehicles return to central locations often.
- In the Reference Case, Canadian transportation demand increases at an average annual rate of 0.8 per cent. This moderate growth is lower than the historical trend, and is heavily influenced by the inclusion of passenger and freight emission regulations that are expected to improve fuel efficiency. The projection also includes biofuel shares consistent with federal and provincial regulations, as well as moderate penetrations of EVs and natural gas vehicles (NGV).
The Electricity Supply Mix
- The electricity supply mix in North America has been changing in recent years, with implications for coal, natural gas and renewable energy consumption. While coal-fired generation has declined, the share of natural gas and non-hydro renewables has risen in response to changes in economic conditions, government regulations and environmental concerns.
- In 2011, coal accounted for just over 40 per cent of electricity generation in the U.S. and 13 per cent of electricity generation in Canada. Coal remains the most common source of electric power in the U.S., but the share of coal-fired generation has been declining in both countries, largely because of the increased use of natural gas and policy initiatives such as the Ontario coal phase-out.
- In the short term, displacement of coal-fired generation with natural gas-fired generation occurs when natural gas is priced competitively compared with coal. Recently, natural gas-fired generation matched or exceeded coal-fired generation. In April 2012, coal and natural gas each accounted for 32 per cent of total generation in the U.S. In the same year, the share of natural gas-fired generation rose above the share of coal-fired generation in Canada.
- There has been less coal-to-gas switching in 2013 as natural gas prices have risen from the lows seen in 2012. However, U.S. and Canadian government policies will likely discourage the use of coal in the long run.
- In Canada, federal regulations enacted in 2012 stipulate that coal-fired plants starting operations after 1 July 2015 must not emit more than 420 metric tons of carbon dioxide (CO2) per gigawatt-hour, often referred to as a level consistent with high-efficiency natural gas plants. Existing facilities that do not meet this standard retire either after 50 years of operations, or at the end of 2019 or 2029 (depending on their commissioning date), whichever date comes first. In order to comply with these new rules, coal plants will likely have to install carbon capture and storage (CCS) equipment. As a result, the share of coal-fired generation is expected to steadily decline in Canada.
- In the U.S., several regulations now place a limit on the level of mercury, sulfur dioxide, nitrous oxides and other pollutants emitted by coal-fired plants. The U.S. regulations include, among others, the National Ambient Air Quality Standard, the Mercury and Air Toxics Standards, the Clean Air Mercury Rules and the Clean Air Interstate Rules. In addition, lower capital costs provide an incentive for building natural gas plants instead of coal plants.
- Investments necessary to ensure coal plant operators’ compliance with those standards increase the cost of coal-fired generation. Rules that are even more stringent are proposed in the U.S., which, if adopted, could prevent the construction of new coal-fired plants using existing technology because such plants would be unable to comply with the standards and remain competitive in the market. In its most recent outlook, the EIA projects that only three per cent of capacity additions in the U.S. from 2012 to 2040 will come from coal plants. In contrast, the EIA projects natural gas-fired plants will account for 63 per cent and renewables for 31 per cent of capacity additions.
- On a percentage basis, non-hydro renewables such as wind, solar and biomass have been the fastest growing source of generation in both countries. Government incentives, such as federal tax credits and state-level policies in the U.S. and renewable energy targets and standards in Canada, contributed to this growth. Between 2005 and 2012, wind and solar generation increased sevenfold in the U.S. and generation from all non-hydro renewables almost doubled in Canada. Consequently, the share of generation produced from non-hydro renewable sources in 2012 reached three per cent in Canada and five per cent in the U.S.
- The IEA noted in its 2012 WEO that the role of nuclear power has been scaled back since the accident at the Fukushima Daiichi power station in 2011. Total world nuclear generation decreased by nine per cent and seven per cent in 2011 and 2012, respectively. Many countries have reviewed their nuclear energy policies, while increased natural gas use in North America have challenged nuclear power’s competitiveness for new capacity.
- Policies and regulations that affect the power sector, as well as the relative economics of various power sources, continue to evolve. These factors are important determinants of the projected electricity supply mix. In this analysis, both coal-to-gas switching and growth in non-hydro renewable generation are expected to continue over the long term. Although no new nuclear capacity is projected to come online, planned refurbishments in Ontario are included in the projections.
Canadian Energy in the North American and Global Marketplace
Oil Transportation Infrastructure and Price Differentials
- Energy transportation infrastructure in North America typically responds to changes in supply and demand trends, with sufficient capacity usually in place to accommodate production increases. Production of tight oil in the U.S. has grown rapidly and at a much quicker pace than many market observers had expected. In addition, many expected the Keystone XL project to start providing new oil pipeline capacity beginning in 2012, but that project still awaits a final U.S. decision. As a result, oil transportation infrastructure developments fell behind changing supply trends throughout much of 2011 and 2012.
- Rapidly increasing tight oil supply, combined with steadily increasing oil sands production, led to a glut of oil in the mid-continent region of the U.S., creating pipeline bottlenecks at key points in the North American pipeline system.
- The West Texas Intermediate (WTI) oil price, considered the North American benchmark oil price, is determined at Cushing, Oklahoma where many oil pipelines interconnect. As production rose, the hub became a key pipeline bottleneck in 2011, lacking adequate capacity to move growing crude inventories outward from the mid-continent.
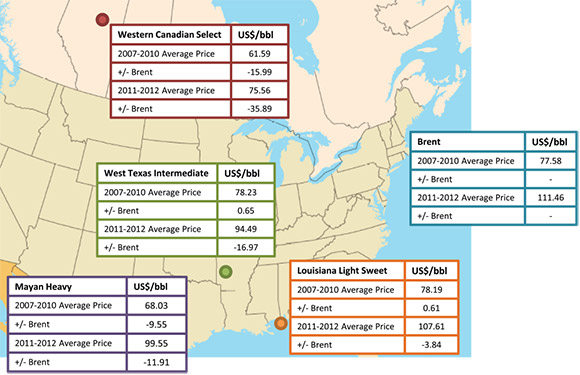
- Prior to 2011, WTI closely tracked international oil prices such as Brent, the European benchmark oil price. In response to the oversupply of crude at Cushing, WTI became discounted relative to Brent commencing in 2011, as shown in Figure 2.5. At the same time, geopolitical events and production issues in the North Sea (the pricing point of Brent crude) put upward pressure on the Brent price. Combined, these factors resulted in WTI averaging nearly US$17/bbl below Brent through 2011 and 2012.
Figure 2.5 - Benchmark Oil Prices
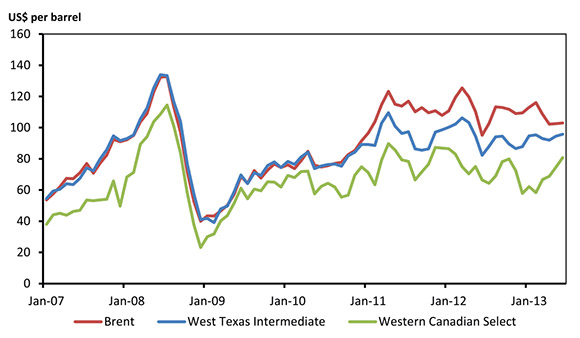
- Other oil transportation bottlenecks developed further upstream of Cushing, resulting in further price discounts for some producers, especially heavy oil producers in Canada. The key pricing benchmark for Canadian heavy crude, Western Canadian Select (WCS), traded US$16.64/bbl below WTI from 2007 to 2010. In traditional market conditions, this lower price reflects the transportation costs of shipping Canadian heavy oil to market and the lower quality of WCS compared to WTI crude. Throughout 2011 and 2012, the WCS price traded on average nearly US$19/bbl below the WTI price and the differential was at times volatile, with the monthly average differential widening to more than US$30/bbl on a few occasions.
- Refinery outages and reconfigurations also affected differentials, and explained a large part of the volatility in the WTI-WCS spread. Maintenance at several heavy oil refineries in the mid-continent contributed to the glut of oil and exacerbated price differentials. As well, the BP Whiting Refinery, located in Indiana, was operating at reduced capacity while undergoing changes to allow refining of substantially higher heavy crude volumes. This resulted in producers selling additional heavy crude into an already oversupplied mid-continent market.
- Figure 2.6 demonstrates that, while prices for inland crude have been discounted relative to international prices for the past several years, prices for crude in locations that are linked to the international marketplace via access to coastal ports, such as Louisiana Light Sweet in the U.S. Gulf Coast, tracked international oil prices more closely. The Mayan crude price, a benchmark price for heavy oil produced in Mexico, is also included in the figure. Mayan Heavy represents crude with quality similar to WCS, but with greater access to international oil markets.
Figure 2.6 - Benchmark Oil Prices and Price Differentials
- In early 2013, the Brent-WTI and WTI-WCS differentials began to narrow. Several pipeline projects aimed at relieving key bottlenecks were put into service, such as the Seaway pipeline reversal that added capacity to move more oil from Cushing to the U.S. Gulf Coast. Oil producers also increasingly utilized rail to avoid pipeline bottlenecks and to access higher priced markets in North America. An expansion of the Marathon refinery in Detroit was completed and the major components of the BP Whiting Refinery conversion were put into service in July of 2013, adding additional heavy oil refining capacity in the U.S. Midwest. By mid-2013, price differentials between Brent, WTI and WCS moved closer to historical levels, suggesting the oversupply condition in the mid-continent region was alleviated, at least for the time being.
- Many market observers have noted that expectations for continued growth in oil sands and tight oil production are dependent on adequate transportation infrastructure being in place and sufficient markets for crude oil being found. For the purposes of this analysis, adequate infrastructure and sufficient markets are assumed to exist throughout the projection period. If these assumptions do not hold, pipeline constraints and price differentials will likely impact oil producers, and the broader energy system, in coming years. This is a key uncertainty to projections in EF 2013.
Oil Transportation by Rail
- The pipeline bottlenecks and price differentials described above have encouraged oil shippers to seek alternative methods to move oil to markets.
- Shippers in the U.S. and Canada are increasingly transporting oil by railroad. The flexibility provided by rail transportation allows oil to be delivered from regions lacking pipeline capacity to nearly anywhere in North America with a rail unloading facility.
- Oil transportation by rail has been used at particularly high levels in the rapidly growing shale and tight oil plays of the U.S. By using existing rail facilities and adding new loading facilities, rail transportation can usually be added in a shorter timeframe than building pipelines. Oil production in North Dakota’s Bakken oil play increased from an average of 27.2 106m³/d (171 Mb/d) in 2008 to average 105.5 106m³/d (664 Mb/d) in 2012.[10] Over that period, pipeline capacity grew from 43.2 106m³/d (272 Mb/d) to 73.6 106m³/d (463 Mb/d) while rail loading capacity grew from 4.8 106m³/d (30 Mb/d) to 104.9 106m³/d (660 Mb/d).[11]
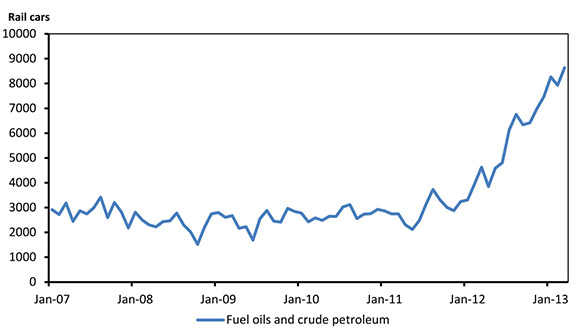
- In Canada, rail represents a small but growing proportion of oil transportation. In 2012, rail cars shipping fuel oil and crude petroleum grew from approximately 3 000 cars to 8 000 by the end of the year according to Statistics Canada (Figure 2.7).
Figure 2.7 - Railway Car Loading, Fuel Oils and Crude Petroleum, Western Canada
- In this analysis, energy transportation infrastructure is assumed to be built as needed. Specific assessments regarding oil transportation by rail is not part of this analysis. However, in the short term, it is likely that rail will continue to play an important role in providing additional oil transportation capacity.
- In the medium term, the utilization of oil by rail transportation in Canada is related to the addition of pipeline capacity out of the Western Canada Sedimentary Basin (WCSB). If additional pipeline capacity is not built, it is possible that the price differentials noted earlier will widen again, encouraging producers to increase their use of rail transportation. On the other hand, additional pipeline capacity could help to lessen price differentials and slow the demand for shipping crude by rail.
- Any further rules or regulations related to concerns about increased railway traffic from a safety and environmental perspective could impact the utilization of crude transportation by rail.
Changing Natural Gas Flows in North America
- In recent years, dramatic changes in gas production trends, both in terms of volume and location, have impacted traditional North American gas flows.
- In 2005, nearly a quarter of gas production in Canada, the U.S. and Mexico originated in the WCSB. Traditional markets for WCSB production include Ontario, Quebec and the U.S. Northeast, as well as the U.S. Midwest and Pacific Coast.
- Declines in natural gas prices have reduced drilling activity for conventional gas in the WCSB in recent years, with production trending down since 2006. Production in Alberta, B.C. and Saskatchewan totaled 478.0 106m³/d (16.9 Bcf/d) in 2006. By 2012, production had declined to 389.4 106m³/d (13.7 Bcf/d) (Figure 2.8), less than 17 per cent of North American gas production.
Figure 2.8 - B.C., Alberta and Saskatchewan Combined Production and Consumption
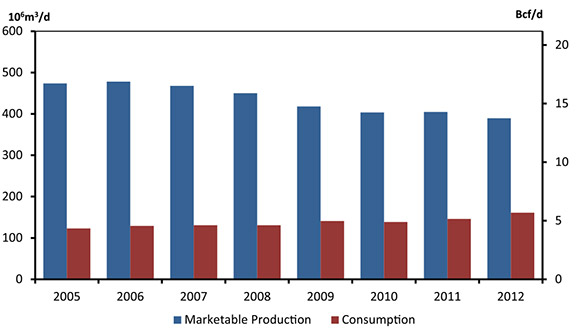
- At the same time, demand for gas in the region has increased. Natural gas consumption in B.C., Alberta and Saskatchewan increased from 129.1 106m³/d (4.6 Bcf/d) in 2006 to approximately 160.9 106m³/d (5.7 Bcf/d) in 2012. Much of the increase was because of growing natural gas consumption in the oil sands. Growing consumption and decreased gas production and has resulted in declining volumes of gas being shipped out of the WCSB.
- Other dynamics have also factored into changing gas flows in North America. In particular, some emerging shale gas areas in the U.S. are located close to markets traditionally served in part by WCSB gas. A prime example is the Marcellus shale in the U.S. Northeast, spanning much of Pennsylvania, West Virginia and New York State. Pennsylvania production increased from 20.8 106m³/d (733 MMcf/d) in early 2010 to 134.8 106m³/d (4.8 Bcf/d) by the end of 2011.
- Increasing production in the Marcellus has reduced the need for Canadian exports to the U.S. Northeast. Combined export volumes at Ontario and Quebec border points fell from 65.2 106m³/d (2.3 Bcf/d) in 2006 to 25.6 106m³/d (904.4 MMcf/d) in 2012.
- Meanwhile, gas imports into Canada, most of which are delivered into Ontario and Quebec, increased from 26.6 106m³/d (938.1 MMcf/d) in 2006 to 80.6 106m³/d (2.8 Bcf/d) in 2012. A number of traditional export pipelines in Ontario have been altered to permit bi-directional gas flow and allow additional imports from the U.S. when required.
- In the Reference Case, WCSB gas production continues to decline until 2018. Also, gas consumption in Alberta, B.C. and Saskatchewan continues to increase. Combined, these projections imply that gas shipped out of the WCSB will continue to decline in the medium term. The specific path of future gas flows is not covered in this analysis and is subject to a number of uncertainties, including gas supply and demand, infrastructure developments and pipeline tolls.
- While future gas flows are beyond the scope of this report, the North American gas market is highly integrated, gas resources in both Canada and the U.S. are abundant, and market forces operate to balance supply and demand. As a result, it is expected that sufficient supplies will exist to meet Canadian gas demand.
LNG Exports from Canada and the U.S.
- The North American gas market is continental in nature, with the balance between domestic supply and demand largely determining natural gas prices.
- Outside of North America there are a variety of markets with their own supply, demand and pricing dynamics. Some regions have limited domestic gas supplies and rely on imported gas to meet much of their natural gas demand. Others produce natural gas in excess of their domestic needs. When pipelines are not feasible, LNG can connect these markets, linking exporters and importers.
- LNG is natural gas that is chilled to -162°C, at which point it becomes a liquid. In its liquid form, it is much more energy-dense than when in a gaseous state, making it economic to ship in specially designed vessels and vehicles.
- LNG has been traded globally since the mid-1960s. Since then, the volume of global LNG trade has increased steadily to an estimated 237.7 million tonnes per annum (MMtpa) in 2012.[12] In gaseous form, this is approximately equivalent to 898.4 106m³/d (31.7 Bcf/d), just over 10 per cent of global gas consumption.
- The top five LNG exporters in 2012 were Qatar, Malaysia, Australia, Nigeria and Indonesia, which together were responsible for 67 per cent of LNG exports. Seventy per cent of total LNG shipments were delivered to Asia in 2012, with Europe the second largest importer.
- Most LNG importers acquire the majority of their gas supply through long-term contracts to ensure supply reliability. The contract prices are often linked to the crude oil price. In 2012, prices for LNG in Korea and Japan ranged from US$13/MMBtu to US$18/MMBtu.
- International natural gas prices that are above prices in North America have led natural gas producers and other market participants to propose LNG export terminals in North America.
- In Canada, a number of proposals have been announced to export LNG. At the time of writing, the NEB has issued long-term licences for three of these proposals, all for exports on the B.C. Coast. Five more applications were under review by the Board at the time of writing, four proposing to export LNG from the B.C. Coast. The Jordan Cove application is to export natural gas by pipeline to the U.S., to support a proposed LNG export facility in Oregon. Currently none of the proponents have announced final decisions on whether they will go ahead with their projects.
- In the U.S. there have also been several proposals to export LNG to countries that the U.S. does not have a free trade agreement with. Most of these proposed facilities are located on the U.S. Gulf Coast. At the time of writing, the U.S. Department of Energy had granted three export authorizations, allowing the holders to export LNG globally. The natural gas equivalent of the authorizations totals 158.6 106m³/d (5.6 Bcf/d).
- The analysis in EF 2013 assumes 28.3 106m³/d (1.0 Bcf/d) of LNG exports from the B.C. Coast in 2019, increasing to 56.6 106m³/d (2.0 Bcf/d) in 2021 and 85.0 106m³/d (3.0 Bcf/d) by 2023. It is important to note that this is an assumption as opposed to a view on eventual LNG export volumes. This assumption allows for analysis of other key outcomes, such as gas production, energy demand and macroeconomic projections. This volume is not associated with any particular Canadian project shown in Table 2.1 or any other proposed projects.
Table 2.1 - Long-term Natural Gas Export Licences and Applications Under Review as of 1 October 2013
| Proponent | NEB Export Licence | Date issued | LNG Volume (approximate natural gas equivalent) |
|---|---|---|---|
| KM LNG | GL-298 | November 2011 | 10 MMtpa (36.3 106m³/d, 1.28 Bcf/d) |
| B.C. LNG Export Co-operative | GL-299 | April 2012 | 1.8 MMtpa (6.6 106m³/d, 232 MMcf/d) |
| LNG Canada | GL-300 | February 2013 | 24 MMtpa (91.6 106m³/d, 3.23 Bcf/d) |
| Prince Rupert LNG | N/A | Under Review | 21.6 MMtpa (82.4 106m³/d, 2.91 Bcf/d) |
| WCC LNG | N/A | Under Review | 30 MMtpa (113.3 106m³/d, 4.00 Bcf/d) |
| Pacific NorthWest LNG | N/A | Under Review | 19.7 MMtpa (77.6 106m³/d, 2.74 Bcf/d) |
| Woodfibre LNG | N/A | Under Review | 2.1 MMtpa (8.1 106m³/d, 288 MMcf/d) |
| Jordan Cove LNG | N/A | Under Review | 43.9 106m³/d, 1.55 Bcf/d |
- The eventual volume of LNG exports may be higher or lower than assumed in this analysis. Key uncertainties include North American natural gas prices, competition from other LNG supply basins, the pace of LNG demand growth, and the ability of Canadian LNG proponents to secure contracts with buyers. These, and other market factors, will determine the eventual volumes of LNG exports from Canada.
Electricity Exports, Imports and Interprovincial Trade
- Electricity markets differ from other commodity markets in several key ways. The inability of electricity to be easily stored in commercial quantities is the most significant difference. In contrast with oil and gas markets, where pricing is often set on a global or continental basis, electricity trade and pricing is more regional. Despite these differences, the highly-integrated North American electricity market has been affected by many of the key trends discussed previously in this chapter.
- Canada is a net exporter of electricity to the U.S., and large amounts of electricity are also transferred between provinces. Interprovincial and international electricity trade benefits the reliability of electric grids. By linking regions, provinces and states can take advantage of having different peak periods, based not only on the time of day, but also on the time of year. Seasonal peaks in Canada occur primarily during the winter heating season while peaks in the U.S. occur mostly in the summer air conditioning season.
- While factors such as proximity to demand and existing infrastructure are important, regional development of electricity supply is primarily influenced by the cheapest fuel source available in a given region. Historically, provinces that have exported large amounts of power are those with hydro-based generation. More electricity tends to be exported in high precipitation years, when hydroelectric reservoirs are well supplied.
- The economic downturn of 2009 reduced continental electricity demand. Canada is only now returning to pre-recession electricity demand levels. In the U.S., overall demand has remained below its peak level in 2007. Lower demand levels and lower natural gas prices have resulted in lower wholesale electricity prices throughout North America. Prices in many regions to which Canada exports fell by roughly half between 2008 and 2012.
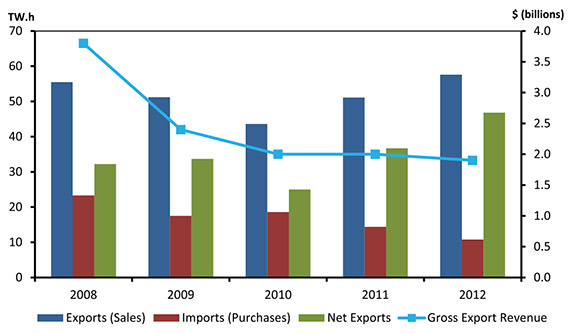
- Supply-demand conditions, including high Canadian hydroelectric reservoir levels, resulted in record Canadian net exports in 2012. Annual net exports were 45 per cent higher in 2011 compared with 2010. In 2012 net exports were 47 TW.h, because of record high exports of 58 TW.h and lower imports of 11 TW.h.
- Although the quantity of electricity exports is higher, prices are lower, reducing export revenues compared with historical revenues. For example, in 2008 exports of 56 TW.h were valued at $3.8 billion in revenue, whereas the 2012 exports of nearly 58 TW.h sold for only $1.9 billion.
Figure 2.9 - Annual Canadian Electricity Exports, Imports and Export Revenue
- Based on the economic and electricity demand outlooks, wholesale electricity prices are expected to remain low for the next several years. At present, there are many uncertainties surrounding the economics of building generation and transmission facilities to produce and export electricity. Without a guarantee of long-term export contracts and higher wholesale electricity prices, some large hydro plant proposals, such as Conawapa in Manitoba and Gull Island in Labrador, are not assumed to be built in the projection period. Some large capital-intensive infrastructure projects, such as new nuclear builds in Ontario, are also not included in the projections, in part due to the availability of lower cost generation, including imports from other regions.
- In the Reference Case, net electricity available for export is projected to remain near current levels until 2030. By 2035, net electricity available for export is projected to return to historic levels, declining to 30 TW.h annually compared with 47 TW.h in 2012. Interprovincial electricity transfers are projected to slightly decline from 52 TW.h in 2012 to 51 TW.h in 2035.
Chapter 3: Key Drivers
- EF 2013 considers three cases - a Reference Case, which reflects a moderate view of future energy prices and economic growth - and two sensitivity cases. These sensitivity cases represent a range of possible outcomes for the Canadian energy system over the projection period. Higher and lower crude oil and natural gas prices characterize the sensitivity cases, referred to as the High Price and Low Price Cases.
Energy Prices
Crude Oil Prices
- In the Reference Case, the WTI crude oil price is assumed to average US$95/bbl in 2013. As shown in Figure 3.1, the price in 2012 dollars stays flat at US$95/bbl until 2016 when it begins to slowly increase over the projection period, reaching US$110/bbl by 2035. Growing tight and shale oil production have increased global supply. However, strong oil demand from developing countries offsets this supply growth and contributes to the gradual price increase over the projection period. The WTI crude oil price is 16 per cent higher in 2035 compared with 2013.
Figure 3.1 - WTI Crude Oil Price at Cushing, Oklahoma, All Cases
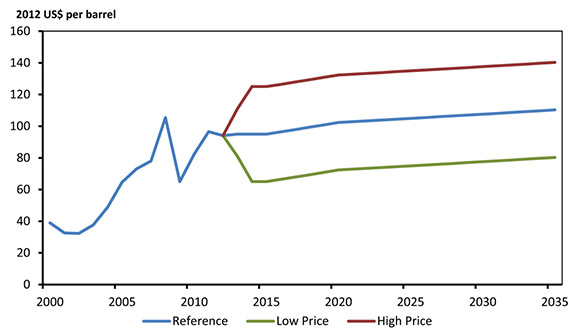
- In the Low Price Case, the WTI crude oil price is assumed to be US$30/bbl below the Reference Case price throughout the projection period, reaching US$80/bbl in 2035. In the High Price Case, it is assumed to be $30 higher than the Reference Case price, rising to US$140/bbl by 2035.
- As noted in Chapter 2, throughout 2011 and 2012, the WTI oil price was at a significant discount to the Brent price, a major crude oil price marker in Europe. Historically, the two prices have closely tracked one another. By mid-2013, WTI and Brent prices were moving closer together again, as oil infrastructure developments helped alleviate the oversupply of oil in the midcontinent of North America. The traditional relationship between WTI and international oil prices is assumed to continue to hold throughout the projection period.
Natural Gas Prices
- The Henry Hub price for natural gas in the Reference Case is assumed to increase from US$3.90/MMBtu in 2013 to US$6.20/MMBtu in 2035 (in 2012 dollars) as shown in Figure 3.2. The Henry hub natural gas price is nearly 60 per cent higher in 2035 compared with 2013.
Figure 3.2 - Henry Hub Natural Gas Price at Louisiana, All Cases
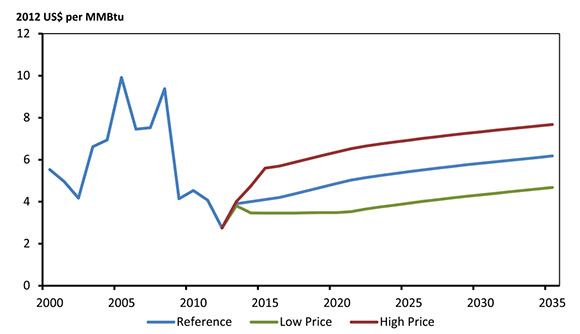
- In the Low Price Case, the natural gas price is assumed to reach US$4.70/MMBtu by 2035 and US$7.70/MMBtu in the High Price Case.
Electricity Prices
- Electricity prices are largely determined in regional markets. Consumer prices for electricity are mainly composed of generation, transmission and distribution costs. Prices are generally lowest in the hydro-based provinces (B.C., Manitoba, and Quebec), which benefit from a high proportion of low-cost heritage assets. These assets are often many decades old and their capital costs are largely paid off.
- Prices in most jurisdictions are based on the actual cost of providing service to consumers, including a regulated rate of return on the generation, transmission and distribution assets. Provincial and, in some cases, municipal regulators are responsible for approving these costs. All provinces and the territories follow this model, except Alberta and Ontario, which operate wholesale electricity markets. In Alberta, competitive wholesale markets determine wholesale electricity prices, from which consumer rates are derived. In Ontario, while the wholesale market determines spot prices, most of the generators receive fixed or regulated prices, making the market a hybrid of the two methodologies.
- Typically, prices tend to be higher for residential customers and lower for large volume industrial customers, reflecting the cost of serving these markets. In addition, large customers may have direct access to wholesale markets where power costs can be lower than the rates offered by the retail distribution utilities.
- In the Reference Case, the average retail electricity price (including the residential, commercial and industrial prices) is approximately 20 per cent higher in 2035 compared with 2013, in real dollars. This reflects the increasing cost of sourcing new generation and planned improvements to transmission systems. Electricity prices in the sensitivity cases vary moderately from the Reference Case, influenced by the change in natural gas and oil prices, as well as differences in electric demand and generation.
Economic Growth
- The Canadian economy is a key driver of the energy system. Economic growth, industrial output, inflation, exchange rates and population growth are key macroeconomic factors that influence the energy supply and demand outlook.
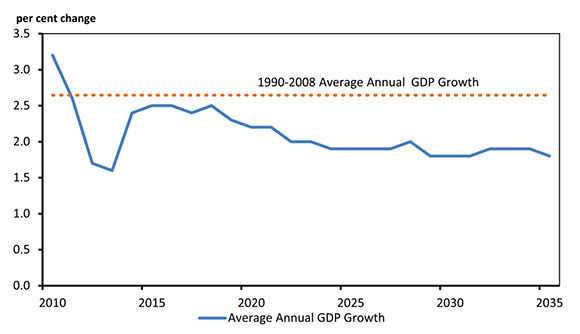
- As shown in Figure 3.3, Canadian real gross domestic product (GDP) growth is projected to be 1.5 per cent in 2013. From 2012 to 2035, the average annual real GDP growth rate is 2.0 per cent. This is a moderation in growth compared to the historical trend; annual real GDP growth was 2.6 per cent over the 1990 to 2008 period.
Figure 3.3 - Annual GDP Growth, Reference Case
- Demographics play a key role in the long-term macroeconomic projections. Canadians born between 1946 and 1965, referred to as baby boomers, represent a large segment of the current workforce. The oldest boomers have begun to reach retirement age and the rate of retirements accelerates over the projection period. Therefore, the proportion of the population that is of working age will shrink over the projection, creating slower labour force growth compared to the historical trend. This is a key factor moderating economic growth.
- Developing nations, such as China and India, recovered quickly from the global economic downturn in 2009 and have grown rapidly compared to developed nations in recent years. These markets are a growing source of demand for Canadian natural resources and manufactured goods. Economic growth in these regions remains elevated over the projection period and drives growth in Canada’s export-oriented sectors.
- Regionally, economic growth in the Reference Case is strongest in the western provinces and territories, driven by growth in the mining and oil and gas industries. With an average annual growth rate of 2.5 per cent per year over the projection period, Alberta has the strongest economic growth. Combined, Quebec and Ontario’s annual GDP growth averages 1.9 per cent, slightly lower than the national average. Growth is slowest in Atlantic Canada because of slower population growth and declining offshore oil and natural gas production in the long term.
Key Uncertainties to the Outlook
- Energy prices are a key uncertainty to the macroeconomic projections. The High and Low Price Cases capture some of the potential uncertainty. However, the possibility of prices outside the chosen range exists, as do dramatic short-term price swings, which could have future implications for the projections.
- Economic conditions can have a significant impact on the Canadian energy system. Several key uncertainties could impact the economic drivers and hence the energy supply and demand projections described in the following chapters.
- International demand for Canadian goods will influence export-oriented industries, many of which are relatively energy-intensive. Faster or slower economic growth in the U.S., Canada’s largest trading partner, would impact the economic and energy demand projections. Also, the sustainability of rapid economic growth in many emerging markets is a key uncertainty to the projections.
- Existing and future monetary policy could impact the macroeconomic and energy projections. Internationally, monetary stimulus was put in place following the 2008-2009 global recession. The timing and impact of the removal of that stimulus is uncertain, as is the long-term impact on interest rates and inflation.
- Large natural resource extraction developments in the mining and oil and gas sectors contribute to the macroeconomic projections in a number of provinces. The pace of these developments is uncertain and could contribute to higher or lower economic growth.
- As noted earlier, the Reference and sensitivity cases include only policies and programs that are law or near law at the time of writing. As a result, any policies under consideration, or new policies developed after the projections were completed, are not included in this analysis.
Chapter 4: Energy Demand Outlook
- In this analysis, end-use (or secondary) energy demand includes energy used in four sectors: residential, commercial (includes institutional and pipelines), industrial, and transportation.[13] End-use energy demand excludes the energy used to generate electricity.
- Energy used to generate electricity is included under primary demand. The majority of this chapter focuses on end-use consumption by sector, with a brief section on primary demand included at the end. Chapter 7 includes further details on electricity generation and fuel mix.
- In the Reference Case, total end-use energy demand increases by an average of 1.1 per cent per year (Figure 4.1). This growth is led by the industrial sector, which grows at an annual average rate of 1.4 per cent. The average annual growth rates of the remaining sectors are less than one per cent. The residential and commercial sectors both grow at an annual average rate of 0.7 per cent, while the transportation sector grows at 0.8 per cent, over the projection period.
Figure 4.1 - End-Use Energy Demand by Sector, Reference Case
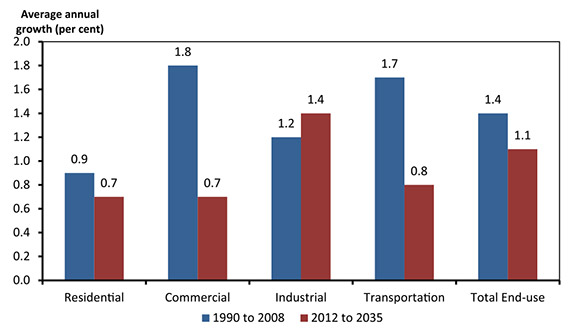
- Overall, energy demand growth slows compared to the historical trend, where demand grew at an average of 1.4 per cent from 1990 to 2008. The industrial sector, which grows slightly faster than the 1990 to 2008 rate of 1.2 per cent per year, is the largest growth area in the projection. Industrial growth is related to strong growth in natural resource industries, such as mining and the oil and gas sector, as well as other energy-intensive manufacturing sectors that gradually recover from the recent economic downturn. Demand growth projections in the residential, commercial, and transportation sectors are lower than historical levels. From 1990 to 2008, the residential sector grew at an average annual rate of 0.9 per cent, commercial by 1.8 per cent, and transportation by 1.7 per cent.
- Total energy intensity, measured as energy use per dollar of real GDP, decreases by an average annual rate of 1.0 per cent over the projection period. This continues the historical trend, where energy intensity declined by an average of 1.2 per cent per year from 1990 to 2008. Energy intensity is influenced by a variety of factors, including improvements in energy efficiency.
- The analysis includes those policies, programs and regulations that are law or near law. Several new initiatives are included in these projections that were not included in previous NEB outlooks. Two examples are freight transportation emission standards and the long-term passenger vehicle standards (covering 2017 to 2025). Although these regulations are set in terms of emission reductions, they are expected to result in improved vehicle fuel efficiency and lower energy demand projections in these sectors.
- Energy demand grows slightly faster in the Low Price Case, with an average annual rate of 1.2 per cent over the projection period. The High Price Case demand projection is lower than the Reference Case, averaging 0.8 per cent per year. Generally, higher prices put downward pressure on energy demand growth, and this is evident in the projections. However, this effect is somewhat offset by the oil and gas sector, where demand growth is lower in the Low Price Case and higher in the High Price Case, as energy use follows the production projections discussed in Chapters 5 and 6.
Energy Consumption by Sector
Residential Sector
- Residential energy use is the energy consumed by Canadian households. This includes energy used for space and water heating, air conditioning, lighting, large appliances, and other energy-using devices like televisions and computers.
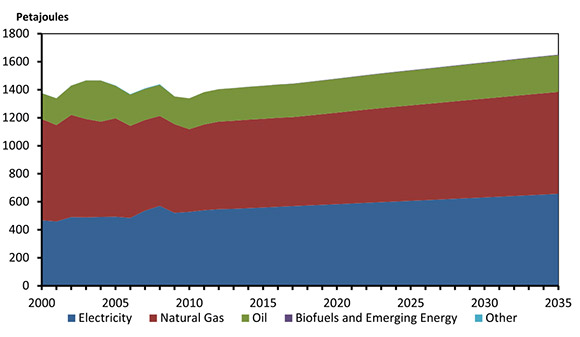
- In 2011, Canadian residential energy demand was 1 451 PJ, and accounted for 14 per cent of total Canadian energy demand. Residential energy demand increases at an average annual rate of 0.7 per cent over the projection period, reaching 1 730 PJ in 2035 (Figure 4.2).
Figure 4.2 - Residential Energy Demand, Reference Case
- Energy-use per square metre of residential floorspace declines at an annual average rate of 0.6 per cent over the projection period. Improvements in building shell construction practices, increased penetration of high efficiency heating appliances, substantial energy efficiency improvements in major home appliances and electronics, and new standards for lighting and water heating are key factors in this trend.
- Demand management programs, policies and regulations are important to residential demand projections. All provinces and territories have voluntary programs encouraging greater energy efficiency in new homes and equipment. Many of these programs offer incentives to consumers such as rebates, low-interest loans, and education and awareness campaigns. Three new amendments to the federal Energy Efficiency Act have increased minimum energy performance standards for several common home appliances. The phase-out of inefficient lighting comes into effect in 2014. A national effort resulting in a new National Building Code for commercial buildings had a spill-over effect on the home market as well.
- The types of energy used in the residential sector vary widely across Canada. Energy prices, end-use energy requirements and fuel regional availability determine the differences in energy mix between the various regions. Atlantic Canada primarily meets its energy needs with electricity, oil and biomass, as natural gas is newer to the region. Quebec, Manitoba and B.C. rely more on electric energy, given their relatively low cost hydroelectric supply. Alberta and Saskatchewan rely more heavily on natural gas than other provinces. The Ontario mix is composed mainly of natural gas and electricity, along with a moderate share of biomass and oil.
Commercial Sector
- The commercial sector is a broad category that includes offices, retail, warehousing, government and institutional buildings, utilities, communications, and other service industries. It also includes energy consumed by street lighting and pipelines. The buildings portion of the commercial sector uses energy for space and water heating, air conditioning, lighting, appliances and other devices. The pipeline portion uses energy to power pumps or compressors that move the oil and natural gas through the pipeline.
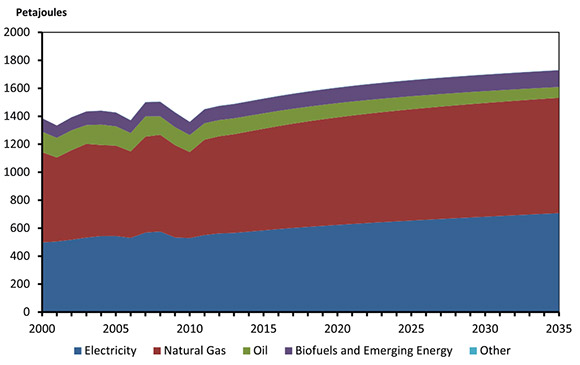
- In 2011, Canadian commercial energy demand was 1 382 PJ, and accounted for 13 per cent of total Canadian energy demand. Commercial energy demand increases at an average of 0.7 per cent per year over the outlook period, reaching 1 650 PJ in 2035 in the Reference Case (Figure 4.3).
Figure 4.3 - Commercial Energy Demand, Reference Case
- An extensively revised National Energy Code for Buildings (NECB) was finalized in 2011. This companion to the National Building Code puts a greater emphasis on energy performance in buildings than in the past. Minimum performance standards apply to building shell, HVAC, lighting, and electrical loads. It applies to new buildings, as well as to substantial renovations in existing ones. The code change is expected to improve energy performance in new commercial, institutional, and multi-unit residential complexes by 25 per cent compared to the previous code (1997). Adoption of the new NECB is ultimately up to the provincial, territorial, or, in some cases, municipal authority. This consensus-based revision had broad stakeholder support and is expected to have widespread uptake. As with the residential sector, some provinces had already stipulated building standards that meet or exceed NECB, and the trend going forward is a decreasing degree of difference between regions in terms of building efficiency.
Industrial Sector
- The industrial sector includes manufacturing, forestry, fisheries, agriculture, construction, and mining. In 2011, 80 per cent of industrial energy was consumed by a handful of energy-intensive industries, such as iron and steel, aluminum, cement, chemicals and fertilizers, pulp and paper, petroleum refining, mining, and oil and gas extraction.
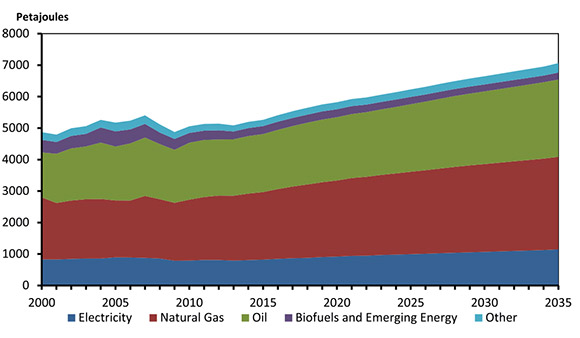
- The industrial sector makes up the largest share of Canadian end-use energy demand, accounting for 48 per cent, or 5 132 PJ, in 2011. It is also the fastest growing sector over the projection period, increasing at an average annual rate of 1.4 per cent to 7 064 PJ in 2035 (Figure 4.4).
Figure 4.4 - Industrial Energy Demand, Reference Case
- The Canadian industrial demand projection is closely related to the economic growth projections discussed in Chapter 3, as well as the projections of oil and gas production. Key trends that impact the Reference Case demand projection include: a gradual recovery in energy-intensive manufacturing industries following the recent economic downturn; strong growth in the oil sands;[14] growth in other natural resource industries such as mining; and, beginning later in the decade, gas production rebounding from recent declines.
- There are various utility demand-side management programs that focus on the industrial sector, as well as federal and provincial programs that aim for energy savings in this sector. These have been maintained or expanded in recent years. These programs can involve improvements in the energy efficiency of devices and equipment, such as more efficient boilers or motors. They may also involve process improvements, equipment maintenance and employee training to enhance energy efficiency and conservation.
- Quebec’s GHG cap-and-trade system is set to begin in 2013, covering large industrial emitters as well as the power sector. It will be broadened in 2015 to include fuel distributors.[15] In 2012 and 2013, the province worked with California in finalizing the link between their carbon markets as part of the Western Climate Initiative. Given these developments, this initiative is included in the Reference Case projections for Quebec.[16] This represents a key change from previous Energy Futures projections.
Transportation Sector
- The transportation sector includes passenger and freight on-road transportation, as well as air, rail, marine, and non-industrial off-road travel.
- The transportation sector accounted for 25 per cent of total end-use demand in 2011, or 2 642 PJ. It grows at an average annual rate of 0.8 per cent over the Reference Case projection to 3 210 PJ in 2035 (Figure 4.5).
Figure 4.5 - Transportation Energy Demand by Travel Type, Reference Case
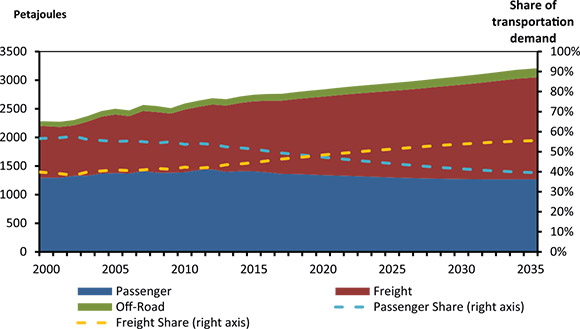
- Growth varies widely between the passenger and freight sectors. With the inclusion of longer-term passenger vehicle emission regulations (covering model years 2017 to 2025), energy demands related to passenger travel declines by an annual average of 0.6 per cent over the projection period.
- Energy demand for freight transportation is driven by growth in the goods-producing industries, and grows at an annual average rate of 2.0 per cent over the projection period. This trend is slower than the 1990 to 2008 historical average of 2.9 per cent per year. This shift is due to somewhat slower economic growth compared to the historical growth rate, as well as federal emission regulations coming into effect for freight trucks (model years 2014-2018). Although these regulations are specified in terms of vehicle emissions, they are expected to reduce future energy consumption by improving vehicle fuel efficiency.
- The 2011 Energy Futures Report included the near-term (2012-2016) passenger vehicle standards, but not the longer-term passenger or freight standards. The inclusion of these regulations in EF 2013 has a significant impact and represents a key change away from the historical trend, as well as from previous Energy Futures projections.
- In 2011, passenger travel accounted for 54 per cent of transportation demand, freight for 42 per cent, and the remainder in non-industrial off-road. In 2020 these shares reverse, with freight accounting for 56 per cent, and passenger for 40 per cent by 2035 (Figure 4.5). As gasoline is used primarily on the passenger side, and diesel in freight, this shift has implications for the use of these fuels. Over the projection period, motor gasoline consumption in transportation declines by 0.2 per cent per year, while diesel consumption increases by 1.6 per cent per year (Figure 4.6).
Figure 4.6 - Transportation Energy Demand by Fuel, Reference Case[a]

[a] Heavy fuel oil is used in marine and rail transportation. Biofuels include ethanol and biodiesel blended with petroleum products. Other includes natural gas, electricity, lubricants and propane.
- Canada’s Renewable Fuels Regulations set a minimum requirement of five per cent renewable fuel content in gasoline starting in December 2010. The regulations were amended to include two per cent renewable content in diesel starting mid-2011.
- Quebec, Ontario, Manitoba, and B.C. have programs and policies to support growth in EV and plug-in hybrid electric vehicles (PHEV), including rebates and pilot projects. In 2035, EVs and PHEVs use four PJ of electricity, or just over one TW.h. This is approximately equivalent to 500 000 EVs and PHEVs on the road.[17]
- There is also interest in natural gas (often LNG) for medium and heavy-duty trucks, particularly in operations where the vehicles return to central locations often and use key regional transport corridors. Several fueling stations are currently being constructed in key strategic highway locations, and several trucking companies have placed orders for natural gas fueled trucks. In the Reference Case, freight NGVs use 100 PJ or 7.4 106m³/d (260 MMcf/d) of natural gas in 2035, representing six per cent of total freight demand. This is approximately equivalent to 60 000 medium- and heavy-duty freight NGVs.[18]
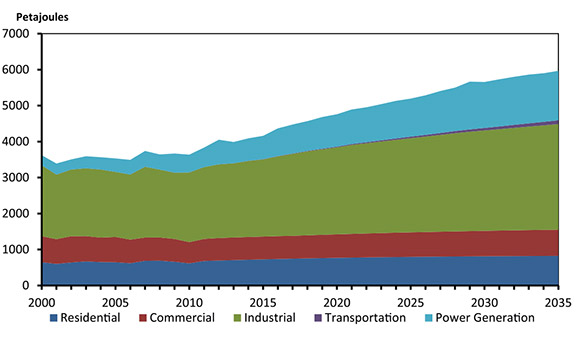
Primary Demand
- Primary demand is calculated by adding the energy used to generate electricity (including hydro, nuclear, and renewable) to total end-use (or secondary) demand, and then subtracting the end-use demand for electricity. Removing end-use electricity demand from the total is necessary to avoid double counting.
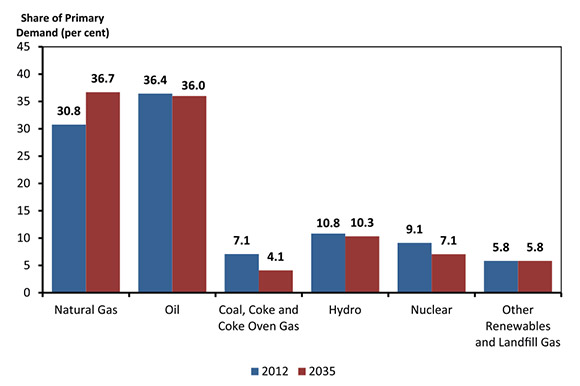
- Primary demand increases at an average annual rate of 1.0 per cent over the projection period. As shown in Figure 4.7, the fastest growing fuel is natural gas, which increases its share of overall primary demand from 31 per cent in 2012 to nearly 37 per cent in 2035. The share of coal and nuclear declines over the projection period, stemming from the electricity projections discussed in Chapter 8. The share of other renewable fuels remains constant, as growth in wind and other non-hydro renewable electric generation is offset by limited growth in end-use biomass consumption.
Figure 4.7 - Share of Fuel in Primary Energy Demand, Reference Case
- Natural gas is used heavily in the residential, commercial, and industrial sectors as well as for electricity generation. Figure 4.8 shows primary demand for natural gas, which grows at an annual average rate of 1.7 per cent over the projection period. This is an increase of over 1 900 PJ, or 148 106m³/d (5.20 Bcf/d) over the projection period, with the largest increases in the industrial and power generation sectors.[19]
Figure 4.8 - Primary Natural Gas Demand, Reference Case
Key Uncertainties to the Outlook
- Policies, programs, and regulations are continually under development at federal, provincial, territorial, and municipal levels to meet various government commitments, objectives, and targets. These may have significant implications for energy demand growth. A notable example is the continued implementation of the federal government’s sector-by-sector regulatory approach to reduce emissions. Recent transportation regulations are part of this initiative, and impact the transportation demand projections as described earlier in this chapter. Forthcoming regulated GHG performance standards for other sectors, such as the oil and gas sector, have the potential to affect energy use projections as well.[20]
- In recent years, the oil and gas industry has undergone rapid transformations in both the types of resources extracted, and the technologies used to extract them. Depending on the future development of these resources and technologies, the energy used in this sector may be higher or lower than these projections suggest. As the oil and gas sector is an important energy demand growth area, key uncertainties for the oil and gas production outlooks, described in Chapters 5 and 6, may impact the energy demand projections as well.
- In addition to oil and gas development, the mining sector is a significant natural resource industry for future energy demand projections. A variety of projects are in various stages of development across the country, such as the Ring of Fire developments[21] in Ontario, northern mining developments in Quebec, potash mining in Saskatchewan, and iron ore mining in Newfoundland and Labrador. Energy requirements often vary on a project-by-project basis and are key uncertainties going forward for regional energy demand, particularly electric load growth.
- The Reference Case includes modest penetration of several emerging technologies, such as EV and NGV in transportation, geothermal space heating, and solar hot water heating. Adoption of such technologies beyond the levels included in the Reference Case may change Canada’s future energy use mix and growth.
Chapter 5: Crude Oil Outlook
Crude Oil and Bitumen Resources
- Canada has abundant resources of crude oil, with an estimated remaining ultimate potential of 53.9 109m³ (339 billion barrels) as of December 2012. Of this, oil sands bitumen accounts for 90 per cent and conventional crude oil makes up 10 per cent. Alberta currently accounts for all of Canada’s bitumen resources. Efforts are ongoing to assess bitumen deposits in Saskatchewan, but an official estimate of resource size is not yet available. For conventional crude oil, 72 per cent of the estimated remaining resources are found in the frontier regions that include East Coast offshore, northern Canada and other frontier basins that are still relatively unexplored.[22] The more developed conventional light and conventional heavy oil deposits in the WCSB account for the remaining 28 per cent.
- Resources become reserves only after it is proven that economic recovery can be achieved. Canada has remaining oil reserves of 27.2 109m³ (171 billion bbls) as of December 2012, with 98 per cent of this attributed to oil sands bitumen, and the remaining to conventional oil sources. According to the Oil & Gas Journal,[23] Canada ranks third globally in terms of proven oil reserves, behind Saudi Arabia and Venezuela.
- There is considerable potential to add to Canada’s crude bitumen reserves. The Grosmont Carbonate formation accounts for 21 per cent of the oil sands resources in Alberta. Official recognition of reserves generally awaits proof of economic viability. This recognition may be closer with the approval of the first commercial project in the Grosmont by the Alberta government in July 2013.
- The application of horizontal drilling and multi-stage hydraulic fracturing has provided an opportunity to increase production from previously low-producing or unproductive oil reservoirs in the WCSB. This technology can also potentially be applied to other regions of Canada. While the U.S. EIA recently released a report indicating Canada ranked 10th in the world with 1.4 109m³ (9.0 billion barrels) of technically recoverable shale oil resources[24], these kinds of estimates are highly uncertain at this point in time because this extraction technology as applied to oil reservoirs is still in its early stages in Canada.
- Prospects for enhanced oil recovery (EOR) with CO2 flooding have increased through federal and provincial government financial support. Several projects in western Canada are designed to capture CO2 from large emitters and distribute it to candidate oil pools. There are currently two such projects in operation in Saskatchewan, and additional projects in Saskatchewan and Alberta are in the planning stage. The full impact of these initiatives will remain unclear for some time.
Table 5.1 - Remaining Ultimate Potential and Established Reserves, as of 31 December 2012
| WCSB[b] | Eastern Canada | Northern Canada[c] | Other | Oil Sands | Canada | |
|---|---|---|---|---|---|---|
| Remaining Ultimate Potential | ||||||
| 106m³ | 1343.9 | 624.3 | 1868.1 | 1500.0 | 48594.0 | 53930.3 |
| Billion Barrels | 8.5 | 3.9 | 11.8 | 9.4 | 305.8 | 339.3 |
| Remaining Established Reserves | ||||||
| 106m³ | 383.8 | 145.1 | 9.5 | 0.0 | 26686.0 | 27224.4 |
| Billion Barrels | 2.4 | 0.9 | 0.1 | 0.0 | 167.9 | 171.3 |
[b] Includes British Columbia, Alberta, Saskatchewan and Manitoba. For the purposes of this table, all resources and reserves from the Territories are included under Northern Canada.
[c] Includes onshore and offshore resources and reserves from Northwest Territories, Yukon, and Nunavut.
Canadian Crude Oil Production Outlook
- By 2035, Canadian crude oil production in the Reference Case reaches 928 10³m³/d (5.8 MMb/d), or nearly 75 per cent higher than in 2012. In 2035, oil sands account for nearly 86 per cent of production, compared with 57 per cent in 2012. Figure 5.1 illustrates the Reference Case oil production outlook.
Figure 5.1 - Total Canadian Crude Oil and Equivalent Production, Reference Case
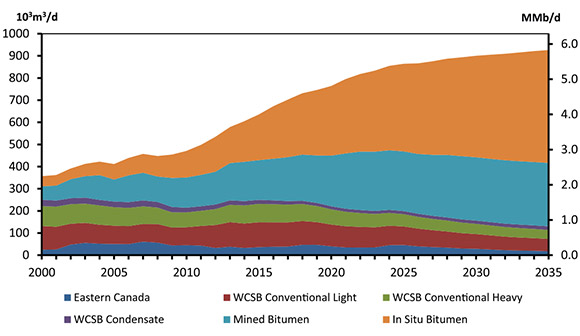
- In the near term, higher oil prices and lower natural gas prices continue to encourage more oil-directed drilling. In 2012 63 per cent of drilling efforts targeted oil, and the remaining 37 per cent targeted natural gas. This trend moderates over the projection period as natural gas prices increase from current levels.
- Oil sands activity continues to be robust, although investment interest has been dampened since mid-2012 by the higher and more volatile price differentials for heavy crude and bitumen.
- Conventional crude oil in the WCSB has reversed its long-standing declining trend. Production continues to ramp up as a result of the successful application of horizontal drilling and multi-stage hydraulic fracturing methods to tight oil reservoirs. As it is new technology, the full impact on future production levels remains unclear and therefore the incremental production volumes assumed in the projection are limited. Total conventional production declines resume in 2016.
- In Eastern Canada, offshore fields in Newfoundland and Labrador dominate production. Production in this area has been declining; however, a variety of additions leads to increases in the medium term. These include the addition of the Hibernia South and White Rose Extensions, and the Hebron Field, scheduled to begin production in 2017. In the Reference Case, an additional field is assumed to be discovered somewhere offshore Eastern Canada, and is assumed to commence operation by 2023. In the long term, production declines resume.
Oil Sands Production
- In the Reference Case, the WTI oil price, which increases from US$94.05/bbl in 2012 to US$110/bbl by 2035 (in 2012 dollars), is sufficient to promote active growth in oil sands production. Major operating companies have announced expansion plans and foreign entities are investing significant amounts of capital to buy oil sands interests, in many cases forming partnerships with Canadian companies.
- Investment has been shifting towards in situ steam assisted gravity drainage (SAGD) projects and away from mining and upgrading projects, as oil sands operators foresee better long-term market opportunities from heavy oil than from synthetic light oil. The cancelling of the Suncor/Total Voyageur project and increased momentum in building SAGD projects are examples of this.
- By 2035, Reference Case oil sands bitumen production reaches 796 10³m³/d (5.0 MMb/d), 2.6 times the production for 2012 (Figure 5.2). The majority of the growth occurs in the in situ category, as in situ projects tend to have better economics compared to mining projects. Also, 80 per cent of oil sands reserves are considered well-suited to in situ extraction, versus 20 per cent for mining methods.[25] Compared with the 2011 Energy Futures Report projections, in 2035, in situ production is up by three per cent, while mining production, including both stand-alone and integrated operations, is down by 9 per cent.
Figure 5.2 - Oil Sands Production and Projection Comparison, Reference Case
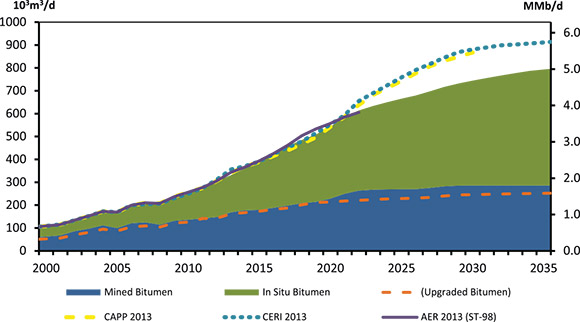
- Oil sands production forecasts released by the Canadian Association of Petroleum Producers (CAPP), the Alberta Energy Regulator (AER), and the Canadian Energy Research Institute (CERI) are compared with the NEB projections, in terms of total bitumen production (Figure 5.2). These projections are similar until 2021; by 2030 both the CAPP and CERI estimates are approximately 15 per cent higher than the NEB projection.
- The first five years of the projection period are characterized by projects already under construction or in the late stages of planning. Over the longer term, the list of currently proposed projects, many of which are in the early planning stages, suggest that bitumen production could potentially reach as much as 1.3 106m³/d (8.3 MMb/d) if most were to go ahead.[26] While this analysis involves a review of most proposed projects, greater emphasis is placed on defining a reasonable rate of growth, considering historical growth profiles, projected economic returns and capital expenditure requirements.
- In the Reference Case, the average annual growth rate between 2012 and 2022 is eight per cent for in situ projects and six per cent for bitumen mining projects. In the later part of the projection period growth rates ease, as higher production levels result in more need for maintenance capital and fewer high quality reservoirs remain untapped. The average annual growth rate between 2025 and 2035 is nearly three per cent for in situ projects and less than one per cent for mining projects.
Oil Sands Upgrading
- In early 2011, the Alberta government signed an agreement with North West Upgrading Inc. to process bitumen the province would receive under the provincial bitumen royalty-in-kind initiative.[27] Construction of this project is proceeding and upgraded bitumen from the first phase is assumed to start in 2017.
- Table 5.1 sets out estimates, based on publicly available industry information, of the cost to build a given type of oil sands project, and the oil price required to encourage a producer to undertake such a project. For example, integrated mining and upgrading projects are estimated to cost in the order of $100,000 to $120,000 per barrel of daily capacity (in 2012 Canadian dollars) to build, requiring an oil price of US$80 to $100/bbl (in 2012 dollars) to make a new project economic.
Table 5.2 - Estimated Initial Capital Expenditure (CAPEX) and Threshold Prices for New Oil Sands Projects
| CAPEX ($/bbl of capacity, C$2012) |
Economic Threshold[d] (WTI US$ equivalent/bbl, US$2012) |
|
|---|---|---|
| Mining, Extraction and Upgrading | $100,000-$120,000 | $80-$100 |
| Stand-Alone Mining and Extraction (No upgrading) | $55,000-$75,000 | $70-$100 |
| Standalone Upgrading | $55,000-$65,000 | $55-$65 |
| SAGD, Cyclic Steam Stimulation[e] | $25,000-$45,000 | $50-$80 |
[d] Includes a realistic after-tax rate of return, commonly in the order of 10 to 15 per cent.
[e] Types of in situ production
- Both mining and in situ operations provide bitumen feedstock to upgraders. According to the AER, essentially all mined production and seven per cent of in situ production was upgraded in 2012. In the Reference Case projection, upgraded bitumen volumes grow to 252 10³m³/d (1.6 MMb/d) by 2035, but do not keep pace with the overall increase in bitumen production. The portion of total bitumen production that is upgraded declines from 47 per cent in 2010 to 32 per cent in 2035. Over the period of 2011 to early 2013, the differential between light and heavy crude oil prices has been relatively wide at times before narrowing to traditional levels by mid-2013. As well, the rapid increase of light tight oil in the U.S. has intensified competition in markets for synthetic crude oil. These factors, combined with the very high capital costs of constructing upgraders, are not supportive of building greenfield upgrading facilities.
Natural Gas for Oil Sands
- Oil sands bitumen extraction is energy-intensive and requires natural gas as fuel and feedstock. In the projection, new technologies and efficiency enhancements decrease the intensity of gas use over time. Further, as operators gain experience with their projects they are able to make them more energy-efficient. For the Reference Case, gas use intensity is assumed to improve by 0.5 per cent annually.
- There are a number of solvent-added processes currently being used and others in the pilot stage that feature small amounts of solvents such as butane and propane added to the steam injected in SAGD and cyclic steam stimulation projects, with the goal of increasing recovery efficiency. There are also a number of pilot projects that are testing electrical-stimulation methods.
- In the Reference Case, requirements for purchased natural gas, including for cogeneration associated with oil sands projects, rise to 95.1 106m³/d (3.4 Bcf/d) by 2035 (Figure 5.3).
Figure 5.3 - Purchased Natural Gas for Oil Sands Extraction and Upgrading, Reference Case

Conventional Oil Production
- Figure 5.4 shows production for conventional crude oil in the WCSB. For Saskatchewan and Manitoba, the figures indicate a resurgence in production taking place over the period 2006 to 2016. For Alberta, the period of increased production extends from 2009 to 2017. In part, this is explained by increased activity due to higher oil prices. It is also indicative of the application of horizontal drilling and multi-stage hydraulic fracturing methods to tight oil plays, such as the Bakken play in Saskatchewan. Other formations, such as the Viking, Lower Shaunavon, Cardium, Slave Point, Belly River and Lower Amaranth also show increased production. Saskatchewan production has also benefitted from two CO2 flooding EOR projects, at Weyburn and Midale, which have been in operation for several years.
Figure 5.4 - WCSB Conventional Oil Production, Reference Case
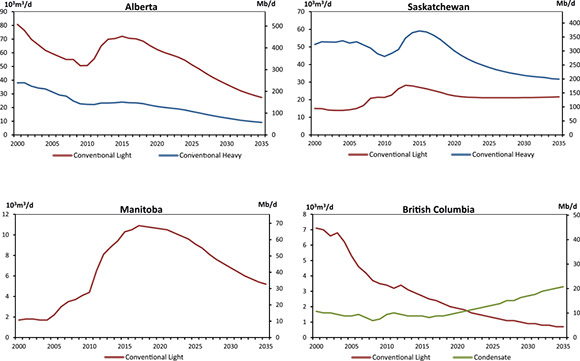
- In 2012, drilling activity continued to favour oil prospects, counter to the long-term historical trend of drilling more gas than oil wells. Horizontal drilling accounted for 85 per cent of the 5 900 oil wells drilled in Western Canada in 2012.
- Manitoba production has been increasing since 2006, with production projected to reach 10.9 10³m³/d (68 Mb/d) by 2017, before declining over the long term.
- In B.C., conventional oil production shows a consistent decline. However, volumes of condensate are growing because of increasing production of liquids-rich natural gas.
- Figure 5.5 illustrates the impact tight oil production has had on reversing the long-term trend of declining conventional oil production in the WCSB. By 2015, production is estimated to be about 64.5 10³m³/d (406 Mb/d) higher than it would be without tight oil production increases. The CAPP projection of total conventional crude oil production is considerably higher than the NEB projection, reflecting a higher long-term projection for tight oil development. Overall, tight oil development in Canada is in its early stages and this divergence of views is a reflection of the uncertainty involved. It is quite possible that resource estimates and production projections will need revisions in future analyses.
Figure 5.5 - WCSB Incremental Tight Oil Production, Reference Case
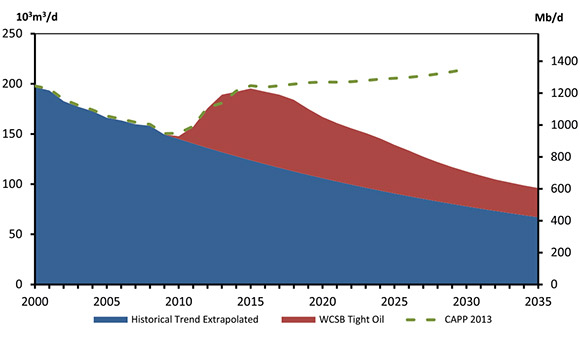
- In Canada’s North, Norman Wells and Cameron Hills are currently the only producing fields. No additional production from other areas in the North is included in the projections as much of the oil development is in the assessment and exploration stages. However, as shown in Table 5.1, significant oil resources exist in Canada’s territories, both onshore and offshore. Given the recent activity in the Canol Shale in the Northwest Territories and the Beaufort Sea, it is quite possible that the production projections for the North will be revised in future analyses.
Eastern Canada Oil Production
- Eastern Canada production includes relatively small amounts of oil production from Ontario, but primarily represents the Newfoundland and Labrador offshore fields (Figure 5.6). Production from Newfoundland and Labrador has been in decline since 2006.
Figure 5.6 - Eastern Canada Oil Production, All Cases
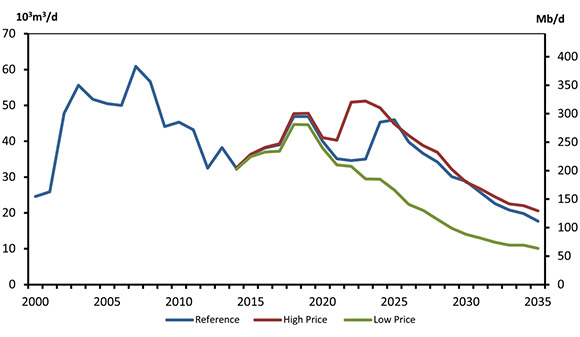
- A variety of additional offshore production comes online in the medium term. These additions reverse declining trend, but the decline then resumes in the long-term projection, in all three cases.
- For Eastern Canada, the Reference Case assumes a new offshore discovery of 500 million barrels in size, which begins production in 2023. In the High Price Case, this new discovery is assumed to come on two years earlier, in 2021, and higher prices also serve to extend the life of existing pools. For the Low Price Case, no new pool discovery is assumed.
Total Canada Oil Production
- The differences in the oil production projections reflect the oil price and natural gas price assumptions and the relative amount of investment available for resource exploration and development, for each respective case (Figure 5.7).
Figure 5.7 - Total Canada Oil Production, All Cases

- In the Reference Case, production reaches 928 10³m³/d (5.8 MMb/d) by 2035, double 2010 levels. In the High Price Case, production is just over 1.0 106m³/d (6.5 MMb/d), 12 per cent higher than the Reference Case. In the Low Price Case, production growth slows, but still reaches 696 10³m³/d (4.4 MMb/d) by 2035.
Supply and Demand Balance
- Net available oil supply is the amount of oil production that is available to the market after adjustments for processing losses, blending requirements for heavy oil and non-upgraded bitumen, and volumes of condensate diluents that are locally recycled. Upgrading yields vary among the different bitumen upgrading facilities, but in aggregate, approximately 85 per cent of bitumen feedstock is turned into a synthetic crude oil product. All of the non-upgraded bitumen and most of the conventional heavy production must be blended with a light hydrocarbon, usually condensate, to reduce its viscosity and allow it to meet specifications for pipeline transportation. It is estimated that 23 per cent of the total condensate used for blending is recovered in the upgrading facilities and refineries in Alberta and Saskatchewan, and returned for re-use.
- Typically, blended bitumen contains about 30 per cent condensate, while blended conventional heavy crude oil contains approximately seven per cent condensate. The rising volume of
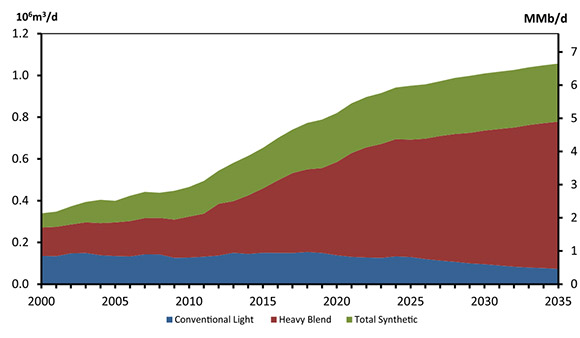 heavy blend (Figure 5.8) results in growing demand for condensate and other light hydrocarbon diluents. It is assumed that condensate imports or similar products from the U.S. or offshore sources, combined with the manufacture of diluents in Canadian refineries and upgraders, will meet most of the growth in diluent demand.
Figure 5.8 - Net Available Oil Supply, Reference Case
- To a small degree, butanes, synthetic crude oil and light conventional crude oil are also used for blending. Growth in volumes from these sources is difficult to predict, as it varies with relative demand, availability, and pricing of these components. For the purposes of this analysis, blending requirements are assumed to be met by 13.2 10³m³/d (83 Mb/d) of butanes, 8.5 10³m³/d (53 Mb/d) of light crude oil (synthetic and conventional) and 141.9 10³m³/d (893 Mb/d) of condensate by 2035. The requirement for imported condensate is estimated to be 125.7 10³m³/d (786 Mb/d).
- Required crude oil feedstock for refining is a function of petroleum product demand. The oil refining sector in Canada relies on both domestic and imported crude to produce the
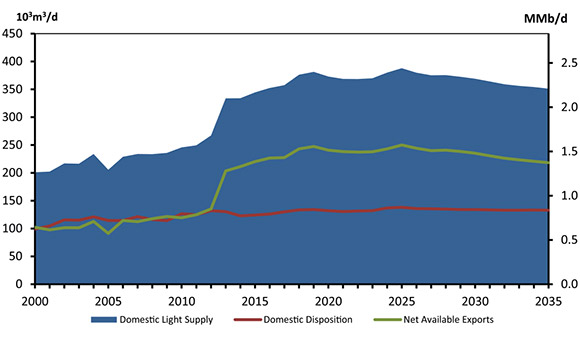 products that Canadians use. Canada also imports refined petroleum products, as it is economic to do so in some regions.
 - From 2012 to 2035, total Canadian refinery feedstock requirements rise by 5.6 per cent to 313.7 10³m³/d (2.0 MMb/d) in the Reference Case.
- Canadian crude oil available for export has been rising and will continue to respond to increases in supply from Alberta’s oil sands and changes in supply from conventional sources.
Figure 5.9 - Supply and Demand Balance, Light Crude Oil, Reference Case
- In the Reference Case, total crude oil (light and heavy) available for export rises 139 per cent to 883 10³m³/d (5.5 MMb/d) from 2012 to 2035. Light crude oil exports peak at 250 10³m³/d (1.6 MMb/d) in 2025 and gradually decline to 218 10³m³/d (1.4 MMb/d) in 2035 (Figure 5.9). The decline reflects lower production of light crude oil and flat domestic demand. Heavy crude oil exports rise by 182 per cent to 665 10³m³/d (4.2 MMb/d) reflecting increases in blended bitumen production from Alberta’s oil sands (Figure 5.10).
Figure 5.10 - Supply and Demand Balance, Heavy Crude Oil, Reference Case
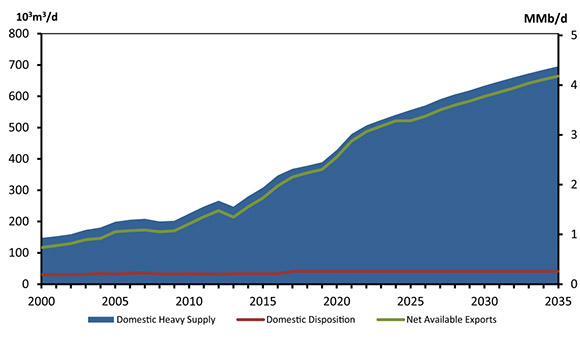
- Total oil available for export over the next 23 years grows by 172 per cent in the High Price Case and 67 per cent in the Low Price Case.
Key Ucertainties to the Outlook
- A key assumption in this analysis is that there will be sufficient infrastructure to deliver Canadian oil production to export markets. If this is not the case, there may be impacts on Canadian crude oil prices as discussed in Chapter 2, and there may be implications for future production growth. This analysis also assumes that markets will continue to be able to absorb Canadian exports. Continued rapid growth of tight oil production in the U.S., Canada’s primary oil export market, could reduce U.S. reliance on imported crude. The potential for Canadian oil exports to alternative markets is also uncertain. Whether these two key assumptions continue to hold is a major uncertainty in the energy projections in EF 2013.
- While these long-term projections envision gradually changing prices, it is likely that oil prices will be volatile, with possible price spikes in either direction possible. Production levels are closely correlated to the oil price the producers receive. A related uncertainty is the exchange rate. Oil exporters are paid in U.S. dollars, so an appreciating Canadian dollar would mean lower economic returns for Canadian producers.
- While the current outlook for cost inflation is relatively low, there are a number of large oil sands projects in the construction and planning stages. These projects will be competing for labour and materials from conventional oil and gas projects, as well as other large projects. Although companies have taken steps to control construction costs, cost inflation does have the potential to slow the pace of expansion.
- A shortage of skilled workers is developing as the workforce ages and overall demand for labour increases. According to the Petroleum Human Resources Council of Canada (PHRCC) the oil and gas industry needs to fill 36 000 job openings between 2013 and 2015, as a result of industry activity levels as well as age-related attrition. In the longer term, under a scenario of higher oil and gas prices, the PHRCC is predicting a requirement of 84 000 new hires by 2022. This challenge is being addressed through a number of government and industry initiatives, but a potential labour shortage may increase construction costs and slow the pace of oil development.
- Rules and regulations regarding oil sands development continue to evolve and represent an uncertainty for future projects.
- Industry and governments in many jurisdictions are currently examining issues related to multi-stage hydraulic fracturing. These include the amount of fresh water used in the fracturing process, the protection of groundwater from fracturing fluids, and the chemical composition and safe disposal of fracturing fluids. There is potential for any future rules and regulations regarding these developments to affect the pace and level of tight oil production.
- Over the outlook period, it is possible that technological breakthroughs will occur that accelerate the pace of development in conventional and/or oil sands resources.
Chapter 6: Natural Gas Outlook
Natural Gas Resources
- A key change since the 2011 Energy Futures Report is a major increase in estimates of Canada’s tight gas and shale gas resources. Ongoing resource development has provided insights to inform additional studies, including the NEB/B.C./Alberta joint Montney assessment and the Alberta government’s shale and siltstone assessment, to create a more thorough picture of gas resources in Western Canada. Taking these into account, the Board estimates there were 31.0 1012m³ (1 093 Tcf) of remaining marketable Canadian resources at year-end 2012 (details in the Appendices).
- For the purposes of this analysis, tight gas refers to gas produced from low-permeability sandstone, siltstone, and carbonate reservoirs.[28] Tight gas reservoirs will typically not have sufficient natural pathways through the rock for natural gas to successfully flow to the wellbore in vertical wells. Therefore, they require some form of artificial stimulation to create pathways, such as hydraulic fracturing, or horizontal drilling to connect as many natural fractures as possible, or a combination thereof. Marketable tight gas resources in Canada are estimated to be 15.0 1012m³ (530 Tcf) at year-end 2012, including 5.0 1012m³ (178 Tcf) in the Alberta side of the Montney play and 7.7 1012m³ (271 Tcf) in the B.C. side of the Montney play.
- At year-end 2012, there were an estimated 992 109m³ (35 Tcf) remaining coal bed methane (CBM) resources in Alberta.
- The Horn River Basin, a shale gas resource, was estimated to contain 2.2 1012m³ (78 Tcf) and the Canadian shale resource, in total, is estimated to contain 6.3 1012m³ (222 Tcf). Shale gas resources outside western Canada, such as the Utica Shale in Quebec and the Horton Bluff Shale in the Maritimes, were not included in this estimate because of their early stage of assessment.
- Frontier resources include gas resources in Northern Canada and offshore resources. Northern Canada is estimated to contain 3.3 1012m³ (116 Tcf), of which 66 per cent is in the Mackenzie-Beaufort area and the remainder in the Arctic Islands. Offshore East Coast contains an estimated 2.6 1012m³ (91 Tcf) and offshore B.C. has an estimated 482 109m³ (17 Tcf) of marketable gas at year-end 2012.
Table 6.1 - Remaining Marketable Natural Gas Resources, as of 31 December 2012
| WCSB[f] | West Coast | Northern Canada | Ontario and Quebec | East Coast | Canada | |
|---|---|---|---|---|---|---|
| 109m³ | 24 390 | 482 | 3 286 | 227 | 2 578 | 30 963 |
| Tcf | 861 | 17 | 116 | 8 | 91 | 1093 |
[f] Includes British Columbia, Alberta, Saskatchewan and Manitoba. For the purposes of this table, all resources and reserves from the Territories are included under Northern Canada.
Canadian Natural Gas Production Outlook
Drilling activity and gas well productivity
- The number of natural gas wells drilled annually in Canada has been in decline since 2005, with a steep decline since 2008, largely due to significantly lower gas prices (Figure 6.1). Drilling activity in the last few years has focused on the most economic resources: deeper tight and shale gas resources. Overall, supply costs for these resources have declined due to technological advancements in horizontal drilling and multi-stage hydraulic fracturing. As well, some of these resource plays produce NGLs along with natural gas, which create additional revenue for producers. Meanwhile, development of shallow gas resources is largely on hold as they tend to lack NGLs and it is difficult to apply the technology that has reduced costs in the deeper resource plays. The focus on the deeper resources continues over the projection period.
Figure 6.1 - Natural Gas Wells Drilled, All Cases, and Average IP Rate[g]
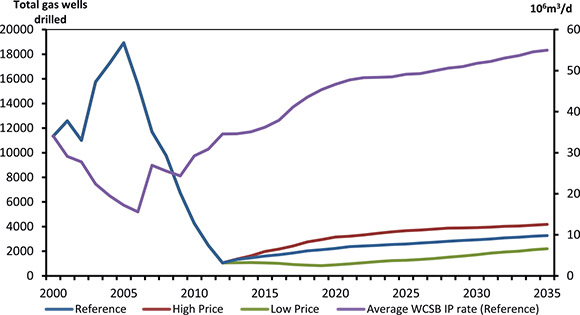
[g] Figure does not include the proposed gas wells in the Mackenzie Delta in the High Price Case
- Deeper wells generally produce at higher rates when compared with shallow wells. This is reflected in higher average initial production[29] (IP) rates in Western Canada, which have climbed over the last few years largely because of technological improvements and higher proportions of deeper wells being drilled. The average IP rate in Western Canada for all wells drilled in 2006 was 15.6 10³m³/d (0.55 MMcf/d) of marketable gas. For 2012 wells, the average was 34.6 10³m³/d (1.2 MMcf/d). The average IP rate for wells drilled in 2035 reaches 55.0 10³m³/d (1.9 MMcf/d).
- Better gas producing prospects tend to be drilled earlier in the development cycle of a particular resource area. Thus, as activity shifts to less prolific areas of a basin over time, the average IP rate of new wells would tend to be lower. However, concurrent improvements in drilling and well completion technology can offset these declines and allow IP rates to remain constant. Therefore, IP rates are assumed to stay at current levels in most areas in Western Canada over the projection period. The exceptions are a few tight gas areas where IP rates have been increasing and shallow gas areas where IP rates have consistently been declining.
- IP rates are held constant over the projection period for the Montney tight gas play and for the shale plays in Western Canada. In the part of the Montney play that extends into Alberta, the IP rate is 99.2 10³m³/d (3.5 MMcf/d). Wells on the B.C. side have an IP rate of 127.5 10³m³/d (4.5 MMcf/d). For the shale gas resources, the Horn River and Liard IP rates are set at 283.3 10³m³/d (10 MMcf/d), the Cordova at 70.8 10³m³/d (2.5 MMcf/d) and 85.0 10³m³/d (3 MMcf/d) for the Duvernay.
- The number of gas wells drilled annually increases over time in the Reference Case, driven by increased capital expenditures as natural gas prices rise. Drilling continues to focus on the more economic deeper tight and shale resources. The number of gas wells, however, will not reach the highs of the 2005 to 2008 period, but the strong production rates from deep wells eventually lead to a production increase in Canada as additions of new gas outpace the production declines from older wells starting in 2019. The number of gas wells drilled each year rises from nearly 1 100 in 2012 to over 3 200 by 2035, including 800 Montney wells, 112 Horn River wells and 170 Duvernay wells.
- This analysis assumes 28.3 106m³/d (1.0 Bcf/d) of LNG exports in 2019, which grows to 56.6 106m³/d (2.0 Bcf/d) in 2021 and 85.0 106m³/d (3.0 Bcf/d) in 2023. This is an assumption rather than a projection. Exploration and development spending associated with LNG exports boost capital expenditures above what they would otherwise be. This leads to more natural gas wells and production in the WCSB.
- Higher gas prices in the High Price Case lead to greater capital expenditures, pushing the annual gas well count to over 4 000 by 2035. The number of gas wells drilled per year in the Low Price Case drops until 2020 before increasing as prices rise and additional capital expenditures from the assumed LNG exports help push the annual gas well count to almost 2 200 by 2035.
Natural Gas Production
- In the Reference Case, Canadian marketable natural gas production declines from 373.1 106m³/d (13.2 Bcf/d) in 2013 to 318.2 106m³/d (11.2 Bcf/d) in 2018 (Figure 6.2). As rising prices and LNG exports support higher drilling levels, production ramps up continuously from 2019 onwards, reaching 494.0 106m³/d (17.4 Bcf/d) in 2035.
Figure 6.2 - Natural Gas Production by Type, Reference Case
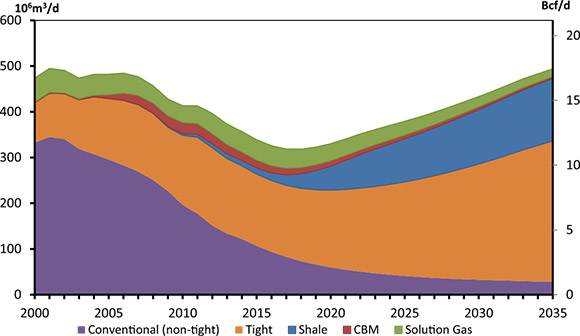
- The WCSB continues to see production increases in tight and shale gas and declines in non-tight conventional and CBM production. Prior to 2009, conventional gas (not including tight gas) made up half or more of Canada’s annual production. With the focus on deeper tight and shale resources in the projections, conventional gas accounts for only six per cent of production by 2035, with tight gas making up 62 per cent and shale gas 28 per cent.
- Montney production, as well as some other tight production, can include significant volumes of NGLs. NGL prices are typically linked to oil prices and can generate additional revenues to improve the production economics. In the Reference Case, natural gas production from the Montney formation from B.C. increases from 44.1 106m³/d (1.6 Bcf/d) in 2013 to 173.8 106m³/d (6.1 Bcf/d) in 2035 and in Alberta grows from 9.0 106m³/d (0.3 Bcf/d) in 2013 to 46.5 106m³/d (1.6 Bcf/d) in 2035.
- The Alberta Deep Basin region currently produces large amounts of tight gas, and this continues over the projection period. NGLs in the gas stream and its proximity to existing gas processing and transportation infrastructure make this an attractive resource. Marketable natural gas production remains relatively flat, increasing slightly from 71.7 106m³/d (2.5 Bcf/d) in 2013 to 72.9 106m³/d (2.6 Bcf/d) in 2035 in the Reference Case, as production from new wells offsets production declines from older wells.
- Drilling activity in the Horn River Basin has been low over the last few years in response to declining gas prices and the absence of NGLs in the gas stream. Activity and production ramp up as prices increase and as LNG export-related capital expenditures occur. Marketable Horn River shale gas production in the Reference Case grows from 8.2 106m³/d (0.3 Bcf/d) in 2013 to 102.6 106m³/d (3.6 Bcf/d) in 2035.
- Alberta’s Duvernay shale resource and the Cordova Embayment and Liard Basin shale plays in northeastern B.C. are in the early stages of development, but are included in the projection. In 2035 marketable natural gas production is 17.3 106m³/d (610 MMcf/d) from the Duvernay, 6.9 106m³/d (240 MMcf/d) from Cordova and 6.4 106m³/d (225 MMcf/d) from the Liard basin in the Reference Case.
- CBM production declines over the projection period from 20.1 106m³/d (0.7 Bcf/d) in 2013 to 4.4 106m³/d (0.2 Bcf/d) in 2035 as activity is drawn away from CBM to other more economic resources.
- Solution gas (the gas produced along with oil from oil wells) production declines over the projection period. While light oil production is expected to increase until 2016 before declining, the resulting additional gas produced is not enough to offset solution gas declines from older oil wells. Solution gas production decreases from 44.9 106m³/d (1.6 Bcf/d) in 2013 to 16.6 106m³/d (0.6 Bcf/d) in 2035 in the Reference Case.
- Nova Scotia production increases in the near term when the Deep Panuke project begins producing marketable gas in the second half of 2013. After the project is connected, Nova Scotia production gradually declines throughout the projection period. The small amount of New Brunswick onshore natural gas production tapers off over the next few years. There is shale gas potential in New Brunswick that could increase production but resource assessment is at too early a stage to include in this projection. In Newfoundland and Labrador, natural gas is currently being produced along with oil from the oil wells offshore but is being re-injected into the reservoir to maintain pressure for oil production. Given the natural gas price assumptions in this analysis, bringing this gas onshore to market is uneconomic.
- The small amount of marketable natural gas production in Ontario continues to decline, from 0.4 106m³/d (14 MMcf/d) in 2013 to zero near the end of the projection. Shale gas potential exists in Quebec; however, insufficient data is available and thus no marketable natural gas production is included in the projection.
- Production declines continue in the NWT and the Yukon, from 0.5 106m³/d (17 MMcf/d) in 2013 to 0.1 106m³/d (3 MMcf/d) in 2035. Based on the gas price assumptions, Mackenzie Delta natural gas production reaches market in the High Price Case only, starting in 2030. Mackenzie marketable production in 2030 is 27.0 106m³/d (953 MMcf/d) and then 34.0 106m³/d (1.2 Bcf/d) for the rest of the projection. Shale gas potential exists in the NWT and Yukon where the shales of the Horn River Basin and the Liard Basin stretch north of the 60th parallel, and additional potential is found in the Canol Shale of the central Mackenzie Valley. However, the shale gas resources in these areas are in the earliest stages of industry appraisal and have not been included in the projections.
- As shown in Figure 6.3, Canadian marketable natural gas production in the High Price Case averages 650.7 106m³/d (23.0 Bcf/d) in 2035. Higher prices and Mackenzie gas being connected to market lead to higher production levels than in the Reference Case. However, in the initial years of the projection, production declines to 346.2 106m³/d (12.2 Bcf/d) in 2016 in the High Price Case, and then increases as production from new wells offset older well production declines.
Figure 6.3 - Total Canadian Marketable Gas Production, All Cases
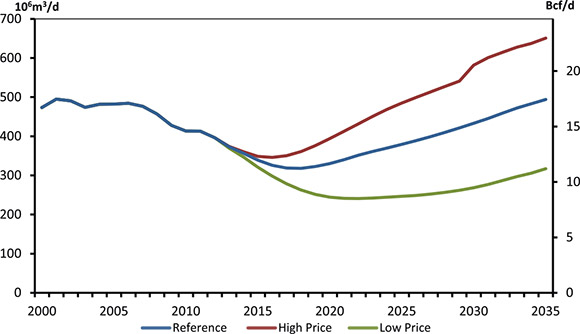
- Canadian production in the Low Price Case continues to decrease until 2023, at which point it begins to increase but does not reach current production levels by 2035. Marketable production drops to 240.8 106m³/d (8.5 Bcf/d) in 2022 and then increases to 317.3 106m³/d (11.2 Bcf/d) in 2035.
Supply and Demand Balance
- Canadian exports, all to the U.S., have been declining the last few years (Figure 6.4). Gas imports into Canada from the U.S. have been increasing because of Marcellus shale gas entering the Ontario market. In 2012 total Canadian imports were 80.8 106m³/d (2.9 Bcf/d). For context, this is a level close to total Ontario natural gas consumption. Declining exports and increasing imports have resulted in decreasing net exports out of Canada since 2007 (Figure 6.4).
- In the projections, the difference between Canadian production and demand is the net amount of gas that is available for export each year. In the Reference Case, net gas available for export continues to decline to 2019, and then increases steadily as production increases outpace growing Canadian demand (Figure 6.4). Net gas available for export in 2035 is 127.6 106m³/d (4.5 Bcf/d).
Figure 6.4 - Canadian Net Natural Gas Available for Export, Reference Case
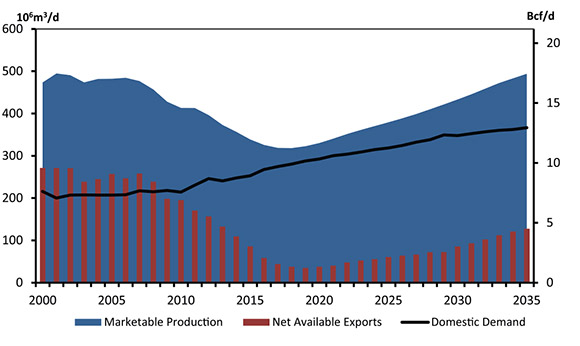
- In the High Price Case, net gas available for export is 302.5 106m³/d (10.7 Bcf/d) in 2035, a result of higher production levels and slightly lower demand due to the dampening effect of higher prices on consumption.
- Production in the Low Price Case is lower but demand is higher than in the Reference Case, leading to net imports by 2017. Canada continues to be a net gas importer throughout the projection period in this sensitivity.
- It is important to note that while Canada becomes a net importer in the Low Price Case, this does not imply that Canadian consumers’ gas requirements will not be met. The North American natural gas market is highly integrated and market forces will ensure sufficient supplies will exist to meet Canadian gas demand at a market-driven natural gas price. In a low price environment where Canadian production falls below demand, sufficient low-cost supplies from the U.S. would be imported to meet Canadian gas demand. As noted earlier, Canada has large natural gas resources; Canadian production could be significantly higher if natural gas prices were higher, as demonstrated by the production results in the Reference Case and High Price Case.
Figure 6.5 - Canadian Net Natural Gas Exports, by Case
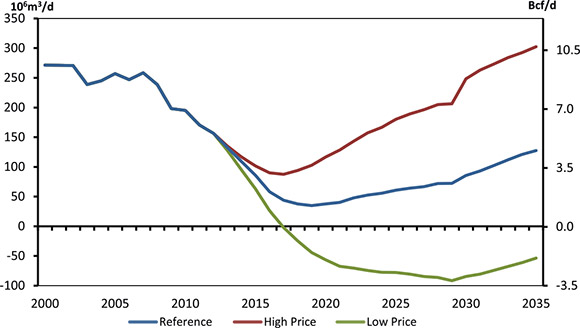
Key Uncertainties to the Outlook
- Future natural gas prices are a key uncertainty in the projections. The three price cases in this analysis represent a reasonable range of potential outcomes, but may not capture future price volatility in the market. Since 2000, annual average gas prices in North America have had large swings, with prices peaking in 2003 to 2005 and current prices less than half of 2008 prices. Price swings impact producer revenues and the amount of capital reinvested into the industry.
- The timing and volume of LNG exports are key uncertainties given the impact that this could have on exploration, production, prices and infrastructure development.
- Potential labour, service or equipment shortages could impact the pace of gas drilling, especially over the next decade with the possible ramp-up of activity to increase production for LNG exports and the increase in tight oil activity and production.
- U.S. natural gas production reached record levels in 2013, with production ramping up over the last few years as the large growth of shale gas and associated gas (from tight oil wells) have outpaced production declines from other gas resources. This has had a dampening effect on prices since 2009. Future growth of U.S. shale gas production will affect North American gas prices. If the U.S. starts to export significant amounts of gas as LNG, prices could increase due to additional demand from liquefaction facilities.
- Industry, government, and various groups in many jurisdictions continue to monitor aspects of multi-stage hydraulic fracturing. These include the amount of fresh water used in the fracturing process, the risks to ground water, and the chemical composition and safe disposal of fracturing fluids. Changing requirements in these areas could affect the pace and level of drilling activity.
- Average well production rates could be higher or lower than assumed in this analysis. Another uncertainty is the development of additional natural gas resources, such as Canadian shale gas plays outside of the WCSB.
- This analysis makes an assumption that there will be sufficient infrastructure to move Canadian gas to domestic and export markets and that there will be enough demand in export markets for Canadian gas. However, if shortfalls in infrastructure or market demand for Canadian gas were to occur, actual produced volumes may be below the levels in the projections.
Chapter 7: Natural Gas Liquids Outlook
- Raw natural gas as it comes from the wellhead is mostly comprised of methane, but also contains various heavier hydrocarbons and some contaminants. The heavier hydrocarbons consist of ethane, propane, butanes and pentanes plus, and are called natural gas liquids (NGL).
- NGLs are an important component of the Canadian energy mix. Ethane provides an important feedstock for the Canadian petrochemical industry. Propane is used for space heating in the residential and commercial sectors and is exported in significant quantities to the U.S. Butanes have various petrochemical applications and are used in the production of refined petroleum products. Butanes are also used to some extent as a blending component, or diluent, to decrease the viscosity of heavy oil and bitumen to facilitate their transport through pipelines. Most of the pentanes plus produced is used as a blending component for heavy oil and bitumen, and is by far the largest source of diluent for this purpose.
- In Canada, most NGLs are produced at natural gas processing plants, with the remainder produced as a byproduct of oil refining or bitumen upgrading. Hundreds of field plants, located in the gas-producing areas of Alberta, plus several plants in B.C. account for the majority of propane, butanes and pentanes plus production. Some ethane production comes from the field plants with ethane extraction capability; however, the majority of ethane production is concentrated in straddle plants. Straddle plants are large gas processing facilities located on major gas pipelines close to consuming centres or gas export points in Alberta and B.C. At these locations, straddle plants have access to high volumes of gas that allow them to take advantage of economies of scale to overcome the high capital investment required for ethane extraction (also called deep-cut extraction).
- In 2011, refineries account for roughly eight per cent of total NGL production. Refineries also contribute to a share of propane and butanes production, accounting for eight and 15 per cent of propane and butanes supply in 2011, respectively. Oil sands off-gas NGL production only represented one per cent of total NGL production in 2011, but increases in the Reference Case to seven per cent in 2020 based on growing oil sands production and declining NGL supply from the natural gas stream.
- In the Reference Case, total Canadian NGL production declines until 2027 before increasing slightly towards the end of the projection. A decline in pentanes plus production is the biggest contributor to the downward trend in total NGL production, declining by 0.8 per cent per year between 2012 and 2035. Production of ethane, propane and butanes also decline to 2035, but to a lesser extent than pentanes plus.
Figure 7.1 - Natural Gas Liquids Production, Reference Case
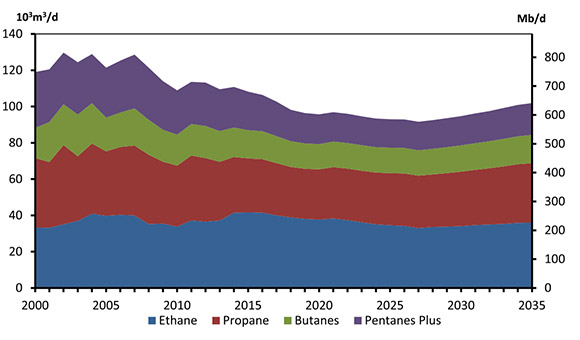
- In the Reference Case, propane supply stays near current levels for a short period of time and then declines until 2020. By 2020, tight gas production growth in B.C. contributes to growing propane production; at the same time propane production from oil sands off-gas also increases. These factors offset the decline in Alberta field plant propane production, and the net effect is slowly increasing levels of total propane from 2020 to 2035. Domestic demand for propane follows trends in GDP and population growth, and is projected to grow by 0.7 per cent per year by 2035, primarily because of growth in the commercial, industrial and agricultural sectors. Increasing demand and declining supply lead to declining propane available for export over the projection period.
- Butanes production in the Reference Case follows a similar production trend as propane, declining until 2020 and displaying modest growth until 2035. Refinery production remains flat with no significant expansions in Canadian refinery capacity in the long term. Demand increases substantially, growing 1.8 per cent per year to 2035 almost entirely due to growth in the use of butanes as a diluent for bitumen transport. Refinery and petrochemical demand for butanes remains largely flat over the projection period. Declining production and growing demand result in Canada becoming an importer of butanes by 2017, with imported butanes satisfying approximately one-third of Canadian demand by 2035.
- Pentanes plus and condensate supplies continue to decline over the long term in the Reference Case. While production from tight gas formations like the Montney have proven to be relatively rich in NGLs, growth in pentanes plus production from tight gas does not overcome declines in non-tight conventional production.
- Diluent demand for pentanes plus and condensate in the Reference Case increases from 40.9 10³m³/d (257.3 Mb/d) in 2012 to approximately 142.0 10³m³/d (893 Mb/d) in 2035. Imports of pentanes plus and condensate increase from 17.6 10³m³/d (111 Mb/d) in 2012 to 125.0 10³m³/d (786 Mb/d) in 2035. The large requirement for condensate imports has triggered the development of new infrastructure to facilitate additional condensate supplies in Alberta. In June 2013, the Cochin Reversal Project was approved to allow for additional imports of condensate into Alberta from the U.S. The announced interconnection between Enbridge’s Southern Lights and Explorer pipelines are expected to bring additional condensate supplies into western Canada.
Figure 7.2 - Pentanes Plus Supply and Demand, Reference Case
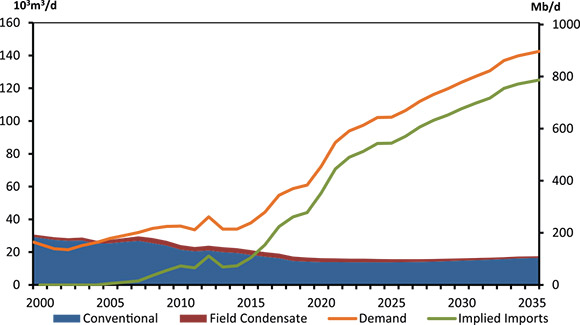
- In the High Price Case, higher natural gas production and the start of the Mackenzie Valley project in 2030 leads to higher ethane production, which grows by an annual average of 1.3 per cent from 2011 to 2035. Propane production declines slightly in Alberta, but is more than offset by rising production in B.C., and total propane production increases by 0.6 per cent per year over the projection period. Butanes production declines slightly until 2020 and recovers by 2035 to levels 13 per cent above 2011 production. Pentanes plus production from field plants remains largely unchanged over the projection period; however, higher diluent demand due to faster growing oil sands production increases net condensate imports compared to the Reference Case.
- In the Low Price Case, declining natural gas production results in lower volumes of natural gas exported from Alberta and ethane production declines by 1.2 per cent per year from 2011 to 2035. Production of propane and butanes decline by an average annual rate of 1.4 and 1.6 per cent respectively.
Ethane Supply and Demand
- Ethane supply in Canada recovers in the medium term, fostered by the development of ethane production in field plants with the capacity of extracting ethane from NGL-rich gas streams, from ethane off-gas from oil sands upgrading, and from ethane imports.
- Gas resource development in the Montney and Alberta’s Deep Basin has opened up new sources for NGLs in Canada. Over the short and medium term, ethane production peaks in 2016, and over the long term declines gradually in the Reference Case as less NGL rich sources of natural gas, such as Horn River Basin shale gas, increase their share of Canadian gas production. However, the potential of additional ethane imports from the Bakken, additional ethane from off-gas, and further development of the liquids-rich gas plays in B.C. and
 Alberta could help to counterbalance declines in domestic ethane production from other natural gas sources.
Figure 7.3 - WCSB Ethane Availability in Raw Gas and Ethane Production, Reference Case[h]
[h] Figure does not include ethane production from refineries or from off-gas of oil sands upgrading
- The Vantage pipeline is expected to start importing ethane from the Bakken region in the U.S. to Alberta in early 2014, contributing strongly to ethane supply available for the Alberta petrochemical industry. New ethane production plus imports will meet the current capacity of existing petrochemical facilities and potentially allow for some expansions of these facilities. The announcement of NOVA’s Joffre polyethylene plant expansion project scheduled for start-up in late 2015 is an indication that the Alberta petrochemical industry feels that there is enough ethane supply to optimize the utilization of its facilities.
- Ethane imports are also expected to flow into eastern Canada due to the availability of new ethane supplies from the Marcellus shale basin in the eastern U.S. This ethane will displace heavier hydrocarbons currently being consumed as feedstock in the Sarnia area.
Figure 7.4 - Ethane Supply and Demand Balance, Reference Case
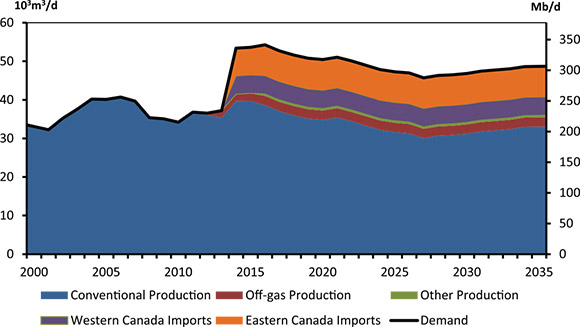
Key Uncertainties to the Outlook
- NGLs are a byproduct of natural gas production, and NGLs supply is sensitive to Canadian natural gas supply uncertainties. Since NGL content varies between geological formations, the mix of natural gas production sources also has an impact on future NGLs supply.
- The rate of oil sands production growth will impact the level of imports of butane and condensate required for blending bitumen to facilitate pipeline transport to markets.
- The timing and magnitude of LNG exports and their impact on western Canadian natural gas flows and NGL production are key uncertainties.
Chapter 8: Electricity Outlook
- In 2012, electricity generation capacity in Canada reached 134 GW. Hydroelectricity remains the primary source of electric power, accounting for 57 per cent of total capacity. Natural gas, coal, and nuclear plants provide most of the remaining supply, while non-hydro renewables such as wind, solar and biomass make up 5.5 per cent of capacity.
- The electricity supply mix varies significantly among the provinces and the territories, reflecting types of energy available, economic considerations and policy choices. Quebec, B.C., Manitoba, Newfoundland and Labrador and the Yukon have significant hydroelectric resources which are used to supply most of their electricity needs. Saskatchewan and Alberta have historically relied on locally abundant coal but have been expanding their natural gas-fired fleet in recent years. Nuclear power plants represent approximately one-third of Ontario’s capacity, with natural gas and hydro providing much of the remaining power. The Atlantic provinces rely on a combination of hydro, fossil fuel, nuclear and non-hydro renewable resources. Diesel-fueled plants account for most of the capacity in Nunavut and NWT.
- Total electricity generation capacity increases by an average of one per cent per year over the projection period, reaching 164 GW in 2035. As existing facilities age, they need to be replaced for reliability, economic and/or environmental reasons. In addition, sufficient capacity needs to be constructed to meet growing demand while maintaining adequate reserve margins (Figure 8.1).
Figure 8.1 - Capacity Additions and Retirements by 2035, Reference Case
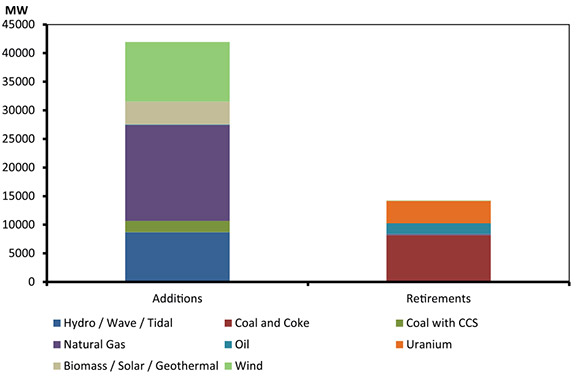
- In B.C., Alberta and Saskatchewan, electricity generation capacity grows faster than the national average, driven by expanding oil sands operations, mining and the assumed LNG export volumes. The capacity fuel mix in Alberta and Saskatchewan changes significantly as both provinces shift from coal to natural gas in order to meet baseload electricity demand. B.C. continues to rely on hydro power but natural gas-fired generation is added to supply assumed LNG export terminals. Quebec and Manitoba build new hydroelectric facilities and expand wind capacity. Natural gas-fired plants and non-hydro renewable sources are added in Ontario to replace retiring coal plants and nuclear units taken offline for refurbishment. In the Atlantic provinces, oil-fired and coal-fired plants are gradually replaced with natural gas, non-hydro renewables and hydro power coming from the Muskrat Falls project in Labrador.
- The electricity fuel mix in Canada changes over the projection period. The changes reflect government and industry efforts to curb energy-related GHGs and take into account provincial energy strategies, utility expansion plans, and the relative economics of generation options. Because of higher growth in other types of generation, the share of nuclear power in the total capacity mix declines from nine to seven per cent from 2012 to 2035, and the share of hydro decreases from 57 to 52 per cent over the same period. In contrast, the proportion of capacity from non-hydro renewables increases from six per cent to 13 per cent. The share of CO2 emitting sources (such as natural gas, diesel, oil, coke and coal) decreases slightly from 28 to 26 per cent.
Figure 8.2 - Capacity Mix by Primary Fuel, 2012 and 2035, Reference Case
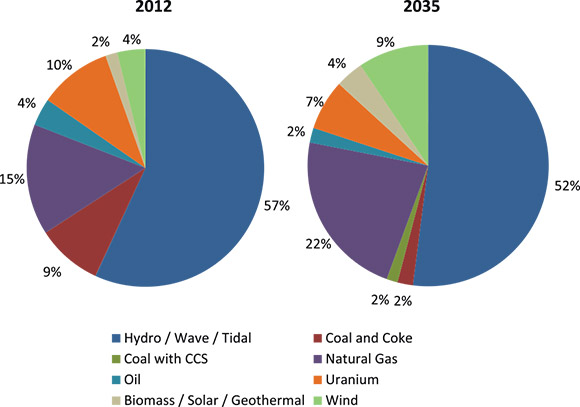
- In the High Price and Low Price Cases, the environmental policies and technological drivers are the same as in the Reference Case. Therefore, the installed capacity projections are unchanged from the Reference Case. However, differences in demand between the three cases have an impact on generation and electricity flows.
Figure 8.3 - Capacity by Primary Fuel, Reference Case
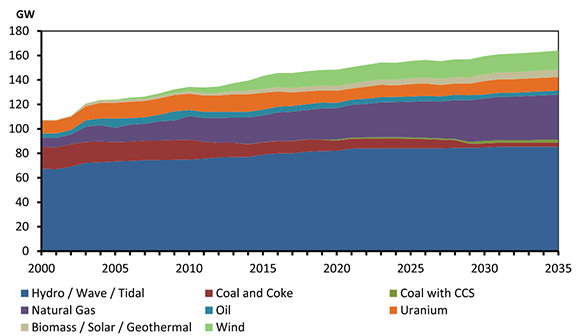
Figure 8.4 - Generation by Fuel, Reference Case
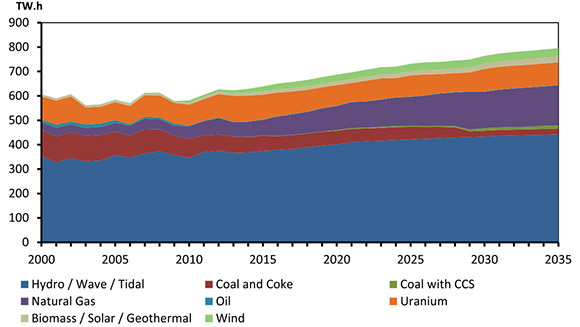
Hydro
- Hydroelectricity remains the dominant source of electricity supply in Canada over the projection period. Hydro power has the advantage of being flexible and relatively low cost. It does not emit CO2, its output can be adjusted quickly with variations in demand, and it promotes price stability because it is not subject to the volatility of fuel costs.
- Taking into account provincial utility planned projects, hydro-based capacity (including small hydro and run of river) increases from 77 GW in 2012 to 85 GW in 2035. This capacity expansion reflects a number of large hydro projects currently under construction such as La Romaine (1 550 MW) in Quebec and Muskrat Falls (824 MW) in Labrador, and planned projects such as Keeyask (695 MW) in Manitoba, Peace River Site C (1 100 MW) in B.C., and Petit Mécatina (1 200 MW) in Quebec.
- As a result of hydro-based capacity expansion, annual hydroelectricity production increases from 376 TW.h in 2012 to 442 TW.h in 2035. Due to faster growth in other forms of generation, such as wind-based and gas-fired generation, the share of hydroelectricity generation declines from 60 per cent of total generation in 2012 to 56 per cent in 2035.
Non-hydro Renewables
- In addition to abundant hydro resources, Canada has significant non-hydro renewable resources including wind power, biomass, solar, tidal and wave power. Utilization of these technologies has increased in the last few years, despite some challenges relating to availability and cost. Policy and incentives, such as Ontario’s feed-in tariff and other provinces’ renewable energy targets and standards, have contributed to this growth.
- Non-hydro renewables were the fastest growing generating source between 2008 and 2012, with an annual growth rate of 16 per cent. Canada had more than 7 000 MW of wind, solar, biomass, tidal and wave capacity in 2012, accounting for 5.5 per cent of total capacity. The provinces with the most wind power capacity are Ontario, Quebec and Alberta, while B.C. is the leader in biomass capacity.
- Non-hydro renewable capacity grows at double digit rates until 2016. Annual growth rates taper off afterwards, as several provinces approach their renewable energy targets. Over the projection period, wind makes the largest contribution to non-hydro renewable growth. Total installed wind power capacity increases three-fold over the projection period, reaching 16 GW in 2035, with the largest capacity additions occurring in Quebec, Ontario, Alberta and B.C. The share of wind-based generation increases from less than two per cent of total generation in 2012 to over four per cent by 2035. Canada’s fleet of hydro dams and reservoirs facilitates the development of wind power, with its capability to store water and to ramp-up output when intermittent wind resources are unavailable. Total combined capacity of biomass, solar and geothermal also grows, with net capacity additions over the projection period close to 4 000 MW, providing nearly three per cent of total generation by 2035.
- Although non-hydro renewables account for 13 per cent of capacity in 2035, they generate approximately seven per cent of total electricity because wind and solar facilities have lower capacity factors than hydro, nuclear or natural gas plants due to the intermittency of wind and sunshine.
Nuclear
- Nuclear energy accounted for 15 per cent of total electricity generation in Canada in 2012. Excluding hydro, nuclear is currently the only baseload generation option that provides emission-free electricity at prices that are competitive with other generation options if refurbishment costs are contained.
- Annual nuclear generation remains similar in 2012 and 2035, at 95 TW.h and 92 TW.h respectively. Over the projection period, however, it is lower due to expected outages of several nuclear units scheduled for refurbishment. No new nuclear units are anticipated to be built during the projection period in any province.
- Nuclear power plays a significant role in Ontario where it accounted for 55 per cent of electricity generation in 2012. Over the projection period, several of the Ontario nuclear plants will reach the end of their useful life and will have to be refurbished to continue operations. Refurbishments start in 2016 and continue until 2030, with each unit taken offline for two to three years during refurbishment.
- In New Brunswick, the Point-Lepreau generating station returned to service in 2012, after being shut down for refurbishment in 2008. Also in 2012, Gentilly 2, Quebec’s only nuclear plant, was decommissioned following Hydro-Québec’s decision not to proceed with refurbishment because of high estimated costs. Consequently, only Ontario and New Brunswick now use nuclear power to generate electricity.
Coal-Fired
- A key feature of the electricity supply outlook is the declining role of coal used in power generation. This trend reflects various government and industry initiatives to reduce GHGs, including the complete phase-out of coal in power generation in Ontario and stricter regulation of GHG emissions from coal-fired power plants.
- By year-end 2013, the remaining coal-fired power plants in Ontario will be retired. Additional retirements occur in Alberta, Saskatchewan and Nova Scotia during the projection period. At the national level, close to 9 000 MW of coal-fired capacity will be retired over the 2013 to 2035 period, or about three quarters of the total coal-fired capacity in 2012. Coal-fired generation declines from 66 TW.h in 2012 to 37 TW.h by 2035.
- Under the new federal regulations[30] requiring coal plants to reduce GHG emissions to no more than 420 metric tons of CO2 per GW.h, any coal facilities built after 1 July 2015, should be equipped with CCS technology in order to be permitted to operate. CCS facilities are built in Alberta and Saskatchewan over the projection period, reaching nearly 2 000 MW of capacity in 2035. Much of the growth in CCS occurs after 2020, replacing retired coal units or as a retrofit to existing coal plants.
Natural Gas-Fired
- Several factors support a greater role for natural gas power generation in Canada, including: low natural gas prices related to increased North American shale and tight gas production, lower GHG emissions compared to coal-fired power plants, and shorter construction times. In addition, natural gas generation benefits from lower upfront capital costs than coal-fired or nuclear power plants, the ability for capacity to be built in smaller increments to better match load growth, and the well-developed gas supply infrastructure in Canada.
- Total gas-fired capacity in Canada increases from 20 GW in 2012 to 37 GW by 2035, representing 40 per cent of all capacity additions in the projection period (not including nuclear unit refurbishments). Annual gas-fired generation more than doubles over the projection period, rising from 68 TW.h in 2012 to 164 TW.h in 2035. The share of gas-fired generation increases from 11 per cent in 2012 to 21 per cent in 2035.
- Natural gas-fired capacity increases in several provinces, with Alberta registering the largest increase. This is due to the continued use of gas in cogeneration facilities for oil sands development and replacement of coal-fired units with gas-fired units.
- In B.C., energy requirements for LNG export terminals are an important issue for future energy supply and demand in the province. A variety of options are available to provide the energy necessary to liquefy natural gas. This analysis assumes that the energy comes from natural gas-fired electricity plants. An additional 450 MW combined cycle unit is added in each of the years 2019, 2021, and 2023, corresponding to each assumed increment of LNG exports. Two alternative ways of powering LNG liquefaction terminals under consideration are direct drive, where natural gas is used directly without prior conversion to electricity, and electricity purchases from B.C.’s power grid.
Oil-Fired
- Oil-fired power plants accounted for four per cent of total Canadian installed capacity in 2012. These are used to generate electricity during peak demand periods or in areas where other generation options are not widely available, such as the Yukon, NWT and Nunavut.
- Total oil-fired capacity declines from 5 023 MW in 2012 to 3 248 MW in 2035. This reflects the retirements of ageing units, which are typically replaced by renewable units or natural-gas fired units when possible.
- Due to its low utilization, oil-fired generation currently accounts for roughly half a per cent of total generation and maintains a very small share over the projection period.
Exports, Imports and Interprovincial Transfers
- Net exports of electricity reached a record level of 47 TW.h in 2012, partly due to the availability of surplus energy in Ontario and Quebec. The condition of excess capacity in those provinces is likely to persist in the near future; net electricity available for export increases even further over the next decade. However, due mostly to the decrease in natural gas prices, electricity prices in most North American markets fell to record lows during the last few years, leading to a decline in revenues from exports. Lower revenues undermine the incentives to invest in new capacity to service U.S. markets, which has a limiting effect on the amount of energy available for exports in the long run. Consequently, net electricity available for export moderates over the projection period to levels below the 2012 peak, reaching 30 TW.h in 2035 (Figure 8.5).
Figure 8.5 - Electricity Net Available for Export and Interprovincial Interchange, Reference Case
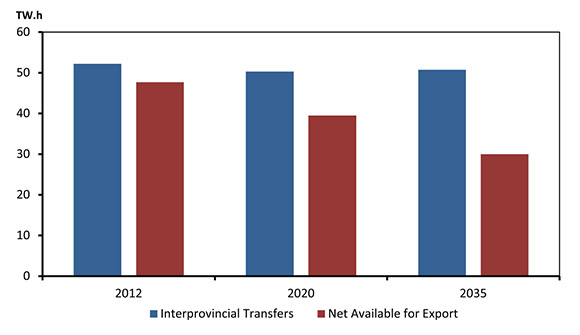
- Inter-provincial electricity transfers vary slightly throughout the projection period, from 52 TW.h in 2012 to 51 TW.h in 2035. Yearly variation depends on provincial demand and generation levels. A key change over the projection period comes from the Muskrat Falls hydro development in Labrador, assumed to begin operating in 2018. Twenty per cent of energy generated by Muskrat Falls will be reserved for Nova Scotia, and up to 40 per cent will be available for transfers to the Atlantic provinces and/or exports to the U.S.
Key Uncertainties to the Outlook
- Electricity supply projections are demand-driven which makes them susceptible to factors that affect the energy demand projections. Future supply requirements could change in response to general economic conditions or developments in specific, energy-intensive industries such as mining or LNG liquefaction for export terminals. Efficiency gains or energy conservation initiatives could reduce demand in the long run.
- The choice of supply options is influenced by economic, policy and environmental factors. The economics of new power plant projects depend on fuel and overall capital costs that vary by the type of technology under consideration. Construction or refurbishment of major hydro or nuclear facilities is expensive, but their fuel costs are relatively low. Gas-fired generation can be built more cheaply but the costs of its fuel component are more substantial. Uncertainty with respect to construction and fuel costs has an impact on the type of technologies and projects that are pursued.
- Non-hydro renewables such as wind and solar power typically have higher costs than conventional sources of generation, despite having zero fuel costs. Their deployment is supported in some markets by financial incentives such as feed-in tariffs. Reduction or elimination of incentives without a corresponding cost reduction due to technological improvement, or grid integration issues, may constrain growth of these generation sources. There are also reliability concerns regarding how much variable or intermittent generation may be integrated into a power system.
- Public perception of different types of generation and social acceptability of electricity infrastructure projects may influence the supply mix. Government policies impacting investments and operations of power plants continue to evolve. Environmental regulations could limit the use of certain fuels or alter the economics of different types of generation.
Chapter 9: Coal Outlook
- Coal is a large part of the global energy mix, used to meet about 28 per cent of global primary energy demand. According to the IEA, coal has met nearly half of energy demand growth over the past decade, almost all of which is a result of population growth and rising per-capita electricity consumption in non-OECD countries. Power generation accounts for two-thirds of coal consumption worldwide, with the remainder used mainly by the steel industry.
- Coal is one of the lowest-cost primary energy sources. One reason for the relative low cost of coal is its abundance and wide global distribution. According to the German Federal Institute for Geosciences and Natural Resources, the world’s total proven recoverable coal reserves are 1 038 billion tonnes. This would take about 133 years to deplete at current global production rates.
- Canada has about 6.6 billion tonnes of proven recoverable coal reserves, or 100 years of production at the current Canadian production rate. The great majority of Canadian coal resources are located in Western Canada, but coal has also been produced in New Brunswick and Nova Scotia. In 2011, there were 21 operating coal mines in Canada, all in Western Canada. Total Canadian coal production in 2011 was 67 million tonnes (MT), according to Natural Resources Canada, with over 33 MT of mostly metallurgical coal being exported.
- Coal demand and production forecasts are sensitive to assumptions regarding energy and environmental policies around the world. The IEA releases several scenarios on future global energy supply and demand each year in their World Energy Outlook.[31] Recent IEA scenarios have projected coal’s share of global energy demand to either increase or decrease by 2035, depending on assumptions of future energy and environmental policies. Scenarios with policies that limit emissions from coal consuming industries reduce coal’s share in future energy demand growth.
- Like other energy markets, coal markets have been affected by the increase in shale gas production in North America. Coal prices in 2012 decreased due to switching from coal to natural gas as a fuel for power generation (as discussed in Chapter 2).
- According to the IEA, coal is the largest source of power generation worldwide, accounting for over 40 per cent currently. In the EIA’s 2013 International Energy Outlook projection, this share declines to about 37 per cent by 2035. The EIA assumes that coal-fired generation grows at a slower rate than renewable, natural gas-fired and nuclear generation, however, it remains as the world’s largest source of electricity.
- In its central “New Policies” scenario, the IEA projects global coal demand to increase by an average of 0.8 per cent per year until 2035, with higher growth rates in the years leading up to 2020. Almost all of the growth in coal demand occurs in the developing economies, such as China and India, as coal demand in the OECD countries is expected to decline in absolute terms.
- In Canada, thermal coal[32] demand accounts for about 87 per cent of coal consumption, mostly for electric power generation. In the projection, demand for thermal coal declines by an average of 2.6 per cent per year, or 16 MT. This decline more than offsets the increasing demand in the steel and other industrial sectors over the outlook period.
- A key feature of the declining domestic coal demand is the phase-out of coal-fired generation in Ontario by the end of 2013. Primarily due to this initiative, imports of coal into Canada decrease from 20.5 MT in 2008, when the phase-out began to take effect, to 7.8 MT in 2015 (all metallurgical coal).
- Some declines in coal demand occur in other provinces as well, reflecting plant retirements and efficiency improvements from retrofits and new units. Coal demand in Alberta and Saskatchewan peaks in 2023 and 2015, respectively. Overall, Canadian demand for coal decreases from 50.2 MT in 2010 to 27.7 MT in 2035.
- Coal production not consumed domestically is available for export. About 80 per cent of Canadian coal exports are the higher grade metallurgical coals, mostly shipped to Japan and Southeast Asia. Smaller amounts are sent to the U.S., Central America and Europe. While coal is exported off of the B.C. Coast, both thermal and metallurgical coal is imported into Ontario and Atlantic Canada.
- Coal production in Western Canada increases quickly from 2014 to 2020, due to multiple mining projects that come on stream. One of these projects is expected to increase exports of thermal coal; however, most of these projects plan to produce metallurgical coal for export.
- With the closure of the Minto mine in New Brunswick, reported coal production in the Maritimes is now zero. This region is not expected to produce coal until 2014, when a new metallurgical coal mine opens in Cape Breton.
- Total Canadian coal production increases from about 70 MT in 2010 to 78.9 MT in 2035. Combined with declining domestic demand, net coal available for export increases at an average annual growth rate of 3.6 per cent in the Reference Case.
Figure 9.1 - Canadian Coal Production and Disposition, 2010, 2020 and 2035, Reference Case
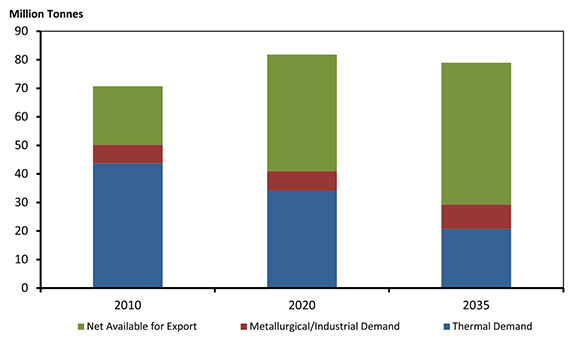
- In 2035, coal production is 79.0 MT in the High Price Case and 71.1 MT in the Low Price Case. In the Low Price Case coal production is lower because exports are assumed to grow at a slower rate, due to fewer mining projects being completed.
Key Uncertainties to the Outlook
- The assumption regarding coal plant retirements and CCS installations are key uncertainties. Regulations noted in the electricity outlook (Chapter 8) are a driving factor in the decrease of coal demand in Canada. Installations of CCS technology on new or existing coal plants would allow those plants to comply with the regulations. More or less CCS-enabled coal plants than are assumed in the electricity projections would affect Canadian demand for coal.
- Prices for coal in export markets are assumed to increase this decade. Only a portion of all the publicly proposed projects are assumed to be completed, as many Canadian coal mines are at the middle to high end of the global coal supply cost range. There exists the potential for lower coal prices if policies in importing countries dictate a shift away from using coal as a fuel source.
Chapter 10: Conclusion
- EF 2013 provides a projection of Canadian energy supply and demand to the year 2035. The projections employ currently available information, trends, policies and technologies to form a view of the Canadian energy system over the next 23 years. Over the projection period, new information will become available, trends, policies and technology will evolve, and certain assumptions made in the analysis may no longer apply. Readers of EF 2013 should consider the projections a baseline for discussing Canada’s energy future, not a prediction of what will take place.
Key Findings
The results of the Reference Case imply three broad conclusions. These are:
- Total Canadian energy production grows substantially over the projection period
Canada’s energy supply continues to grow over the projection period. Oil production is the main contributor to this growth, with oil sands output more than doubling from 2012 to 2035. Much of the growth in the oil sands is via in situ production, as mined production grows more slowly.
Technological developments in recent years have impacted Canada’s oil and natural gas production outlook. In particular, advances in horizontal drilling and multi-stage hydraulic fracturing technology have allowed for much more hydrocarbon production from shale and tight formations at lower costs. Application of this technology for oil extraction is in its early stages in Canada. Tight oil production increases until 2016, at which point it makes up a quarter of all Canadian non-oil sands production. After 2016, tight oil production declines slowly over the projection period. The decline is uncertain since many of the prospective tight oil plays in Canada are new and have limited information related to drilling and production results.
In the case of natural gas, technological advances have vastly increased Canada’s resource base. However, natural gas prices that are below the full cost of new supply in many areas limit production increases in the early part of the projection. By 2019, gradual price escalation, along with an assumption of LNG exports from B.C.’s coast, translates into production growth. By the end of the projection period Canada’s natural gas production is 25 per cent above current levels, led by higher levels of tight and shale gas development.
Canadian electricity supply increases steadily over the projection period. Natural gas prices are competitive enough to encourage substantial increases in gas-fired power generation capacity. Coal-fired generation capacity declines, largely a result of federal regulations that put stringent restrictions on building new coal plants and require retrofits or retirements of existing coal plants that reach the end of their economic life. Non-hydro renewables increase their share of Canada’s capacity mix from six per cent in 2012 to 13 per cent in 2035, driven largely by increases in solar and wind.
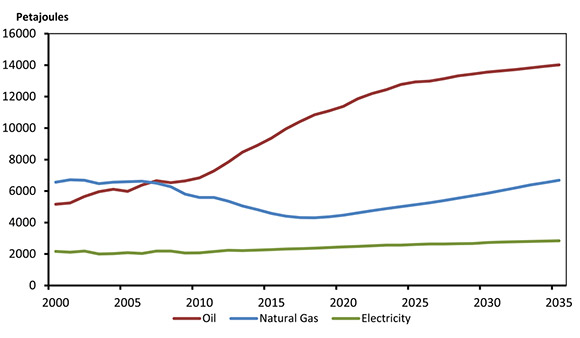
Figure 10.1 demonstrates Canadian energy production on an energy equivalent basis.
Figure 10.1 - Production of Crude Oil, Natural Gas and Electricity, Reference Case
- Total Canadian energy use grows moderately, with strong growth in resource industries, and slowing growth in transportation consumption
Total Canadian end-use demand is projected to increase at an average annual rate of 1.1 per cent from 2012 to 2035. This is slightly slower growth than the 1990 to 2008 trend (Figure 10.2).There is considerable variation in the growth between end-use sectors, as well as some interesting developments that depart from historical trends.
Average annual demand growth in the residential, commercial, and transportation sectors slows compared to the historical growth rate. Growth in these sectors is less than one per cent per year (0.7, 0.7, and 0.8 per cent, respectively) over the projection period. The key driver of growth in the projection is the industrial sector. It is projected to grow at an average annual rate of 1.4 per cent, up from 1.2 per cent over the 1990 to 2008 period. This higher industrial growth is primarily a function of strong growth in resource industries such as mining and oil and gas.
The projections include a notable decline in energy consumption by passenger vehicles of 0.6 per cent per year. This decline is a result of lower macroeconomic growth projections and the inclusion of new passenger vehicle emission standards from 2017-2025, which are expected to improve vehicle fuel efficiency. This change in the passenger vehicle energy demand is a departure from the historical trend. It is also a departure from previous Energy Futures projections as those did not include changes in longer-term emission standards. Declining passenger vehicle fuel consumption partially offsets petroleum product demand growth in other sectors.
Although total Canadian energy demand increases, the overall energy intensity of the Canadian economy, measured as energy use per dollar of GDP, declines at an average annual rate of 1.0 per cent over the projection period. This continues the historical trend of declining energy intensity. Energy intensity is influenced by a variety of factors, including energy efficiency improvements.
Figure 10.2 - Comparison of Historical and Projected Growth Rates of Population, Real GDP, and End-use Energy Demand, Reference Case
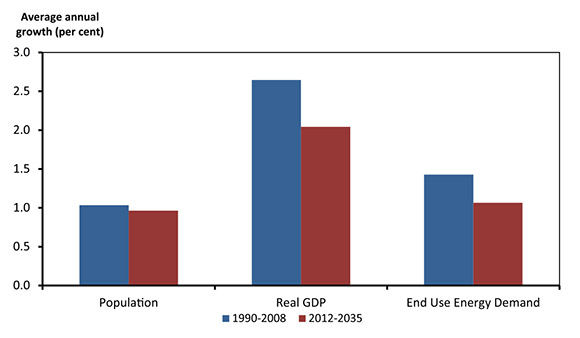
- Energy available for export increases, but energy market and infrastructure trends are key uncertainties
Canada will have increasing amounts of energy available for export over the projection period. Net oil available for export increases substantially, with production continuing to increase and domestic demand growing slowly. Natural gas available for export declines in the medium term due to production declines and relatively strong gas demand growth. By 2019, net natural gas available for export begins to increase as production starts to climb more quickly than domestic demand. Over the projection period, net electricity available for export moderates from the record highs experienced in 2012.
This analysis assumes that energy transportation infrastructure will be built as needed and export markets will absorb any production not used in Canada. Some market observers, including Energy Futures consultation participants, have noted that recent growth in U.S. oil and natural gas production has reduced Canada’s export opportunities in the U.S. and may continue to do so into the foreseeable future.
Canada’s main oil export market, the U.S., has seen rapid increases in tight and shale oil production. Throughout much of 2011 and 2012, production increases in the U.S. and in Canada’s oil sands have outpaced the market’s ability to provide sufficient transportation capacity and contributed to pipeline bottlenecks that impacted Canadian producers’ access to key markets in North America. By 2013, these bottlenecks eased somewhat as new infrastructure was added at key chokepoints and producers in Canada and the U.S. increasingly used railcars to transport additional oil production.
As with oil, technological advances have contributed to dramatic increases in U.S. natural gas production. Furthermore, some of the U.S. gas production growth has occurred near markets for Canadian exports, such as the U.S. Northeast. The result is increased competition for natural gas market share. The primary impact has been lower natural gas prices, which resulted in reduced Canadian gas drilling and production in recent years. One response being proposed by industry is to export natural gas to markets outside of North America in the form of LNG. Exporting LNG from the B.C. Coast would create a new market for Canadian natural gas and likely increase production and net natural gas available for export compared to a scenario with no LNG exports. The timing and volume of LNG exports are key uncertainties for natural gas projections.
Electricity trade between Canada and the U.S. has also been impacted by growth in U.S. gas production. Lower gas prices encourage more natural gas-fueled generation and combined with slower growth in electricity demand reduce wholesale electricity prices. As a result, the prospects for future export-oriented power generation in Canada are more uncertain than in the past.
With the market’s ability to adjust over time to changing conditions, and the long-term nature of the projections, underlying assumptions on export markets and infrastructure are anticipated to be appropriate for this analysis in the medium and long term. However, growth in export markets and the infrastructure to access them remain key uncertainties.
EF 2013 suggests that sufficient energy supplies will be available for Canadians for the foreseeable future. In the Reference Case, oil, natural gas and electricity supply remain robust, while end-use energy demand growth increases at a slower pace than the historical rate. Energy from fossil fuels remains the dominant source of supply, with emerging fuels and technologies continuing to gain market share. The energy efficiency of the Canadian economy continues to improve over the projection period, leading to declines in energy intensity.
Glossary
Conversion Tables
| Imperial and Metric Conversions | ||
| Unit | Equivalent | |
| m | metre | 3.28 feet |
| m³ | cubic metres | 6.3 barrels (oil); 35.3 cubic feet (gas) |
| t | metric tonne | 2200 pounds |
| Energy Content Equivalents | ||
| Energy Measure | Energy Content | |
| GJ | gigajoule | 0.95 million btu |
| PJ | petajoule | 1 000 000 GJ |
| Electricity | ||
| W | Watt | 1 joule per second |
| MW | megawatt | One million watts |
| GW.h | gigawatt hour | 3 600 GJ or 1 000 MW.h |
| TW.h | terawatt hour | 3.6 PJ or 1 000 GW.h |
| Natural Gas | ||
| Mcf | thousand cubic feet | 1.05 GJ |
| Bcf | billion cubic feet | 1.05 PJ |
| Tcf | trillion cubic feet | 1.05 EJ |
| Natural Gas Liquids | ||
| m³ | ethane | 18.36 GJ |
| m³ | propane | 25.53 GJ |
| m³ | butane | 28.62 GJ |
| Crude Oil | ||
| m³ | Light | 38.51 GJ |
| m³ | Heavy | 40.90 GJ |
| m³ | Pentanes plus | 35.17 GJ |
| Coal | ||
| t | Anthracite | 27.70 GJ |
| t | Bituminous | 27.60 GJ |
| t | Subbituminous | 18.80 GJ |
| t | Lignite | 14.40 GJ |
| Petroleum Products | ||
| m³ | Aviation Gasoline | 33.52 GJ |
| m³ | Motor Gasoline | 34.66 GJ |
| m³ | Petrochemical Feedstock | 35.17 GJ |
| m³ | Naphtha Specialties | 35.17 GJ |
| m³ | Aviation Turbo Fuel | 35.93 GJ |
| m³ | Kerosene | 37.68 GJ |
| m³ | Diesel | 38.68 GJ |
| m³ | Light Fuel Oil | 38.68 GJ |
| m³ | Lubricants | 39.16 GJ |
| m³ | Heavy Fuel Oil | 41.73 GJ |
| m³ | Still Gas | 41.73 GJ |
| m³ | Asphalt | 44.46 GJ |
| m³ | Petroleum Coke | 42.38 GJ |
| m³ | Other Products | 39.82 GJ |
Endnotes
[1] The public interest is inclusive of all Canadians and refers to a balance of economic, environmental, and social considerations that change as society’s values and preferences evolve over time.
[2] Section 118 of the National Energy Board Act: On an application for a licence to export oil or gas, the Board shall satisfy itself that the quantity of oil or gas to be exported does not exceed the surplus remaining after due allowance has been made for the reasonably foreseeable requirements for use in Canada, having regard to the trends in the discovery of oil or gas in Canada.
[3] Supplemental Tables to the Annual Energy Outlook 2005
[4] Grains of sand or ceramic beads that, when injected into a fracture, help to prop it open.
[5] Oil produced from organic-rich shales or from low permeability sandstone, siltstone, limestone or dolostone reservoirs. Tight oil reservoirs typically require the combination of horizontal drilling and multi-stage hydraulic fracturing to establish sufficient fluid flow to achieve economic rates of recovery.
[6] North Dakota Department of Mineral Resources. Historical monthly oil production statistics. Available at: www.dmr.nd.gov/oilgas/stats/statisticsvw.asp
[7] Data from the U.S. Department of Transportation Federal Highway Administration and the EIA.
[8] Transport Canada’s recent annual report, Transportation in Canada 2011, includes a section called “Outlook, Trends and Future Issues” that discusses many of these issues in depth. Available at http://www.tc.gc.ca/eng/policy/report-aca-anre2011-index-3010.htm
[9] Sivak and Schoettle. “Update: Percentage of Young Persons with a Driver’s License Continues to Drop.” Traffic Injury Prevention, 2012. Available at http://www.tandfonline.com/doi/full/10.1080/15389588.2012.696755
[10] North Dakota State Government. North Dakota Drilling and Production Statistics. Available at: https://www.dmr.nd.gov/oilgas/stats/statisticsvw.asp
[11] ND Pipeline Authority. Oil Transportation Table.
[12] International Gas Union. World LNG Report - 2013 Edition. Available at: http://www.igu.org/sites/default/files/node-page-field_file/IGU%20-%20World%20LNG%20Report%20-%202013%20Edition.pdf
[13] This includes producer consumption and non-energy/feedstock demands. The data used in this analysis is primarily sourced from Statistics Canada, Natural Resources Canada’s Office of Energy Efficiency, and Environment Canada.
[14] For more information on energy use by the oil sands, see the Crude Oil Supply Outlook, Chapter 5.
[15] Government of Québec. The Québec Cap and Trade System for Greenhouse Gas Emissions Allowances, 2012.
[16] Following analysis done by the Western Climate Initiative, emission permits begin at $34 per tonne in 2013, rising to $55 per tonne in 2020. For more information refer to WCI Economic Modeling Team: Discussion Draft Economic Analysis Supporting the Cap-and-Trade Program – California and Québec, May 7 2012. Available at: http://www.westernclimateinitiative.org/document-archives/Economic-Modeling-Team-Documents/Discussion-Draft-Economic-Analysis-Supporting-CA-and-QC-Linking/
[17] Assuming 200 watt hour/km per EV, driving 15 000 km/yr. Consistent with Canada’s Electric Vehicle Technology Roadmap, EV Industry Steering Committee, 2010.
[18] Assuming heavy trucks travelling 200 000 km/yr and medium trucks traveling 60 000 km/yr, with fuel efficiencies ranging between 39 to 62 l/100km. This is consistent with National Gas Use in the Canadian Transportation Sector, 2010, prepared by The Natural Gas Use in Transportation Roundtable. There are many more EVs assumed than NGVs, but much less electricity use. This difference is due to passenger EV being relatively less energy-intensive per kilometre travelled, and travelling fewer kilometres per year.
[19] This number differs from the domestic demand value shown in Figure 6.4, as that value represents only marketable gas. Demand values in this chapter include producer consumption as well.
[20] More information on the Government of Canada’s sector-by-sector approach.
[21] The Ring of Fire is a mineral development opportunity located in northern Ontario. Current estimates suggest significant potential for chromite production, along with significant nickel, copper and platinum deposits.
[22] Further detail on Canada’s oil resources and reserves can be found in the Appendices.
[23] Oil & Gas Journal, December 6, 2012
[24] EIA, June 13, 2013, Technically Recoverable Shale Oil and Shale Gas Resources: An Assessment of 137 Shale Formations in 41 Countries Outside the U.S.
[25] Alberta Energy Regualtor, ST-98 2013, Alberta’s Energy Reserves 2012 and Supply / Demand Outlook 2013-2022, May 2013.
[26] Canadian Energy Research Institute, Canadian Oil Sands Supply Costs and Development Projects (2012-2046), May 2013.
[27] North West Upgrading Inc. News Release, 16 February 2011
[28] The areas of tight gas recognized in this analysis include: certain Cretaceous zones in the Deep Basin; the Milk River, Medicine Hat and Second White Specks formations in southeast Alberta and southwest Saskatchewan; and the Jean Marie and Montney formations in northeastern B.C.
[29] Defined for this analysis as the highest average monthly production rate over the first three months of production.
[30] Reduction of Carbon Dioxide Emissions from Coal-fired Generation of Electricity Regulations (SOR/2012-167)
[31] International Energy Agency
[32] Lignite, sub-bituminous or lower-grade bituminous coal

- Date modified: