ARCHIVED - Canadian Energy Dynamics 2013 - Energy Market Assessment
This page has been archived on the Web
Information identified as archived is provided for reference, research or recordkeeping purposes. It is not subject to the Government of Canada Web Standards and has not been altered or updated since it was archived. Please contact us to request a format other than those available.
March 2014
Canadian Energy Dynamics 2013 - Energy Market Assessment [PDF 9216 KB]
Copyright/Permission to Reproduce
ISSN 2292-8308
Table of Contents
 Canadian Energy Dynamics: Overview
- Crude Oil: International Overview
- Crude Oil: Western Canada
- Crude Oil: Ontario and Eastern Canada
- Natural Gas Liquids
- Natural Gas: Western Canada
- Natural Gas: Ontario and Québec
- Natural Gas: The Maritimes
- Liquefied Natural Gas
- Electricity: Fuel Source Composition
- Electricity: Canadian Exports
- Energy in the North and Offshore
- Appendices
- Endnotes
Canadian Energy Dynamics: Overview
 The energy sector in Canada is dynamic and continually being shaped by new sources of supply, changing demand, and integrated infrastructure development. The National Energy Board (NEB or Board) believes that well-functioning, competitive markets efficiently balance supply and demand, and lead to innovative, and robust energy systems.
In support of its regulatory role, the Board actively monitors energy markets and produces neutral, independent, and fact-based energy information for Canadians. These products increase the transparency of Canadian energy markets and support Canadian energy literacy. This report, Canadian Energy Dynamics: 2013, describes many important developments witnessed in Canadian energy markets in 2013, while providing useful information and statistics.[1]
Canadian crude oil markets continue to be influenced by increased production in Alberta and the Bakken, apportionment on Western Canadian export pipelines, and price differentials between inland and coastal markets. Railroads have increasingly met demand for crude oil transportation in Western Canada and the Bakken, moving oil from these regions to refineries, including those in the higher value, coastal markets. In Eastern Canada, some refineries constructed new rail terminals in 2013, while Imperial Oil’s Dartmouth, Nova Scotia refinery was converted to a marketing terminal, and North Atlantic’s Come-by-Chance, Newfoundland refinery was put up for sale.
Natural gas markets have evolved in recent years with supply shifting from the west to the east. Declining conventional gas production in Western Canada and growing production in the eastern U.S. from the Marcellus and Utica Shales are changing gas flows across the country, most notably in Ontario and Québec. Shale gas areas in British Columbia (B.C.) and Alberta hold a lot of promise and have resulted in the Board receiving numerous applications for the export of liquefied natural gas (LNG) from the West Coast. The development of shale gas has also increased the availability of natural gas liquids, with ethane now being delivered from the U.S. for use in the Canadian petrochemical sector.
Electricity market participants are responding to new regulations, carbon markets, and changing fuel costs by investing in cleaner forms of generation. Canadian electricity exports, which predominantly are sourced from hydroelectricity, have reached record highs in recent years.
Crude Oil: International Overview
The Canadian oil industry is heavily influenced by U.S. and overseas oil markets. Domestic crude oil production and export levels are growing, while Eastern Canada imports a significant portion of its crude oil. In 2013, approximately 71 per cent of Canadian crude production was exported to the U.S. and two per cent was exported to overseas markets from terminals on the east and west coasts. Refineries located in Ontario and Eastern Canada imported approximately 39 per cent of their crude oil supply from other countries, including some from the U.S., and the price for these imports was based more on higher priced international benchmarks than Alberta prices.
Figure 1 U.S. Imports of Crude Oil and Petroleum Products
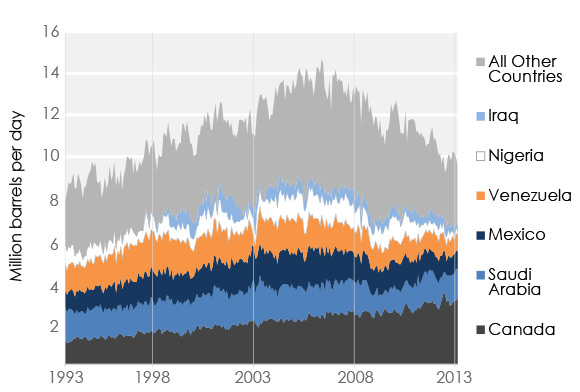
Increasing Canadian Exports to a Diminishing American Import Market
Historically, the U.S. has been the world’s largest consumer and importer of crude oil, and also one of the largest producers. Advances in production technology have contributed to a 21 per cent increase in U.S. oil reserves between 2003 and 2011, to 26.5 billion barrels. Similarly, U.S. oil production increased 32 per cent between 2003 and 2013 to 7.46 MMb/d. This strong growth has allowed the U.S. to reduce its reliance on foreign crude. The U.S. Energy Information Administration forecasts that net imports of liquid fuels in the U.S., as a share of consumption, will decline to about 32 per cent in 2013 from a high of 60 per cent in 2005. U.S. oil imports from Canada - unlike oil imports from other countries - continued to grow. U.S. oil imports from Canada have increased from 16 per cent of total U.S. imports in 2005 to 32 per cent in 2013.
Crude Oil Price Differentials Narrowing
Global crude oil prices reached a 2013 peak in late August around concerns of U.S. intervention in the Syrian civil war and further disruption of oil supplies from the region. In November, geopolitical tensions and oil prices eased somewhat, after world powers agreed to temporarily suspend some sanctions on Iranian exports. Increased refinery demand in Alberta and Illinois has lifted Canadian oil prices since the 2013 lows seen in November.
Rapidly increasing oil production in the U.S. and Canada has led to congested oil transportation systems in North America. This is especially the case at the Cushing, Oklahoma oil hub, the pricing point for West Texas Intermediate (WTI). This has resulted in prices for light and heavy crude in Western Canada being heavily discounted on a frequent basis, relative to both WTI prices and to global (Brent) prices. In 2013, congestion was alleviated somewhat, with a number of pipeline expansions in the U.S. and by a rapid ramping up of crude-by-rail volumes.
Figure 2 Crude Oil Pricing Benchmarks
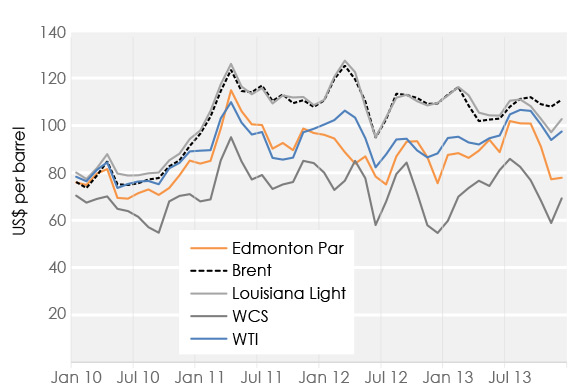
The discounts on inland North American crudes declined on average in 2013 as WTI, Edmonton Par and Western Canada Select (WCS) all sold at higher levels than in 2012, while Brent and Louisiana Light Sweet average prices fell. One of the biggest factors contributing to the narrowing of the differentials was the completion of the Seaway Pipeline reversal and expansion project in January 2013. Seaway is now moving up to 400 Mb/d of oil from the Cushing hub to the U.S. Gulf Coast.
Crude Oil: Western Canada
In 2013, Western Canadian crude oil production averaged approximately 3.3 MMb/d, representing a 6.5 per cent increase over 2012. Production grew in a number of areas throughout the large Western Canada Sedimentary Basin. Conventional crude oil production increased by 3.7 per cent, led by 9.3 per cent more light crude oil in Alberta and Saskatchewan, where tight oil production has grown. Oil sands production also grew by 8.2 per cent, despite down time at the Suncor and Syncrude upgraders in May 2013.
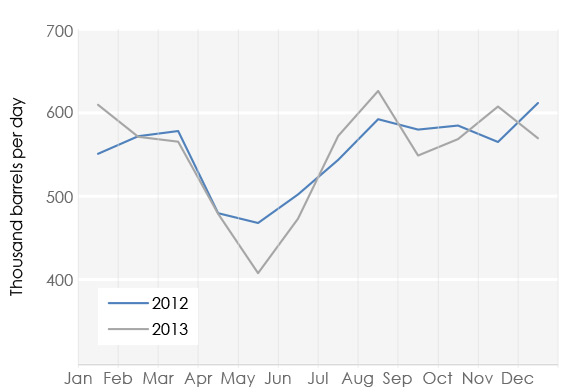
There are nine refineries in Western Canada with a total capacity of approximately 760 Mb/d. These refineries used approximately 550 Mb/d of crude oil in 2013, very similar to 2012. Refinery maintenance reduced demand in May of 2013. In late December, a fire at the 130 Mb/d capacity Co-op Refinery in Regina cut the site’s production in half.
Figure 3 Western Canada Refinery Demand
Growing Canadian Crude Production and Exports
Most of the oil produced in Western Canada is exported to the U.S. and some travels through the U.S. on its way to refineries in Ontario. In 2013, Western Canadian crude oil exports reached approximately 2.4 MMb/d, up approximately 10 per cent over 2012. This growth in export volumes was made possible by growth in both pipeline (145 Mb/d) and railroad (78 Mb/d) transport.
Figure 4 Western Canada Production and Pipeline Exports
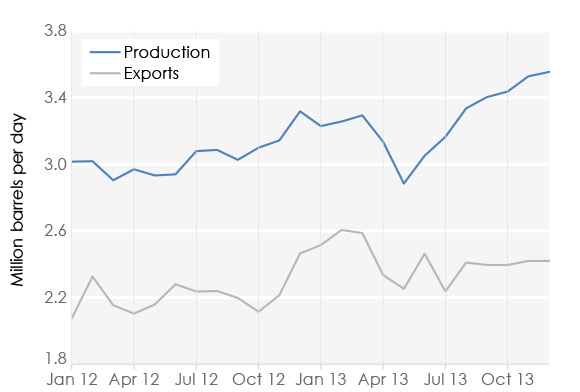
Export levels decreased in mid-2013 due to production and market access issues. Levels picked up towards the end of the year, driven primarily by increases in heavy crude oil and synthetic crude oil production. The U.S. Midwest region has been a key export market for Canada, absorbing nearly all growth in Western Canadian crude oil production since 2007. During 2013, three major refinery conversions in the U.S. Midwest added a combined 430 Mb/d of heavy refining capacity.
The prices received for Canadian oil in export markets increased compared to 2012, when discounts on Canadian crude oil were at record highs. For western pipeline exports, the average price is estimated at $87.45 per barrel in 2013, compared to $82.58 per barrel in 2012. The value of western crude oil exports in 2013 was approximately $75 billion, with pipelines handling $71 billion and rail $4 billion.
Rapid Growth in Crude-by-Rail while Some Pipelines are Apportioned
Canadian crude oil exports by rail reached approximately 160 Mb/d by year-end, more than double the amount in December 2012. Exports of crude by rail are expected to grow as several new rail terminals with crude handling capabilities are commissioned across Western Canada. Crude oil shipments by rail in the U.S. have grown at a similar rate and are estimated at 800 Mb/d in 2013.
All major crude oil export pipelines increased their export volumes in 2013 relative to 2012, and throughputs on these pipelines are near capacity. Apportionment, the rationing of available space on pipelines, occurred on the Enbridge Mainline (mostly on the U.S. side). The Trans Mountain Pipeline has reported apportionment levels near 70 per cent since mid-2011, meaning that producers have only been able to move about 30 per cent of their desired volumes on that pipeline.
Crude Oil: Ontario and Eastern Canada
East Coast Oil Production Up 15 Per Cent
There are four significant oil fields in Eastern Canada, all off the coast of Newfoundland and Labrador: Hibernia, Terra Nova, White Rose, and North Amethyst. Production from these fields increased 15 per cent in 2013, up to nearly 240 Mb/d, after being impacted by several operational issues in 2012. About 47 per cent of production was processed in domestic refineries, and over half was exported.
Eastern Refineries Begin Looking West For Supply
At the beginning of 2013, there were ten refineries operating in Ontario and Eastern Canada, with a combined capacity of 1.37 MMb/d. The refineries in Ontario refine mostly light crude oil from Western Canada and the U.S., while the refineries in Eastern Canada run predominantly light crude oil received via tankers from around the world. The Eastern Canadian refineries have more supply options. In recent years the cost of supply to these refineries has been significantly higher than those refineries which can access oil from inland North America.
Figure 5 Eastern Canada Refinery Capacity and Demand
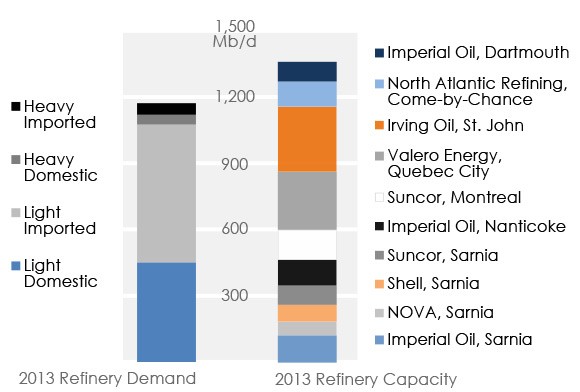
Due to the higher supply cost, and each site’s operational characteristics, some of these refining operations have not been profitable in recent years. In October 2013, Imperial Oil closed its Dartmouth, Nova Scotia refinery, converting it to a products terminal. The Dartmouth refinery had produced most of the gasoline, heating oil, and diesel consumed in Nova Scotia. In Newfoundland, the Come-by-Chance refinery reported losses in 2013 and its owner announced that it is seeking a buyer for the facility.
To gain access to the discounted crude oil from inland North America, refineries in Québec and New Brunswick have been actively developing rail offloading facilities. Irving Oil began receiving oil by rail in October 2012. Irving can receive 80 Mb/d directly, plus 40 Mb/d railed to Albany, NY, and then barged to Saint John, New Brunswick. Valero and Suncor started receiving crude-by-rail shipments at their refineries in Québec in September 2013, and December 2013, respectively.
Figure 6 Eastern Canada Refineries and Major Liquids Pipelines
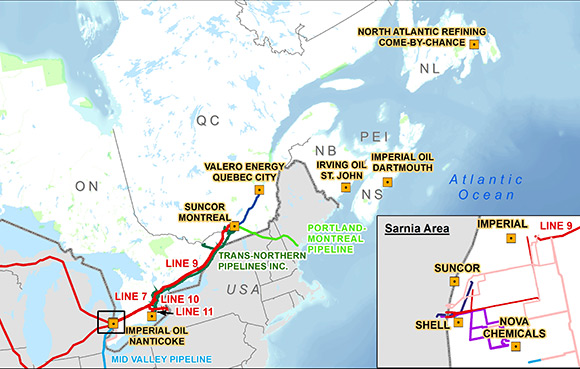
These refineries are also supporting pipeline proposals to expand access to inland crude. Enbridge submitted an application to the NEB to reverse Line 9B, and expand the entire Line 9, from 240 Mb/d to 300 Mb/d. If approved, it would allow Québec refineries to access additional Western Canadian and U.S. Bakken oil. Suncor and Valero have announced logistical investments related to the proposed reversal. Further, in June 2013, the open season for TransCanada’s Energy East project closed with interest in excess of the initial 850 Mb/d design capacity. TransCanada subsequently increased the size of the project to 1.1 MMb/d, and intends to submit an application to the NEB in 2014.
Natural Gas Liquids
New Infrastructure To Bring Ethane Into Canada from U.S.
Shale plays in the U.S. have been key in driving the growth in production of natural gas liquids (NGL), such as ethane, propane and butanes.
Ethane is a highly valued NGL in the petrochemical industry, and is a key feedstock for the manufacturing of ethylene. Since 2008, ethane production in the U.S. has grown by 32 per cent and the Canadian petrochemical hubs of Alberta and Sarnia, Ontario are key markets for growing U.S. ethane production.
Figure 7 Ethane Production in the US and Canada
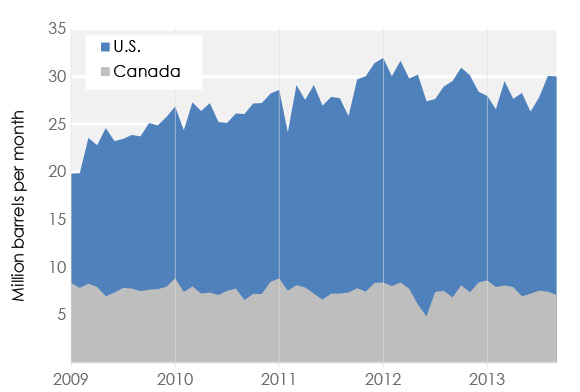
The Vantage Pipeline was completed in 2013 and commenced operation in early 2014. Vantage will deliver an initial capacity of 45 Mb/d of ethane produced in North Dakota from the Bakken tight oil play to Empress, Alberta. From Empress, the ethane will flow to petrochemical facilities via the Alberta Ethane Gathering System pipeline.
In Eastern Canada, ethane from the Marcellus Shale began flowing into the Sarnia petrochemical hub in 2013. At its Corunna facility, NOVA Chemicals plans to shift entirely from an oil-based feedstock to ethane by 2014. Lastly, NOVA and Kinder Morgan anticipate a 2017 in-service date for the UTOPIA Pipeline, designed to transport ethane and propane into Windsor, Ontario and use the east leg of Kinder Morgan’s Cochin Pipeline.
Tightening Fundamentals Drive Propane Prices Higher to Close 2013
Despite growing production of natural gas liquids from shale oil and shale gas plays in the U.S., a variety of factors have resulted in the price of propane increasing at a rapid rate in the latter half of 2013 and early 2014.
A large corn crop and wet weather prior to harvest in the U.S. Midwest resulted in high consumption of propane to dry out the crop prior to storage in late 2013 resulting in a substantial draw on underground propane inventories. By the end of 2013, inventories in Canada and U.S. were 24 per cent below the five-year average.
Figure 8 Monthly Average Propane Prices
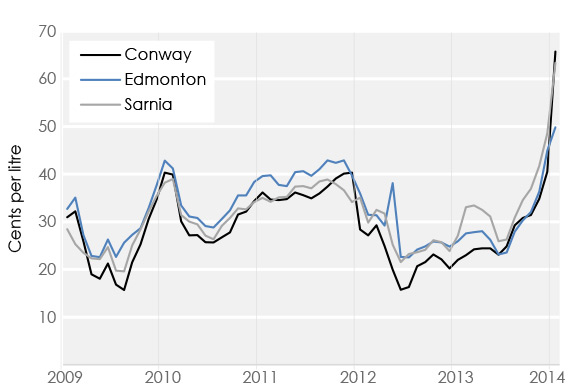
Extremely frigid temperatures in December 2013 and January 2014 increased demand for heating needs. Preliminary indications are that heightened demand combined with difficulties in transporting propane, which moves by rail, truck and pipeline, contributed to rising propane prices across Canada and the U.S. For example, at the Conway hub in Kansas, spot trades of propane on certain days in January reached $1.44 per litre (US$5.00 per gallon), more than five times the previous two-year average price.
In February 2014, the Minister of Natural Resources and the Minister of Industry asked the National Energy Board and the Competition Bureau to examine propane supply and demand in Canada and market issues including the price increase. A report will be published by 30 April 2014.
Natural Gas: Western Canada
Transportation on TransCanada’s Mainline
An average of 13.5 billion cubic feet per day of gas was produced in the Western Canada Sedimentary Basin (WCSB) in 2013, three per cent less than 2012. About 16 per cent of this gas moved east on TransCanada’s Mainline. Tolls on the Mainline had increased significantly over the past several years as the amount of gas shipped east on TransCanada’s Mainline declined, reaching a low in July 2013. The increasing tolls, coupled with narrowed natural gas price differentials since 2008, affected the economics of shipping gas from the WCSB to eastern markets.
Figure 9 WCSB Production and Eastbound Mainline Flows
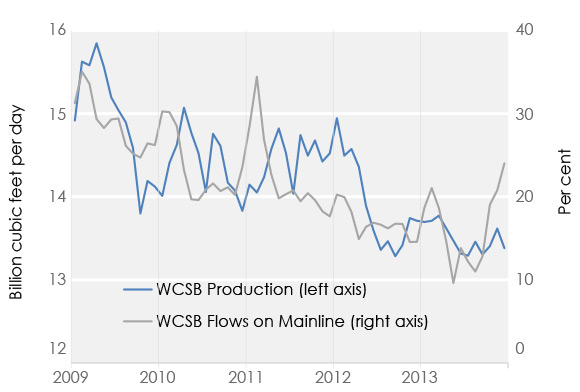
A new NEB-approved toll regime came into effect in July 2013 for the Mainline, dropping the cost of firm transportation from Empress (near the Alberta-Saskatchewan border) to the Dawn hub in southern Ontario to $1.42 per gigajoule (GJ) compared to the 2012 toll of $2.02 per GJ. The new regime also gives TransCanada significant flexibility in pricing short-term and interruptible transportation.
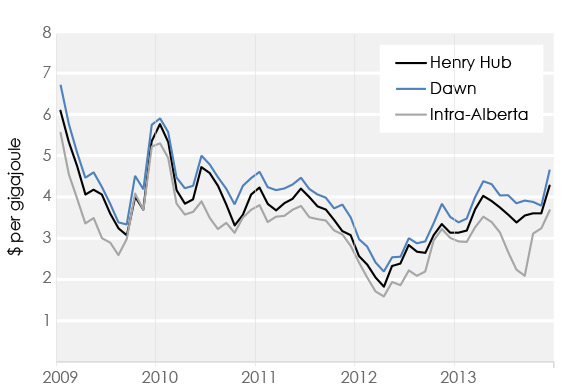
The market displayed some notable dynamics in the months that followed. The Intra-Alberta price fell compared to eastern gas prices during the autumn before rebounding towards year-end. Also, since August 2013, the volume of gas destined for eastern markets on the Mainline has increased steadily. In December, about 24 per cent of WCSB gas moved east on the Mainline - the highest level in almost three years.
Figure 10 Monthly Natural Gas Prices
Increasing Industrial Gas Demand in Alberta
While most WCSB gas production is exported to markets in Ontario, Québec and the U.S., Alberta’s gas demand is increasing faster than any other province. As a result, the share of WCSB gas production available for export has been decreasing. The Nova Gas Transmission Ltd. (NGTL) system moves about three quarters of WCSB gas production. Between 2008 and 2013, NGTL’s Intra-Alberta gas deliveries increased over 80 per cent, while its deliveries out of Alberta decreased about 30 per cent. Most of the increase in gas demand is in the industrial sector, primarily from the oil sands industry. Natural gas in the oil sands is used for both steam and power generation.
Growing Montney Production
The Montney Formation in Alberta and B.C. has been explored since the 1950s. Only recently have advances in technology made it possible to economically produce gas from this unconventional formation. Production began in 2005, and grew to over 2.5 Bcf/d in 2013. Growing Montney production is offsetting declining production from conventional sources in the WCSB.
In late 2013, the NEB, the British Columbia Oil and Gas Commission, the Alberta Energy Regulator, and the British Columbia Ministry of Natural Gas Development estimated this formation contains 12.7 trillion cubic metres (449 Tcf) of marketable natural gas resources. These marketable resources are equivalent to 145 years of Canada’s 2012 consumption.
Natural Gas: Ontario and Québec
Imports and Exports of Natural Gas
Ontario and Québec produce only very small amounts of natural gas, so virtually all of the supply to Ontario and Québec is from other regions. Traditionally, Western Canadian gas shipped by the TransCanada Mainline was the major source of gas supply for Ontario and Québec.
Figure 11 Imports of Natural Gas into Canada from the U.S.
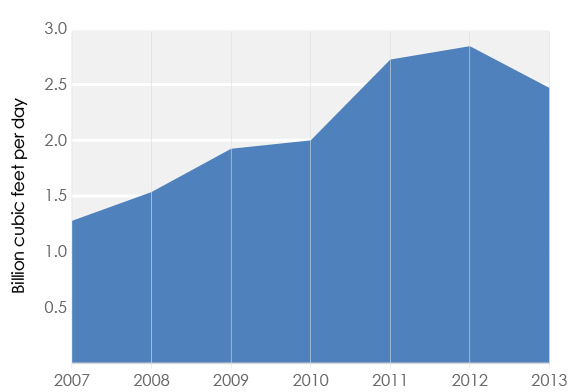
In the past five years, the source of natural gas for these provinces has changed significantly. Imports from the U.S. now make up an increasingly large part of these provinces’ supply. While a number of factors have contributed to this, a primary factor has been technological advances which have vastly increased gas production in the Marcellus in the U.S. northeast. Marcellus natural gas is relatively low cost and provides a new source of supply to the region.
Canadian imports of natural gas, most of which flow into Ontario, have nearly doubled since 2007, reaching 2.5 Bcf/d in 2013. Gas demand in Ontario and Québec, mostly for space heating, industrial processes and power generation, has been relatively flat, averaging 3.3 Bcf/d between 2007 and 2012.
Pipeline Infrastructure Response
Market participants have sought to bring additional supplies from the Marcellus into Ontario, requiring facility modifications and additions on both sides of the border.
Figure 12 Select Pipeline Infrastructure Changes in Ontario and the U.S. Northeast
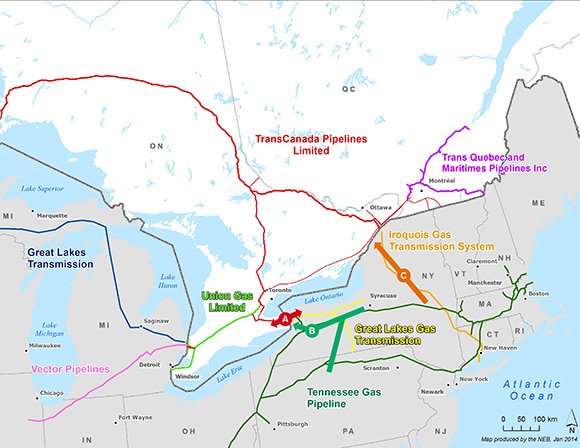
TransCanada’s Eastern Mainline Expansion went into service in late 2012. The project included several modifications to existing infrastructure to increase flow capability in some areas. It also included modifications to the meter station at the Niagara border point (point A in Figure 2), traditionally an export point, to allow gas to flow in either direction. Imports at the Niagara border point averaged 427.5 MMcf/d in 2013, nearly 15 per cent of all Canadian imports that year.
In the U.S., several projects have been constructed or are proposed to increase the flow of gas northward from the Marcellus. Tennessee Gas Pipeline Company’s Northeast Supply Diversification Project (point B) went into service in late 2012, expanding capacity on its pipeline to allow more Marcellus gas to flow northward. Iroquois Gas Transmission System (point C) is proposing to reverse the direction of its pipeline, which has traditionally flowed from Canada to markets in the northeast U.S. Iroquois is currently assessing commercial interest in the project, which could be in service by late 2016.
Natural Gas: The Maritimes
A Distinct Natural Gas Market
The Canadian Maritimes, combined with parts of New England (specifically areas of Maine, New Hampshire, Vermont and northern Massachusetts), forms a distinct natural gas market that responds to regional supply and demand dynamics.
Figure 13 Natural gas infrastructure in the Maritimes and U.S. Northeast Market
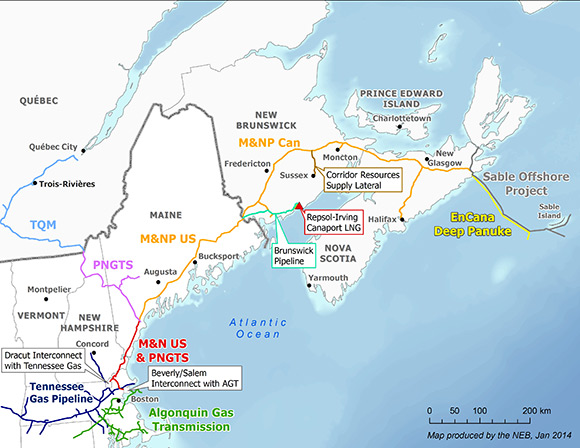
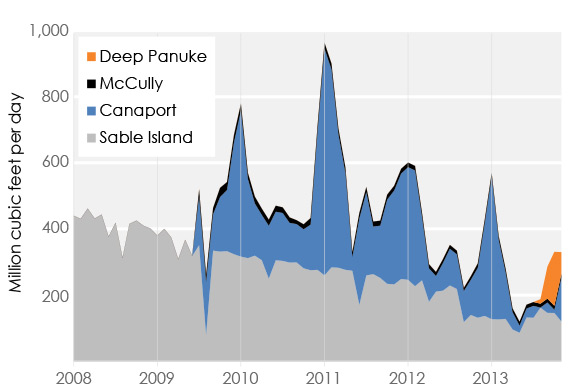
Natural gas has a relatively short history in the Maritimes, beginning in 1999 with the commissioning of the Sable Offshore Energy Project. In autumn 2013, the Deep Panuke offshore project commenced operations, increasing supply to the region considerably. These sources, together with the Canaport LNG import terminal located in Saint John, New Brunswick, form the base of supply in the region. Small amounts are also produced from the McCully conventional gas field in New Brunswick. Additional volumes arrive from the Portland Natural Gas Transmission System, which is connected to the Trans-Québec and Maritimes pipeline, and ultimately the TransCanada Mainline. Beyond these sources, the ability to bring incremental natural gas supplies to the region from the greater North American market is limited by pipeline capacity constraints near the Boston area.
Due to limited supply availability and growing demand in the Maritimes and New England market, during the winter heating season, prices often rise to levels significantly above North American prices in other regions.
During the period December 2012 to March 2013, natural gas spot prices at the regional trading hub at Dracut, Massachusetts averaged US$11.50/MMBtu. In comparison, natural gas during this period averaged about US$3.20/MMBtu in Alberta and US$3.80/MMBtu at Dawn (Ontario).
Figure 14 Source of Supply in the Maritimes
Multiple pipeline expansion projects are being proposed to alleviate existing capacity constraints and increase available supply in the region, including enabling access to the large Marcellus supply. The expansion of pipelines is uncertain, however, and will likely not occur until at least the 2016-17 timeframe. Until pipelines are built or expanded, price spikes during the heating season are likely to continue.
Liquefied Natural Gas
Over 237 million tonnes of LNG (32 Bcf/d of natural gas) was traded internationally in 2012. Qatar, the world’s largest LNG exporter, accounted for 33 per cent of the exports. Japan and South Korea, which depend on LNG imports, made up 52 per cent of global demand. LNG demand is forecast to grow at a rapid pace in the near future, especially in China and other Asian countries, driving proposals for capacity expansions throughout the world. Several LNG terminals are under construction in Australia and if all current and proposed Australian projects are completed, Australia could overtake Qatar as the world’s largest LNG exporter by the end of the decade.
Table 1 NEB Export Licence Applications Related to LNG Export Projects
| Project | Project Stakeholders Export Quantity | Export Quantity Requested (Bcf/d)* |
Expected Start Date |
Potential Pipeline Project |
|---|---|---|---|---|
| * Quantity requested includes the annual tolerance. Projects in bold have received an NEB export licence as of 31 December 2013 |
||||
| Kitimat LNG | Chevron, Apache | 1.40 | 2015 | Pacific Trail Pipelines |
| BC LNG | LNG Partners LLC, Nation Haisla, Golar |
0.25 | 2014 | Pacific Northern Gas (existing) |
| LNG Canada | Shell, Mitsubishi, Korea Gas, PetroChina | 3.70 | 2019 | Coastal Gas Link |
| Pacific NorthWest | Petronas, Japex | 3.15 | 2018 | Prince Rupert Gas Transmission |
| Prince Rupert | BG Group | 3.34 | 2020 | Spectra Energy and BG Group |
| WCC | ExxonMobil, Imperial Oil | 4.60 | 2021 | Undetermined |
| Woodfibre | Pacific Oil and Gas Limited | 0.33 | 2016 | Spectra Energy |
| Jordan Cove | Veresen, Energy Project Development LLC | 1,78 | 2019 | Pacific Connector Gas Pipeline |
| Triton | AltaGas, Idemitsu | 0.36 | 2017 | Pacific Northern Gas (expansion) |
| Goldboro LNG | Pieridae Energy | 1.61 | 2019 | Maritimes & Northeast Pipeline |
| Aurora | Nexen, INPEX, JGC | 3.60 | 2021 | Undetermined |
| Oregon LNG | LNG Development Company, LLC | 1.50 | 2019 | Oregon Pipeline |
| Kitsault | Kitsault Energy | 3.02 | 2018 | Undetermined |
Following the closure of Alaska’s Kenai LNG plant, there are no liquefaction facilities for LNG exports in North America. However, with the abundance of shale gas, dozens of projects are at various stages of planning and development. Table 1 lists proposals for LNG projects for which NEB export licence applications have been filed. As of January 2014, the NEB received 13 export applications associated with LNG facilities. Nine of these were filed in 2013.
Figure 15 Proposed Gas Pipelines to Service LNG Plants
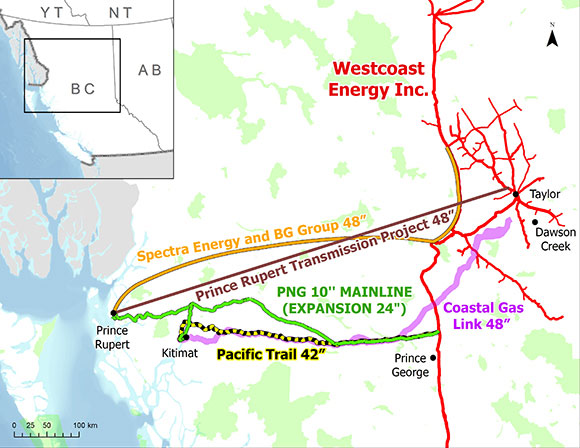
Most of the Canadian projects are located in northwest B.C. near Kitimat and Prince Rupert and most will require new infrastructure to bring gas, and potentially electricity, to the export terminals. The existing Pacific Northern Gas line could only service one of the smaller LNG export proposals. At present, five pipelines are proposed to deliver gas from production areas in the WCSB to the coast.
LNG plants are power-intensive facilities that would need to receive electricity from the BC Hydro grid or use gas supply to run the facilities. The power requirements for the LNG plants represent a notable uncertainty in BC Hydro’s long-term plans. B.C.’s hydroelectric capacity is currently being expanded.
None of the Canadian LNG projects have started construction. Final investment decisions may be influenced by factors including estimated construction costs, pricing arrangements, and competition from other existing or potential LNG exporters.
Electricity: Fuel Source Composition
New Regulations and Cap & Trade Programs Target Electricity Sector Emissions
As part of a plan to reduce emissions to 25 per cent below 1990 levels by 2020, Québec launched its carbon market in 2013, and formally linked it with California’s in January 2014. In Québec, only the electricity and industrial sectors (including refineries and smelters) are currently required to obtain allowances or credits for each ton of CO2 emitted in 2013 and 2014. As of 2015, fuel distributers will also be subject to this cap and trade system. Most of the allowances are allocated for free by the province (or state), while auctions are held where emitters can purchase additional allowances. In Québec’s December 2013 auction, allowances sold at the floor price of $10.75 per allowance.
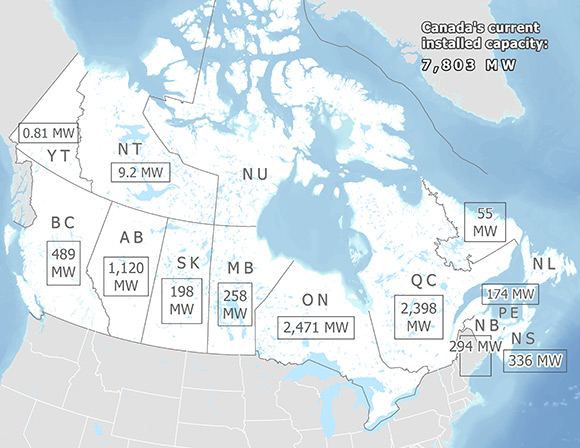
Figure 16 Canadian Installed Capacity by Fuel Source
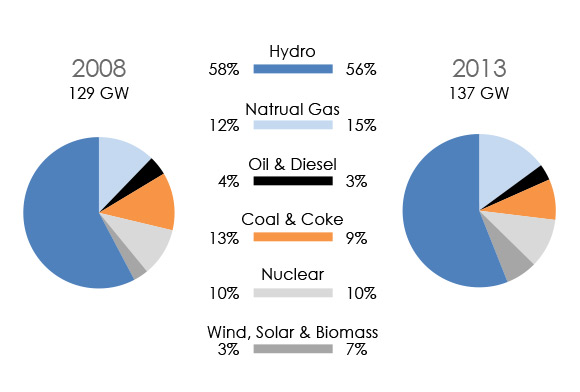
New regulations for U.S. coal-fired power plants were proposed in September 2013, one year after Environment Canada finalized its Reduction of Carbon Dioxide from Coal-Fired Generation of Electricity Regulations. The rules proposed by the U.S. would limit emissions to 500 kg of carbon dioxide (CO2) per megawatt hour (MW.h) for new coal plants or refurbished existing plants, while Canada’s regulations set the limit at 420 kg of CO2 per MW.h. Environment Canada projects that as a result of the new regulations, about a third of 2013 coal-fired capacity (4,000 MW), that otherwise may have had life-extending refurbishments, will be retired by 2030.
Electricity Supply Comes From Different, Greener Sources
New regulations, low natural gas prices and rapidly declining costs for renewable energy are making the electricity sector increasingly "greener". Canada’s coal-fired generation regulations will mostly affect Alberta, Saskatchewan and Nova Scotia. In 2013 and early 2014, Ontario shut down its remaining coal-fired units at the Nanticoke and Lambton generating stations. The province has now shut down 17 of 19 coal-fired units in the province. The last two units in Thunder Bay will be shut down in 2014. Ontario has supplemented its electricity supply by installing more wind and solar power than any other province.
Figure 17 Installed Wind Power Capacity by Province or Territory
Electricity demand in Alberta and Saskatchewan is growing fast, driven by the oil and gas industry. While most generation capacity additions are natural gas-fired, some projects explore other options. In Saskatchewan, the world’s first, commercial-scale carbon capture and storage project at the Boundary Dam Power Station is nearing completion. The project will allow the coal plant to comply with new regulatory requirements. In September 2013, Alberta’s first commercial international power line began operations. The Montana-Alberta Tie Line is primarily used to import wind energy from Montana into the Alberta market.
In December 2013, the Northwest Territories (N.W.T.) released a three-year Energy Action Plan that calls for the displacement of imported oil and greater use of hydro, wind, biomass and solar resources. The N.W.T. has developed 55 MW of an estimated 11,500 MW of hydro potential. About half of N.W.T.’s electricity generation is from diesel generators.
Electricity: Canadian Exports
Hydro and Nuclear Generation Drive Record Exports
The bulk of international electricity trade in North America takes place between the provinces of Québec, Ontario, Manitoba and B.C., and the U.S. In 2013, availability of hydro and nuclear power pushed Canadian net exports to a 10-year high. However, lower electricity prices in U.S. markets translated into lower export revenues. Continuing low U.S. prices could hinder plans for future capacity expansions in Canada.
Figure 18 Canadian Electricity Trade and Export Revenue
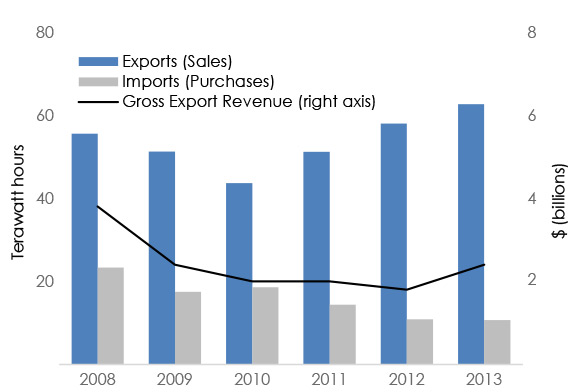
B.C. trades significant amounts of electricity. While the province imported more electricity than it exported in 2013, it posted a positive trade balance in terms of revenue.
Québec’s exports, usually the highest in the country, reached record levels in 2012 and 2013. Proposals for additional interconnects to deliver power from Québec to the U.S., such as the Northern Pass and the Champlain-Hudson Power Express, are driven by supply availability. The latter project, a proposed 1,000 MW transmission line between the Canadian border and New York City, was approved by the New York Public Service Commission in 2013.
Over the last few years, Ontario electricity supply has exceeded demand, due in part to the availability of nuclear power following the refurbishment of two Bruce A units. This remained the case in 2013, despite the retirement of close to 3,000 MW of coal-fired capacity. Surplus electricity is exported, which pushed the province’s net exports to a 10-year high in 2013. In October, the Ontario government confirmed that while existing nuclear units will be refurbished, no new nuclear plants will be built in the near future.
Although relatively small, New Brunswick’s net exports in 2013 reached the highest level since 2006 following the return to service of the Point Lepreau nuclear station in late 2012.
Manitoba’s overall exports remained high in 2013, despite declining revenues. Electricity prices in the Midwest have been declining for years due to a lull in demand growth, lower natural gas prices and rapid growth in local wind power. Consequently, the timing of Manitoba Hydro’s proposed Keeyask (695 MW) and Conawapa (1,485 MW) dams is more uncertain. Keeyask is currently under review by the Manitoba Clean Energy Commission and a decision is expected in mid-2014. Manitoba Hydro’s 500 kV Bipole III transmission line received Manitoba government approval in mid-2013.
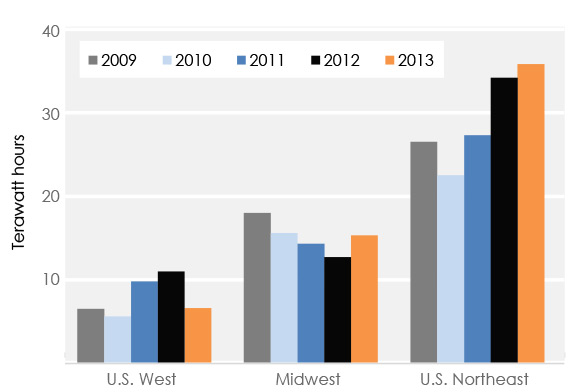
Figure 19 Destination of Canadian Electricity Exports
More Hydro Power for the Atlantic Provinces
In 2013, construction activities increased at Muskrat Falls, the 824 MW hydroelectric station in Labrador, while the proposed transmission cables between Labrador, Newfoundland and Nova Scotia have obtained key provincial and federal approvals. Muskrat Falls will provide hydro power to Newfoundland, which reserved 40 per cent of the electricity generated by the project, and Nova Scotia. Retail electricity prices in Nova Scotia are among the highest in Canada due in part to high natural gas prices in the constrained Maritime market. Looking for alternatives, Nova Scotia Power contracted 20 per cent of Muskrat Falls’ output and signed an agreement guaranteeing access to additional blocks of energy.
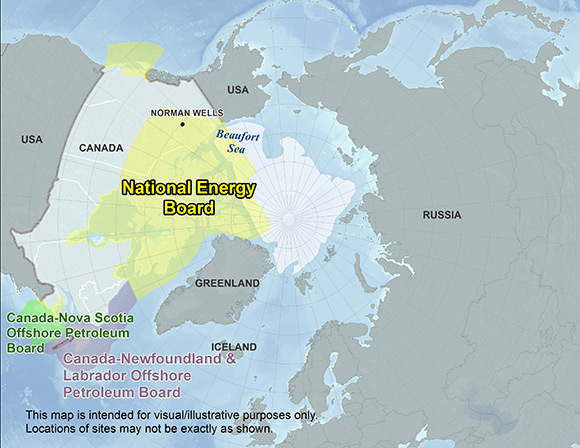
Energy in the North and Offshore
Energy consumption in Canada’s North occurs in many remote locations. Electricity supply is generated relatively close to the towns and industrial sites, mostly coming from diesel generators, biomass facilities or hydroelectric dams. Norman Wells and Inuvik are presently the only two towns in the N.W.T. with natural gas service. However, due to declining production in nearby fields, these towns are increasing their use of heating fuels delivered by truck.
Onshore Oil and Gas Production in the North
The NEB currently has regulatory responsibilities for oil and gas exploration and production activities in the N.W.T. and Nunavut. In April 2014, regulation of the oil and natural gas industry in the onshore N.W.T. will transfer from the NEB to the Government of N.W.T.
Figure 20 Oil (Top) and Gas (Bottom) Production in N.W.T.
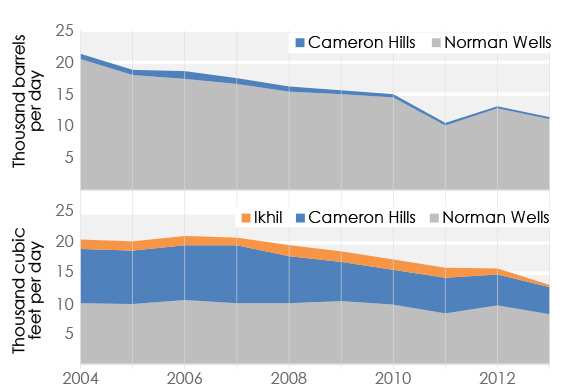
Almost all of the oil produced in the North is shipped south to Alberta. There are two oil fields (Norman Wells and Cameron Hills) and one gas field (Ikhil) currently producing in the N.W.T. Oil and natural gas production from these fields declined 13 per cent and 17 per cent between 2012 and 2013, respectively. Current shale oil exploration activity in the Central Mackenzie Valley may lead to production growth that might curb the long term decline trends. For example, from 2011 to 2013, successful bids were received for 14 parcels of land totaling over $600 million.
Offshore Developments
The NEB regulates drilling in the Arctic and in other offshore areas not defined under other agreements.[2] The offshore continental shelves in Arctic Canada are considered to be highly prospective for oil and gas with 19 significant discovery licences (SDL) issued for the Arctic Islands and 60 SDLs in the Mackenzie Delta/Beaufort Sea region, where discovered resources exceed one billion barrels of oil and ten trillion cubic feet of gas. In September 2013, Imperial Oil Canada, Exxon Mobil and BP jointly filed a project description with the Inuvialuit Environmental Impact Screening Committee for an exploratory offshore well in the Beaufort Sea, 175 km northwest of Tuktoyaktuk, N.W.T. Also, ConocoPhillips is in the initial planning stages for development of the Amauligak field, discovered in 1984.
Figure 21 Energy Regulatory Oversight in the North and Offshore
In August 2013, Statoil Canada Exploration and Husky Energy announced a light oil discovery, estimated to hold between 300 and 600 MMb of recoverable oil, about 500 km northeast of St. John’s, Newfoundland. The proponents anticipate a start-up date of 2022-2023.
In the Nova Scotia offshore, exploration continues as a result of $2.1 billion in work commitments bid in 2011 and 2012. The Gulf of St. Lawrence is also an area of interest, with exploration in the Anticosti Basin and Old Harry regions and more than 45 explorations licences issued to date.
Appendices
Appendix A.1 List of Acronyms
Appendix A.2 About this Report
The National Energy Board (NEB or Board) is an independent federal regulator whose purpose is to promote safety and security, environmental protection and efficient infrastructure and markets in the Canadian public interest within the mandate set by Parliament for the regulation of pipelines, energy development, and trade.
The Board’s main responsibilities include regulating the construction and operation of interprovincial and international oil and natural gas pipelines, international power lines, and designated interprovincial power lines. Furthermore, the Board regulates the tolls and tariffs for the pipelines under its jurisdiction. With respect to the specific energy commodities, the Board regulates the export of natural gas, oil, natural gas liquids and electricity, and the import of natural gas. Additionally, the Board regulates oil and natural gas exploration and development on frontier lands and offshore areas not covered by provincial or federal management agreements.
For oil and natural gas exports, the Board’s role is to evaluate whether the oil and natural gas proposed to be exported is surplus to reasonably foreseeable Canadian requirements, having regard to the trends in the discovery of oil or gas in Canada. The Board monitors energy markets, and provides its view of Canadian energy requirements and trends in discovery of oil and natural gas to support its responsibilities under Part VI of the National Energy Board Act (the NEB Act). The Board periodically publishes assessments of Canadian energy supply, demand and markets in support of its ongoing market monitoring. These assessments address various aspects of energy markets in Canada. This report, Canadian Energy Dynamics: 2013 is one such assessment that examines elements of Canadian energy markets and how these elements changed in 2013.
If a party wishes to rely on material from this report in any regulatory proceeding before the NEB, it may submit the material, just as it may submit any public document. Under these circumstances, the submitting party in effect adopts the material and that party could be required to answer questions pertaining to the material. This report does not provide an indication about whether any application will be approved or not. The Board will decide on specific applications based on the material in evidence before it at that time.
Endnotes
[1] Some annual statistics quoted in this report include estimates for one or more months of data for 2013.
[2] Nova Scotia and Newfoundland and Labrador each have agreements with the Canadian government.
- Date modified: