ARCHIVED – Canada’s Renewable Power Landscape 2017 – Energy Market Analysis
This page has been archived on the Web
Information identified as archived is provided for reference, research or recordkeeping purposes. It is not subject to the Government of Canada Web Standards and has not been altered or updated since it was archived. Please contact us to request a format other than those available.

Canadian Overview
In 2016, Canada’s electricity generation was 66.0% renewable and was 80.6% non-emitting in operation. Since 2005, generation has trended away from coal and towards increased generation from natural gas and wind.
TABLE 1 Electric Capacity and Generation in Canada
| Capacity in MW and % | Generation in GW.h and % | |||||
|---|---|---|---|---|---|---|
| 2005 | 2015 | 2016 | 2005 | 2015 | 2016 | |
| Oil and Diesel | 4 795 | 3 842 | 3 837 | 10 608 | 4 041 | 3 436 |
| 3.9% | 2.7% | 2.6% | 1.8% | 0.6% | 0.5% | |
| Natural Gas | 13 191 | 22 006 | 21 499 | 40 875 | 66 060 | 65 512 |
| 10.8% | 15.2% | 14.7% | 6.8% | 10.2% | 9.6% | |
| Coal | 16 003 | 9 661 | 9 661 | 96 750 | 62 256 | 60 374 |
| 13.1% | 6.7% | 6.6% | 16.1% | 9.6% | 9.3% | |
| Nuclear | 12 805 | 14 273 | 14 273 | 86 669 | 95 682 | 95 418 |
| 10.5% | 9.9% | 9.7% | 14.4% | 14.8% | 14.6% | |
| Solar | 17 | 2 135 | 2 310 | 0 | 3 001 | 3 568 |
| <0.1% | 1.5% | 1.6% | 0.0% | 0.5% | 0.5% | |
| Biomass | 1 804 | 2 414 | 2 702 | 7 688 | 12 511 | 13 214 |
| 1.5% | 1.7% | 1.8% | 1.3% | 1.9% | 2.0% | |
| Wind | 557 | 11 072 | 11 902 | 1 453 | 28 314 | 30 462 |
| 0.5% | 7.6% | 8.1% | 0.2% | 4.4% | 4.7% | |
| Hydro | 72 890 | 79 434 | 80 403 | 358 387 | 374 116 | 383 392 |
| 59.7% | 54.8% | 54.8% | 59.5% | 57.9% | 58.8% | |
| All renewable sources | 75 268 | 95 056 | 97 317 | 367 528 | 417 942 | 430 636 |
| 61.7% | 65.6% | 66.4% | 61.0% | 64.7% | 66.0% | |
| All sources | 122 061 | 144 838 | 146 588 | 602 430 | 645 981 | 652 375 |
Generation Trends
Hydro is Canada’s largest source of electricity, averaging 59.6% of total generation from 2005 to 2016. Hydroelectricity is generated primarily in Yukon, B.C., Manitoba, Ontario, Quebec, and Newfoundland and Labrador. Nuclear, currently located exclusively in Ontario and New Brunswick, supplied on average 14.7% of Canada’s electricity from 2005 to 2016, and was the second largest source of total generation. The share of natural gas generation increased from 6.8% to 9.6% between 2005 and 2016, while coal and oil generation declined, mainly due to new emissions-reduction plans, including Ontario’s coal phase-out.
Non-hydro renewable generation has grown since 2005, from 1.5% to 7.2% of total generation. Total wind generation grew the most during this period, increasing from just 0.2% to 4.7% of generation. Solar also saw growth, almost exclusively in Ontario, from zero in 2010 to 0.5% of Canadian electricity generation in 2016. Biomass grew from 1.3% to 2.0% of generation between 2005 and 2016.
Capacity Changes in 2016
Net Canadian natural gas, oil and diesel capacity decreased in 2016. This was primarily due to the retirement of the Burrard Thermal Generating Station, among other retirements.
Hydro, wind, biomass, and solar experienced an estimated combined growth of 2 261 MW. Together, renewables’ share of total Canadian capacity increased by 0.8% from 2015.
More Information
Canada’s Renewable Power Landscape 2016 – Energy Market Analysis provides additional information on renewable power in Canada.
FIGURE 5 – Electricity Generation by Source in Canada
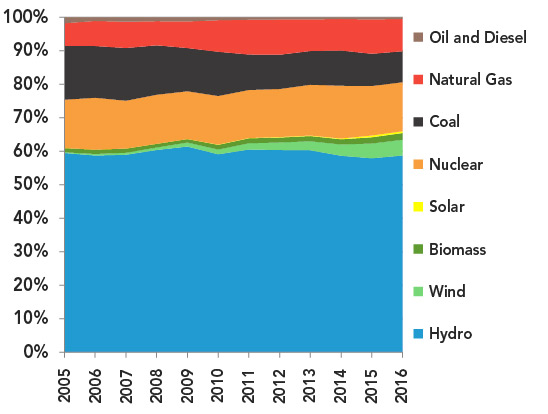
Description
This graph shows the composition of Canada’s electricity generation between 2005 and 2016. Hydro averaged 59.6%. Wind increased from 0.2% to 4.7%. Biomass increased from 1.3% to 2.0%. Solar grew from zero to 0.5%. Coal declined from 16.1% to 9.3%. Natural gas increased from 6.8% to 9.6%. Oil and diesel declined from 1.8% to 0.5%.
FIGURE 6 – Net Capacity Changes in 2016
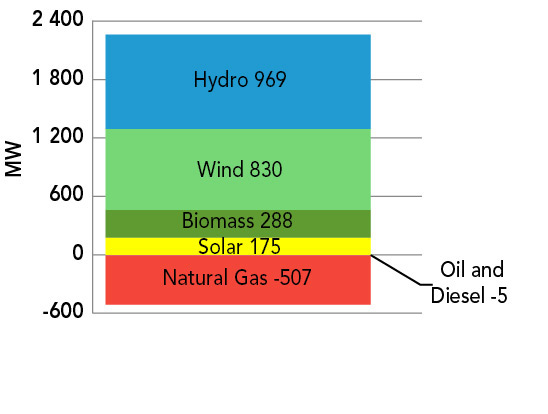
Description
This stacked bar chart illustrates estimated net changes to Canada’s capacity in 2016. Hydro increased by 969 MW, wind by 830 MW, biomass by 288 MW, and solar by 175 MW. Oil and diesel capacity decreased by 5 MW, and natural gas by 507 MW.
- Date modified: