ARCHIVED – Canada’s Renewable Power Landscape 2017 – Energy Market Analysis
This page has been archived on the Web
Information identified as archived is provided for reference, research or recordkeeping purposes. It is not subject to the Government of Canada Web Standards and has not been altered or updated since it was archived. Please contact us to request a format other than those available.

British Columbia
B.C. generated 98.4% of its electricity from renewable sources in 2016, up from 95.0% in 2015. Although dominated by hydro, wind capacity has been growing in B.C. since 2009.
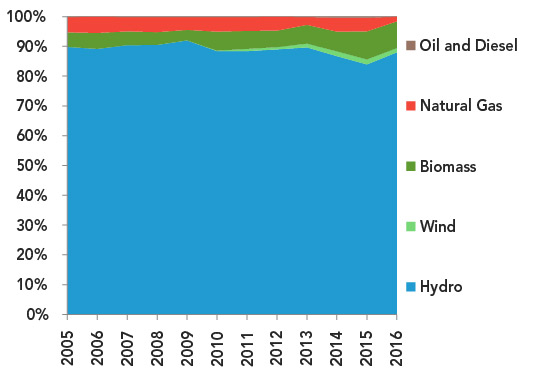
FIGURE 7 Electricity Generation by Source in British Columbia
Description
This graph shows the composition of B.C.’s electricity generation between 2005 and 2016. Hydro averaged 88.9% of generation. Wind increased from 0% in 2008 to 1.4% in 2016. Biomass doubled from 4.8% to 9.0%. Natural gas generation declined from 5.1% to 1.5% of generation from 2005 to 2016.
TABLE 2 Electric Capacity and Generation in British Columbia
| Capacity in MW and % | Generation in GW.h and % | |||||
|---|---|---|---|---|---|---|
| 2005 | 2015 | 2016 | 2005 | 2015 | 2016 | |
| Oil and Diesel | 82 | 82 | 82 | 88 | 266 | 56 |
| 0.5% | 0.5% | 0.5% | 0.1% | 0.4% | 0.1% | |
| Natural Gas | 1 320 | 1 474 | 530 | 3 445 | 3 305 | 1 115 |
| 8.8% | 8.2% | 3.0% | 5.1% | 4.6% | 1.5% | |
| Biomass | 811 | 886 | 907 | 3 254 | 6 738 | 6 727 |
| 5.4% | 4.9% | 5.1% | 4.8% | 9.4% | 9.0% | |
| Wind | 0 | 488 | 488 | 0 | 1 206 | 1 059 |
| 0.0% | 2.7% | 2.8% | 0.0% | 1.7% | 1.4% | |
| Hydro | 12 847 | 15 029 | 15 709 | 60 327 | 60 344 | 65 524 |
| 85.3% | 83.7% | 88.7% | 89.9% | 84.0% | 88.0% | |
| All renewable sources | 13 658 | 16 403 | 17 104 | 63 581 | 62 288 | 73 310 |
| 90.7% | 91.3% | 96.5% | 94.7% | 95.0% | 98.4% | |
| All sources | 15 060 | 17 959 | 17 717 | 67 114 | 71 859 | 74 482 |
Generation Trends
B.C.’s natural geography and public policies have contributed to the establishment of hydro as the province’s largest source of electricity. In 2016, over 30 BC Hydro facilities, and over 70 independently-owned hydro facilities, some over 100 years old, generated 88.0% of B.C.’s electricity. Biomass was the second largest source of electricity, mainly consuming wood waste from the forestry, and pulp and paper industries. Biomass generated 6 727 GW.h, or 9.0% of generation, in 2016. This is the highest biomass share of any province or territory.
Total renewable generation grew in relative share due to a significant decrease in natural gas generation, from 3 305 GW.h in 2015 to 1 115 GW.h in 2016, and an increase in hydro generation. Natural gas accounted for only 1.5% of total generation in 2016, down from a ten year average of 4.4%.
Capacity Changes in 2016
B.C. added an estimated 680 MW of hydro capacity in 2016. Major sources of this addition include the Waneta Expansion, the Mica Unit 6 Project, and the new McLymont Creek hydro facility.
Natural gas capacity decreased by over 900 MW, due to the retirement of the Burrard Thermal Generating Station.
More Information
Canada’s Renewable Power Landscape 2016 – Energy Market Analysis provides additional information on renewable power in British Columbia.
Residential Bills and Greenhouse Gas Generation Intensity
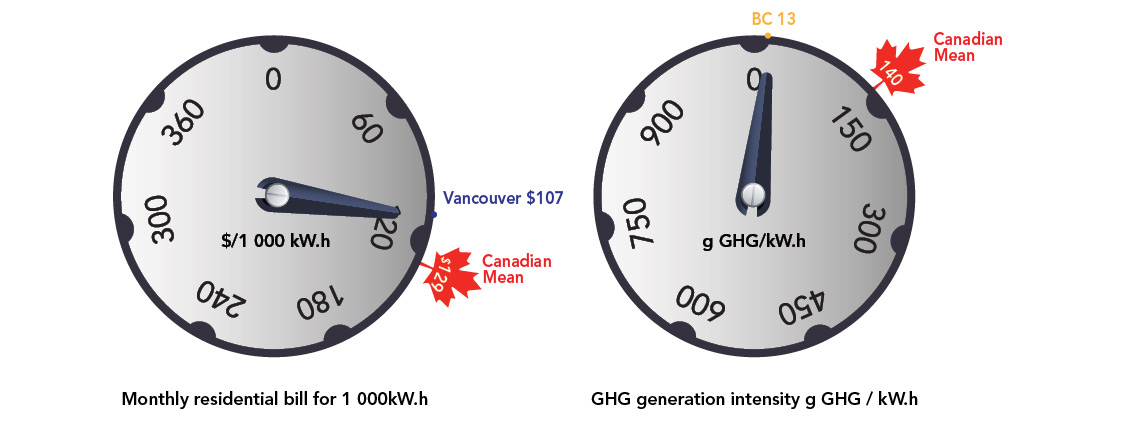
B.C.’s most populous city, Vancouver, has a relatively low residential electricity bill of $107 for 1 000 kW.h compared to the Canadian mean of $129 per 1 000 kW.h. British Columbia’s GHG generation intensity is also much lower than most of Canada, emitting 13 grams of GHGs per kW.h compared to the mean of 140 g GHG/kW.h.
FIGURE 8
Source and Description
Source:
Hydro-Québec, National Inventory Report
Description:
Two dials indicate the monthly residential electricity bill for 1 000 kW.h and the GHG generation intensity in grams of GHG
per kW.h. B.C.’s most populous city, Vancouver, has a relatively low residential electricity bill of $107 for 1 000 kW.h, compared to the Canadian mean
of $129 per 1 000 kW.h. British Columbia’s GHG generation intensity is also much lower than most of Canada, emitting 13 grams of GHGs per kW.h
compared to the mean of 140 g GHG/kW.h.
- Date modified: