ARCHIVED – Canada’s Renewable Power Landscape 2017 – Energy Market Analysis
This page has been archived on the Web
Information identified as archived is provided for reference, research or recordkeeping purposes. It is not subject to the Government of Canada Web Standards and has not been altered or updated since it was archived. Please contact us to request a format other than those available.

Greenhouse gas (GHG) emissions overview
In 2015, Canada emitted 722 megatons of carbon dioxide equivalent (Mt CO2 eq). Of these emissions, 10.9% came from electricity generation.
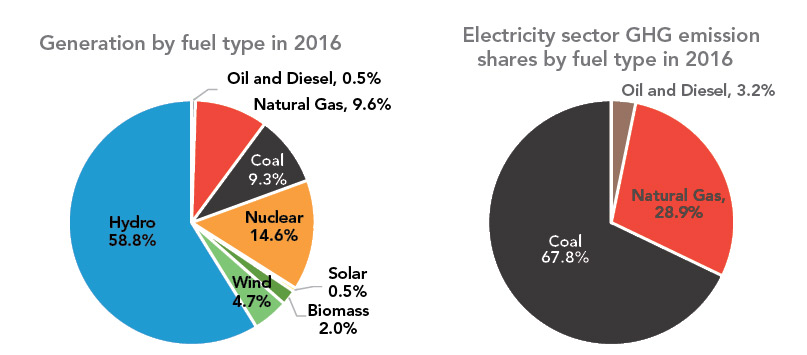
In 2016, 80.6% of Canada’s electricity was generated from sources that are non-emitting when generating.Footnote 2 The remaining generation -- from oil and diesel, natural gas, coal, -- produced all of the emissions from electricity generation.
FIGURE 1
Source and Description
Source:
NEB
Description:
Two pie charts illustrate Canada’s electricity generation by fuel type in 2016, and GHG emissions share by fuel type in 2016, respectively. Hydro accounted for 58.8% of electricity generation, followed by 14.6% nuclear, 9.3% coal, 9.6% natural gas, 4.7% wind, 2% biomass, 0.5% oil and diesel, and 0.5% solar.
Coal produced 67.8% of Canada’s emissions from electricity generation, followed by 28.9% from natural gas 3.2% from oil and diesel.
In total, electricity generation emitted 78.7 Mt CO2 eq in 2015 down from 116.9 Mt CO2 eq in 2005, when it produced 15.8% of total emissions. The reduced emissions resulted from improvements in technology and a shift towards lower GHG-emitting generation sources in the electricity sector. For more information on the trends in Canadian electricity generation, see the Canadian Overview.
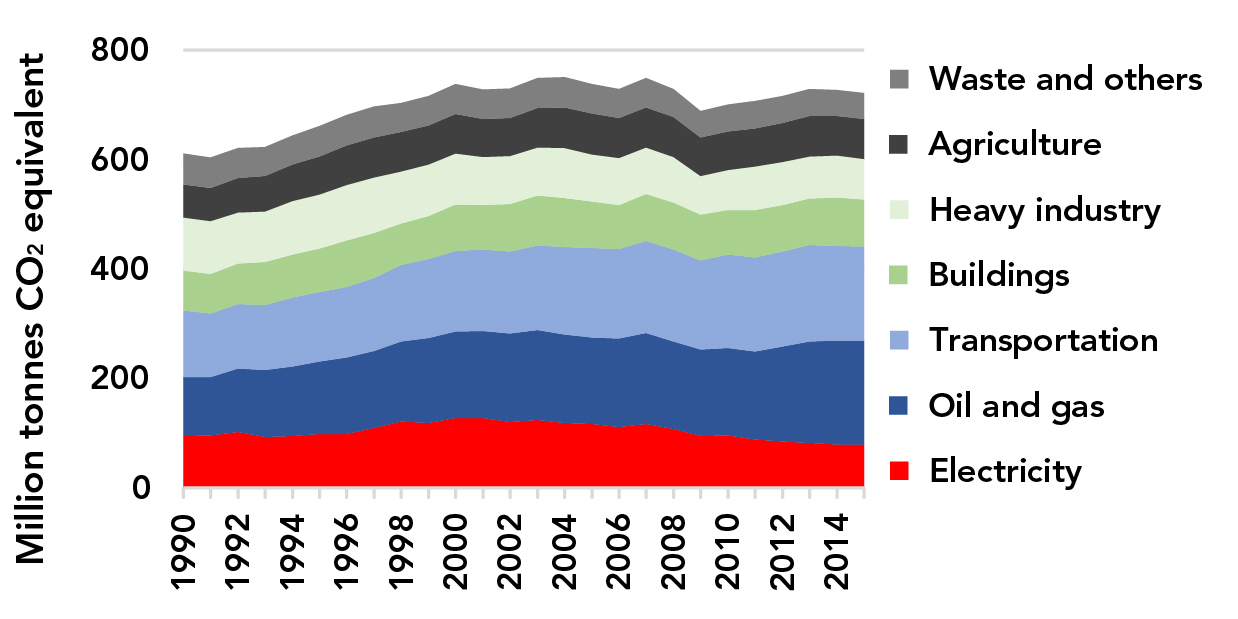
FIGURE 2 – Canadian GHG emissions by sector
Source and Description
Source:
ECCC Table S-3
Description:
This stacked area chart illustrates Canadian GHG emissions from the electricity, oil and gas, transportation, buildings, heavy industry, and agricultural sector. The electricity sector’s share of emissions has declined from 15.8% of total emissions in 2005 to 10.9% in 2015.
GHG intensity of electricity generation
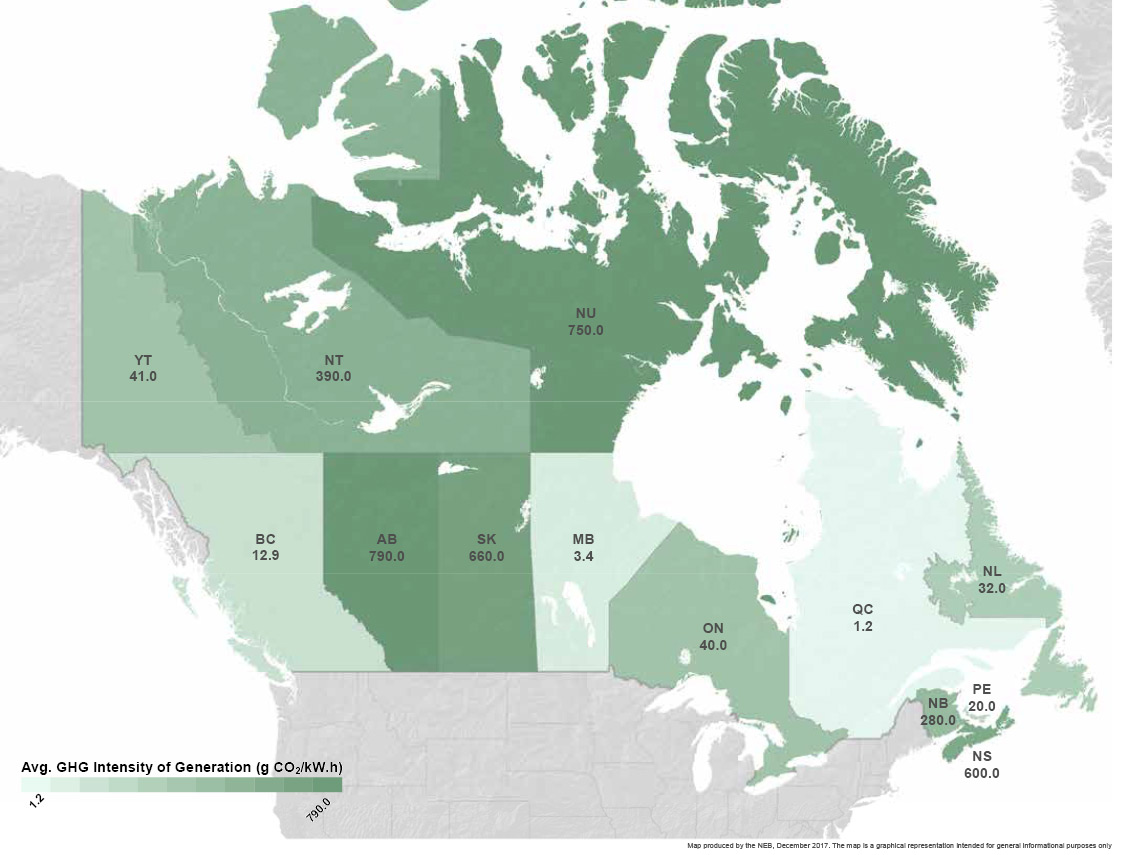
Depending on the unique mix of fuels used in electricity generation, each province and territory emits a different quantity of GHGs per unit of electricity generated. This ratio of GHGs per unit of electricity is called the GHG intensity of electricity generation. Regions that rely primarily on hydro, including B.C., Yukon, Manitoba, Quebec, and Newfoundland and Labrador, have some of the lowest GHG intensities in Canada: for example, Quebec emitted only 1.2 grams of carbon dioxide equivalent per kilowatt-hour generated in 2015. In contrast, regions that rely on fossil fuels such as coal and oil products, had GHG intensities as high as 790 grams of CO2 eq per kW.h.
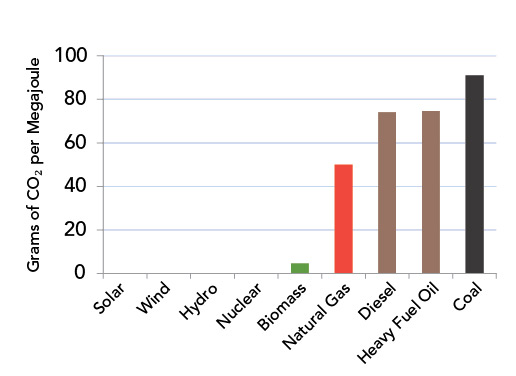
FIGURE 3 – Emissions by fuel type
Source and Description
Source:
ECCC Table A.6
Description:
This chart shows CO2 emissions by fuel type in grams of CO2 equivalent per megajoule (g/MJ). There are no emissions during the generation of solar, wind, hydro, or nuclear electricity. Biomass emits 4.59g/MJ, followed by natural gas at 49.88g/MJ, diesel at 74.08g/MJ, heavy fuel oil at 74.58g/MJ, and coal at 90.87g/MJ.
FIGURE 4 – Greenhouse gas intensity of electricity generation by province and territory
Source and Description
Source:
National Inventory Report 2017
Description:
This shaded map shows the relative GHG intensity of each province and territory. Regions shaded lightly have a GHG intensity below the national average of 140 g CO2/kW.h, while those with dark shading have GHG intensities above the national average. Quebec has the lowest GHG intensity, at 1.2 g CO2/kW.h, followed by Manitoba (3.4 g CO2/kW.h), B.C. (12.9 g CO2/kW.h), PEI (20.0 g CO2/kW.h), Newfoundland and Labrador (32.0 g CO2/kW.h), Ontario (40.0 g CO2/kW.h), Yukon (41.0 g CO2/kW.h), New Brunswick (280.0 g CO2/kW.h), NWT (390.0 g CO2/kW.h), Nova Scotia (600.0 g CO2/kW.h), Saskatchewan (660.0 g CO2/kW.h), Nunavut (750.0 g CO2/kW.h), and Alberta (790.0 g CO2/kW.h).
- Date modified: