ARCHIVED – Chapter 3. Reference and HCP Case Results
This page has been archived on the Web
Information identified as archived is provided for reference, research or recordkeeping purposes. It is not subject to the Government of Canada Web Standards and has not been altered or updated since it was archived. Please contact us to request a format other than those available.
Content
Overview
- This chapter focuses on the results of the Reference and HCP cases. Chapter 4 describes the outcomes of the Technology Case.
- Detailed data tables supporting the discussion in this Chapter are available in the online Data Appendices. Historical data is sourced primarily from Statistics Canada’s Report on Energy Supply and Demand in Canada. That data is supplemented with additional details from various federal and provincial data sources. Please contact energyfutures@cer-rec.gc.ca with any questions regarding the historical energy data.
Macroeconomic Drivers
- The economy is a key driver of the energy system. Economic growth, industrial output, inflation, exchange rates, and population growth all influence energy supply and demand trends.
- Macroeconomic projections for each of the scenarios were provided by The Centre for Spatial Economics (C4SE). C4SE developed unique projections of key macroeconomic indicators such as gross domestic product, exchange rate, and industry gross output for each of the scenarios, based on the price assumptions and output of the NEB’s supply and demand models.
- Key economic variables are shown in Table 3.1. Economic growth averages 1.73% per year over the projection period in the Reference Case.
Table 3.1 - Economic indicators, Reference and HCP Cases
| Economic Indicator | Compound Average Annual Growth Rate (unless otherwise noted) | ||
|---|---|---|---|
| 1990-2015 | Reference Case (2016-2040) |
HCP Case (2016-2040) | |
| Real Gross Domestic Product | 2.3% | 1.73% | 1.72% |
| Population | 1.0% | 0.76% | 0.76% |
| Inflation | 1.9% | 1.93% | 1.93% |
| Exchange Rate (average) | 81.3 US/C$ | 83.7US/C$ | 83.4 US/C$ |
- Compared to the past 25 years, the pace of economic growth is slower in both the Reference and HCP cases.
- Economic growth in the HCP Case is slightly lower than in the Reference Case, largely due to somewhat lower global demand for the fossil fuels and fossil fuel-intensive goods that Canada exports. This includes crude oil, petrochemicals, and some manufactured products. In addition, higher prices for fossil fuel energy increases costs for consumers and businesses, increases inflation and slows economic growth relative to the Reference Case.
- Despite this, the impact on economic growth is small, with economic activity 0.2% lower in the HCP Case compared to the Reference Case in 2040. Two key effects offset the negative economic impacts of higher carbon pricing:
- The analysis assumes that, in the longer term, revenue from higher carbon pricing is returned to consumers and business through personal and corporate income tax reductions. This shift in taxation has positive economic impacts relative to the Reference Case.
- The higher price for fossil fuel energy in the HCP Case encourages businesses to rely less on energy and more on labour and machinery when it is possible to substitute between production inputs. For example, a manufacturer may choose to replace their low efficiency boiler sooner than they would have without higher carbon pricing. This increases investment and enhances productivity, resulting in greater economic growth in the long term.
Key Uncertainties
- International demand for Canadian goods, the production of which can be energy-intensive, will influence export-oriented industries. Faster or slower economic growth in the United States (U.S.), Canada’s largest trading partner, would affect the economic and energy demand projections. The impact of greater global climate action on demand for GHG-intensive goods is highly uncertain and could impact growth of heavy industry in Canada.
- Large projects in the mining, oil, natural gas, and electricity sectors affect the macroeconomic projections in a number of provinces. The pace of these developments is uncertain and could lead to higher or lower economic growth.
- As noted in Chapter 2, a price on carbon can be a driver of innovation and investment in technologies that would reduce GHG emissions. It is difficult to predict the innovations and accompanying economic activity that may develop due to a greater economic incentive to reduce GHG emissions.
Energy Demand
- This section focuses mainly on end-use, or secondary energy demand. Secondary demand excludes energy used to generate electricity, which is accounted for in primary demand.
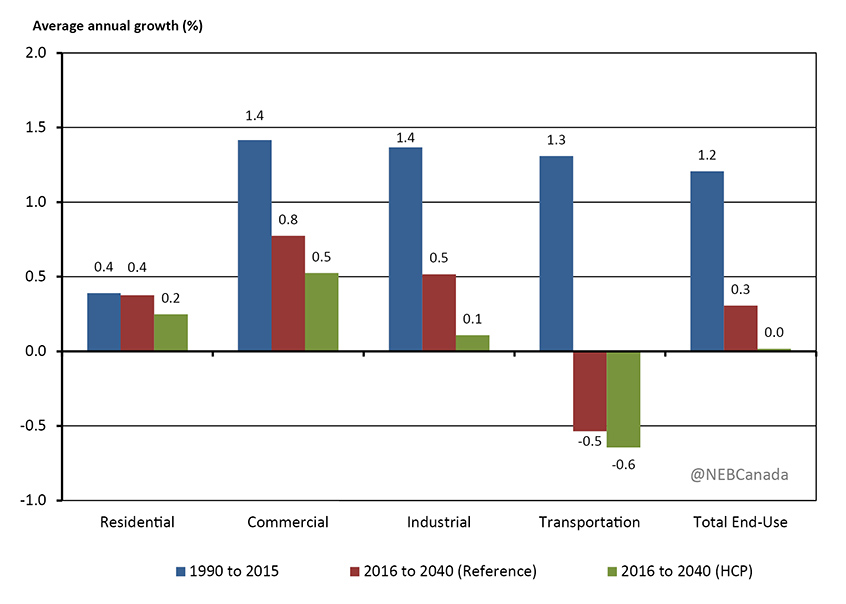
- Figure 3.1 shows annual average growth rates of energy use by sector over the past 25 years and from 2016 to 2040 in the Reference and HCP cases. Compared to the 1990-2015 period, when demand grew by an average of 1.2% per year, end-use energy demand in the Reference Case grows considerably more slowly over the outlook period, averaging growth of 0.3% per year.
Figure 3.1 - Historical and Projected Average Annual Growth in End-Use Energy Demand by Sector, Reference and HCP Cases
Description
This graph displays historical and projected average annual growth in end-use energy demand across the residential, commercial, industrial, and transportation sectors as well as total end-use demand for the Reference Case and the HCP Case. Average annual end-use energy demand growth in the residential sector was 0.4% from 1990-2015. In the Reference Case residential end use demand is projected to be 0.4%, and in the HCP Case it is 0.2% from 2016-2040. Average annual end-use energy demand growth in the commercial sector was 1.4% from 1990-2015. In the Reference Case it is projected to be 0.8% and in the HCP Case it is 0.5% from 2016-2040. Average annual end-use energy demand growth in the Industrial sector was 1.4% from 1990-2015. In the Reference Case it is projected to be 0.5% and in the HCP Case it is 0.1% from 2016-2040. Average annual end-use energy demand growth in the transportation sector was 1.3% from 1990-2015. In the Reference Case it is projected to be -0.5% and in the HCP Case it is -0.6% from 2016-2040. Average annual end-use energy demand growth for total end-use was 1.2% from 1990-2015. In the Reference Case it is projected to be 0.3% and in the HCP Case it is 0.0% from 2016-2040.
- Unlike previous Energy Futures Reference Case outlooks, end-use demand eventually begins to decline near the end of the projection period. Total end-use energy demand peaks in 2037 at nearly
12 155 petajoules (PJ). Energy consumption slowly declines for the remainder of the projection period. - There are many reasons why energy use grows more slowly than history, and eventually starts to decline near the end of the projection period. Some key factors include:
- Economic and population growth influence energy use and, as shown in Table 3.1, both grow at slower rates in the projection period compared to history. Canada also has a long trend of declining energy use per dollar of economic activity, which is typical of developed countries. This trend continues in the projection period.
- Energy efficiency has improved in many areas in the past, and continues to improve in the projection period. This reduces energy demand growth because less energy is required for new devices and equipment. For example, since 1990, lower efficiency natural gas furnaces have nearly been entirely replaced by medium and high efficiency units that are 30% to 50% more efficient. In recent years, the stock of medium efficiency furnaces has declined, while high efficiency units continue to grow.
- Although oil and natural gas prices are currently lower than their recent peaks, Figures 2.2 and 2.3 show that both prices are assumed to increase from current levels over the projection period. This will further slow demand growth.
- The pan-Canadian approach for pricing carbon pollution is included in the Reference Case. An economy-wide carbon price will have a downward impact on energy use trends. A recent review of a variety of studies on B.C.’s carbon price finds that the policy reduced demand and GHG emissions between 5 and 15% compared to what would have occurred without carbon pricing.
- Several other policies, programs and regulations affect energy use in the projection period. For example, light and heavy duty vehicle emission standards will improve the efficiency of new vehicles in both the passenger and freight sectors over the projection period.
- Compared to the Reference Case, total end-use demand growth is lower in the HCP Case. Demand grows until peaking in 2022, more than a decade earlier than in the Reference Case. After 2022, demand declines at an average annual rate of 0.3%, and is nearly 800 PJ lower than the Reference Case by 2040.
Residential and Commercial
- Residential energy use is the energy consumed by Canadian households. This includes energy used for space and water heating, air conditioning, lighting, large appliances, and other devices like televisions and computers. The residential sector made up 14% of total end-use demand in 2015.
- In the Reference Case, energy use in the residential sector increases from 1 570 PJ in 2016 to 1 717 PJ in 2040, or 9%. Population growth, a key driver in residential energy use, grows by 20% over that period, implying that residential energy use per person declines. This continues the historical trend of energy use per household declining, and is influenced by many factors including energy prices and energy efficiency improvements.
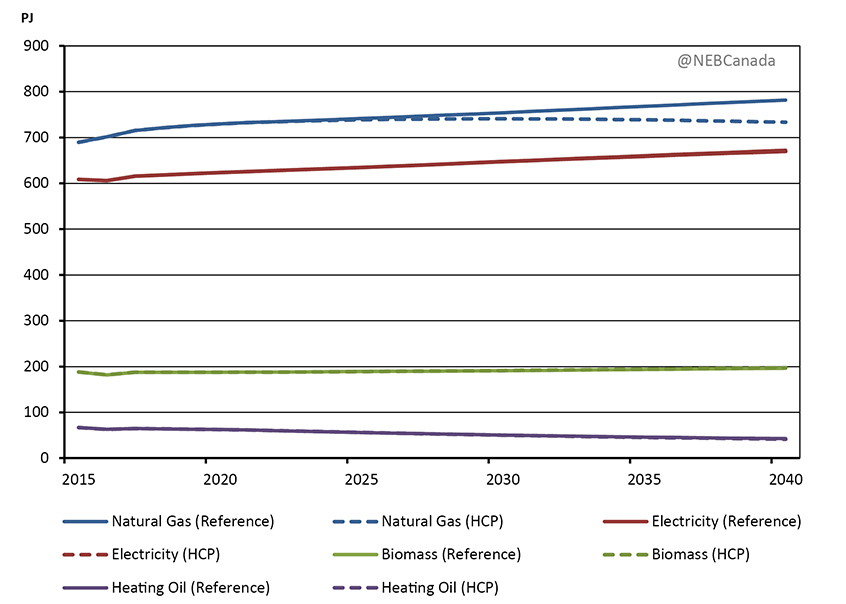
- In the HCP Case, energy use grows slightly slower and in 2040 total energy use is 50 PJ less than in the Reference Case. Figure 3.2 shows energy use by fuel in the Reference and HCP cases.
Figure 3.2 - Residential Energy Demand by Major Fuel, Reference and HCP Cases
Description
This graph shows the projected change in residential energy demand by major fuel in the Reference and HCP Cases from 2015 to 2040. The fuel sources included in the graph are natural gas, electricity, heating oil and biomass. Annual natural gas use increases from 690 PJ in the Reference Case to 782 PJ in 2040, and to 733 PJ in the HCP Case. Annual electricity use increases from 608 PJ in the Reference Case to 672 PJ, and 670 PJ in the HCP Case. Biomass use increases from 188 PJ to 196 PJ in the Reference Case, and 198 PJ in the HCP Case. Heating oil decreases from 67 PJ to 43 PJ in the Reference Case, and 41 PJ in the HCP Case.
- In the HCP Case, residential natural gas demand in 2040 is 6% lower than in the Reference Case as consumers invest in more efficient natural gas furnaces and water heaters and other energy saving measures. Higher carbon pricing also makes lower emission fuels more attractive, resulting in similar electricity and biomass consumption in the HCP Case. Biomass is used most frequently in Quebec and Atlantic Canada, where wood and wood pellet consumption makes up over 20% of residential energy use.
- The commercial sector is a broad category that includes offices, stores, warehouses, government and institutional buildings, utilities, communications, and other service industries. It also includes energy consumed by street lighting and pipelines. The commercial sector made up 12% of total end-use demand in 2015.
- In the Reference Case, commercial demand increases by 0.8% per year over the projection period, slower than the 1.4% growth over the past 25 years. In the HCP Case, demand grows by 0.5% per year and is 6%, or 93 PJ, lower than in the Reference Case by 2040.
- Energy use per square foot for buildings in the commercial sector has decreased by 15% from 1990, despite increased energy use by equipment such as computers in buildings. Continued efficiency improvements, and fewer additions of new equipment, contribute to the slower demand growth in the projection period.
Industrial
- The industrial sector includes manufacturing, forestry, fisheries, agriculture, construction, mining, and oil and natural gas extraction. The industrial sector made up slightly more than half the end-use demand in 2015.
- The industrial energy demand projections are largely driven by the economic growth projections of various industries. In many cases, industrial growth is linked to demand for goods consumed domestically but also those exported internationally due to Canada’s trade-oriented economy.
- In the Reference Case, industrial demand grows steadily in the first decade of the projection period largely due to growth in the oil sands. Industrial demand increases from 5 739 PJ in 2016 to 6 495 PJ in 2026, a 13% increase. After 2023, industrial demand stays relatively constant, a result of steady efficiency improvements and slowing output growth in industries such as paper and metal manufacturing.
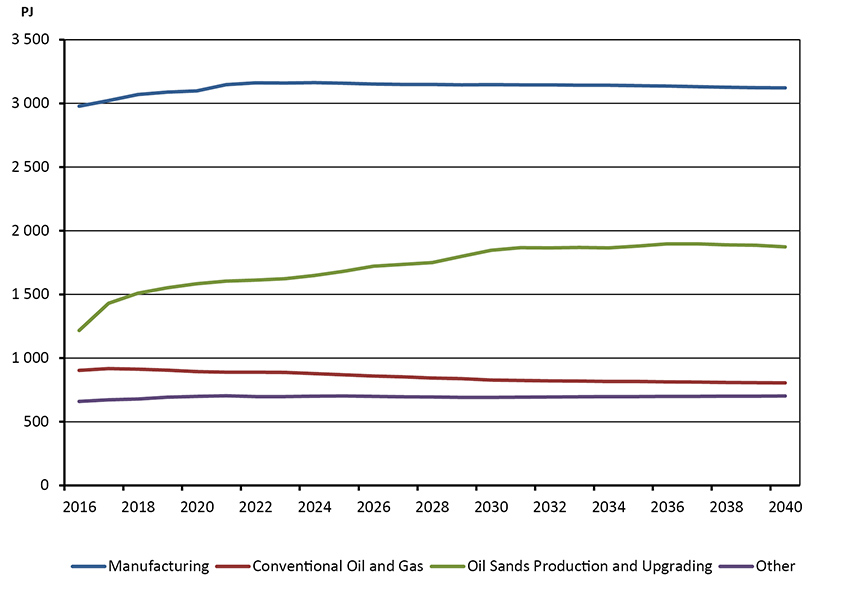
- Figure 3.3 shows energy use trends by various industrial sectors in the Reference Case. The oil sands sector grows over the projection period, driven largely by increasing in situ bitumen production. Natural gas is the primary fuel for in situ production, and demand in that sector increases from 610 PJ in 2016 to 1 025 PJ in 2040, a 68% increase. While total demand increases, the energy intensity of in situ production continues to decline throughout the projection period.
Figure 3.3 - Industrial Energy Demand by Category, Reference Case
Description
This graph shows the changes in industrial energy demand by the manufacturing, conventional oil and gas, oil sands production, and other categories, from 2016 to 2040. Annual manufacturing energy demand is projected to increase from 2 978 PJ in 2016 and peak at 3 163 PJ in 2024. After that it steadily decreases to 3 121 PJ in 2040. Conventional oil and gas energy demand is projected to decrease from 903 PJ in 2016 to 805 PJ in 2040. Oil sands production and refining demand is projected to increase from 1 216 PJ in 2016 to 1 873 PJ in 2040. Other areas of industrial energy demand are projected to increase from 660 PJ to 703 PJ in 2040.
- Industrial energy demand in the HCP Case is 9%, or 595 PJ, lower than in the Reference Case by 2040. This lower demand is largely due to two factors:
- As in other sectors, higher carbon pricing encourages greater investments in more energy efficient devices and processes than in the Reference Case.
- As described in the Macroeconomic Drivers section of this chapter, the HCP Case assumes that global demand for more carbon-intensive products, including crude oil, is somewhat lower. This translates into slightly lower production from these industries, resulting in less energy use.
Transportation
- The transportation sector includes passenger and freight on-road transportation, as well as air, rail, marine, and non-industrial off-road travel, such as recreational all-terrain vehicles and snowmobiles. The transportation sector made up 23% of total end-use demand in 2015.
- After increasing steadily for the past 25 years, total transportation demand declines slowly over the projection period, averaging a 0.5% decrease per year from 2016 to 2040. On-road passenger transportation, which was 42% of total transportation demand in 2015, falls steadily, while freight transportation increases slightly over the projection period.
Passenger Transportation
- On-road passenger transportation energy use has been relatively constant in Canada; consumption in 2015 was close to 2002 levels. Early in the projection period, consumption begins to decline, falling to 720 PJ in 2040, a third less than in 2016. This is driven by several factors:
- Alongside the U.S., Canada enacted GHG emission standards that extend from 2012 to 2025. The standards target GHG emissions per kilometer (km) driven. The average emissions of new passenger vehicles bought in Canada fell from 158 grams CO2e per km in 2011 to 142 grams for those sold in 2015. This decrease is, in part, due to fuel economy improvements resulting from greater use of technologies such turbochargers, cylinder deactivation, and continuous variable transmissions.
- The Reference Case assumes modest adoption of EVs over the projection period. The displacement of some traditional passenger automobiles with EVs contributes to lower energy consumption. The Technology Case, discussed in Chapter 4, provides an analysis of greater EV adoption.
- Canada’s population grows more slowly in the projection period than in the past, resulting in less transportation demand growth. Canada’s population grew by 1.0% per year from 1990 to 2015, compared to 0.8% from 2016 to 2040 in the Reference Case.
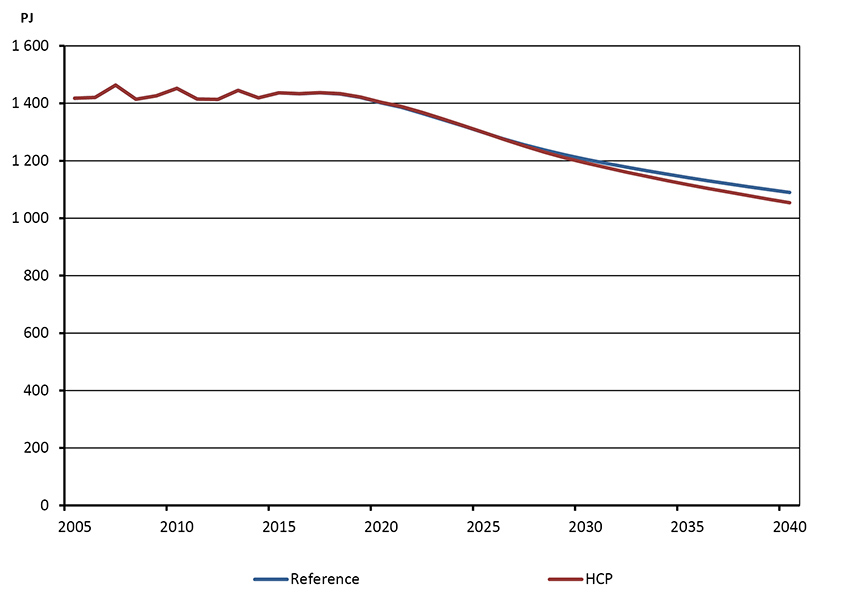
- Total Canadian gasoline demand in all sectors falls to 1 090 PJ in 2040 In the Reference Case, 26% lower than when gasoline consumption peaked in 2007. Figure 3.4 shows gasoline consumption in the Reference and HCP cases.
Figure 3.4 - Gasoline Demand, Reference and HCP Cases
Description
This graph shows annual gasoline demand in both the Reference and HCP cases from 2005 to 2040. Demand was 1 418 PJ in 2005, growing to 1 437 PJ in 2015. After that both cases show a decrease through the end of the projection period. In the Reference Case demand falls to 1 090 PJ and 1 054 PJ in the HCP Case by 2040.
- In the HCP Case, gasoline demand declines more quickly, and is 3% lower than in the Reference Case by 2040. Higher carbon pricing translates to higher gasoline prices, encouraging purchases of more fuel efficient vehicles and less driving in general.
Freight Transportation
- Freight transportation energy use, which includes demand from medium and heavy trucks, air, railways and marine vessels, made up 44% of total transportation demand in 2015. Freight demand is linked to growth in goods-producing industries and increased steadily at an annual average rate of 2.4% from 1990 to 2015, nearly doubling over that period.
- Compared to the past 25 years, freight energy use grows much slower, averaging 0.7% per year from 2016 to 2040. Similar to passenger transportation, policies like the GHG emission standards for medium and heavy duty vehicles result in slower energy demand growth than in previous years. Economic growth, a key driver of freight activity, is also somewhat slower than in the past. In particular, freight energy demand growth in Alberta and Saskatchewan slows following several years of rapid growth. This is similar to the experience in Ontario and Quebec, where growth slowed following rapid growth in the 1990s and early 2000s. Total freight energy use peaks in 2022 at 1 210 PJ.
- In the HCP Case, freight energy use is 5% lower than in the Reference Case by 2040.
Electric Vehicles (EVs)
- Gasoline and diesel are the primary fuels in the transportation sector. However, some market observers suggest that a transformation of the transportation sector may be underway, with EVs poised to quickly replace traditional passenger vehicles. It is always difficult to predict whether the momentum behind a new phenomenon, such as the recent surge of interest in EVs, will translate into a transformational change.
- The Reference and HCP cases take a conservative approach to new technology and assume modest adoption of EVs. However, incentives for purchases in some provinces, as well as an EV mandate in Quebec, contribute to a steadily increasing market share for EVs in both cases.
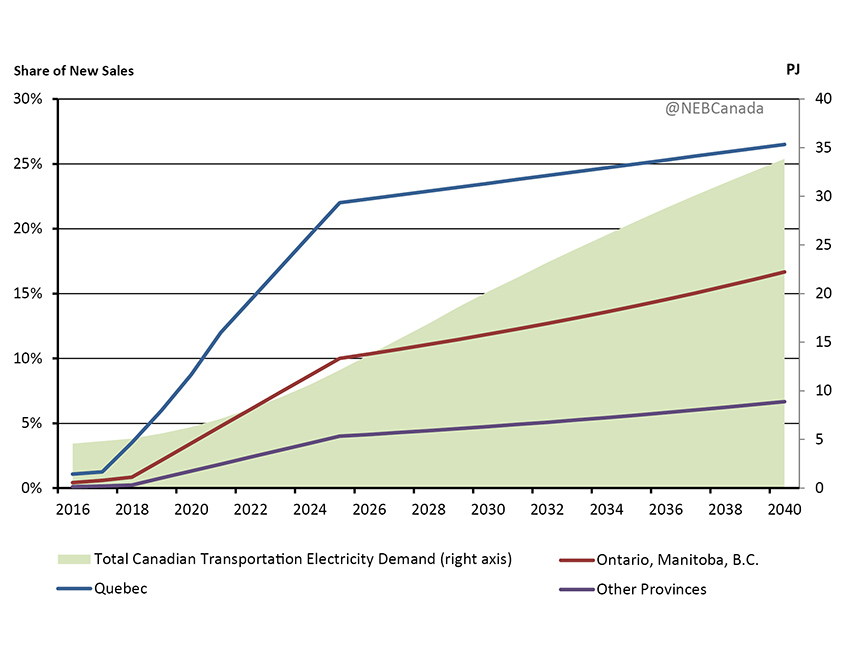
- Figure 3.5 shows the proportion of new passenger vehicle purchases that are EVs as well as total electricity demand in the transportation sector. The Reference Case assumes EV sales are highest in Quebec due to its EV mandate policy, purchase incentives, and low electricity prices. Ontario, B.C. and Manitoba also have higher EV sales due to their low-emitting electricity grids and vehicle purchase incentives. Sales increase steadily from 2016 to 2025 as a result of various programs to support EV purchases. After 2025, the share of new sales increases more gradually as those programs are phased out. In 2040, total Canadian electricity demand from EVs is 34 PJ, less than 1.5% of total electricity consumption in Canada.
Figure 3.5 - EV Share of New Passenger Vehicle Purchases and Transportation Electricity Demand, Reference Case
Description
This graph shows the EV share of new vehicle purchases and the total transportation electricity demanded in the Reference Case from 2016 to 2040. Projected EV share is presented for Quebec, Ontario, Manitoba, B.C., and Other Provinces. EV share of sales in Quebec rapidly increases from 1.08% in 2016 to 22% in 2025 then levels off and slowly increases to 26.5% in 2040. EV share of sales in Ontario, Manitoba, B.C. rapidly increases from 0.42% in 2016 to 10% in 2025 then levels off and increases to 16.67% in 2040. EV share of sales in the other provinces increases from 0.11% in 2016 to 4% in 2025 then levels off and slowly increases to 6.67% in 2040. Total Canadian transportation electricity demanded increases from 4.57 PJ per year in 2016 to 33.85 PJ in 2040.
Primary Demand
- In this analysis, primary demand is the total amount of energy used in Canada. In addition to end-use demand, it includes the energy required to generate electricity.
- Primary demand is calculated by adding the energy used to generate electricity to total end-use
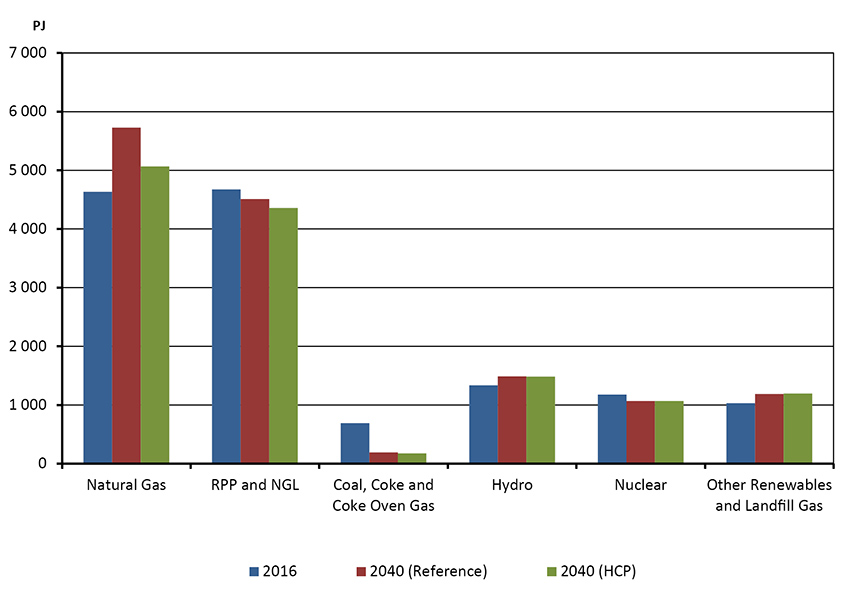
(or secondary) demand, and then subtracting the end-use demand for electricity. - In the Reference Case, primary energy demand increases at an average annual rate of 0.2% over the projection period, reaching 14 170 PJ in 2040—an increase of 854 PJ. Primary demand grows slowly until 2036, at which point it begins to decline. As shown in Figure 3.6, the share of natural gas increases the most, driven by power generation and the oil sands. Coal’s share of primary demand falls considerably due to declining coal-fired power generation.
Figure 3.6 - Primary Energy Demand, Reference and HCP Cases
Description
This chart shows primary energy demand of several different energy sources in 2016 compared to the 2040 Reference and HCP cases. Natural gas demand is 4 634 PJ in 2016, which increases to 5 728 PJ in the Reference Case, and to 5 066 PJ in the HCP Case by 2040. RPP and NGL demand is 4 675 PJ in 2016, which increases to 4 510 PJ in the Reference Case, and decreases to 4 358 PJ in the HCP Case by 2040. Coal, coke and coke oven gas demand is 690 PJ in 2016, which decreases to 191 PJ in the Reference Case, and decreases to 175 PJ in the HCP Case by 2040. Hydro demand is 1 336 PJ in 2016, which increases to 1 486 PJ in the Reference Case, and increases to 1 482 PJ in the HCP Case by 2040. Nuclear demand is 11 77 PJ in 2016, which decreases to 1 066 PJ in the Reference Case, and decreases to 1 066 PJ in the HCP Case by 2040. Other renewables and landfill gas demand is 1 031 PJ in 2016, which increases to 1 188 PJ in the Reference Case, and increases to 1 193 PJ in the HCP Case, by 2040.
- Primary energy demand peaks earlier in the HCP Case, reaching 14 049 PJ in 2019 before declining throughout the remainder of the projection period. Demand for most fuels is lower relative to the Reference Case. Natural gas demand in 2040 is 12% lower compared to the Reference Case while consumption of RPPs and natural gas liquids (NGLs) is 3% lower.
- Energy intensity, measured as energy use per unit of economic activity, declines steadily in both the Reference and HCP cases. Energy intensity declines at an average 1.5% per year in the Reference Case and 1.8% in the HCP Case. Energy use per dollar of gross domestic product falls from 7.5 megajoules (MJ) per dollar in 2016 to 5.2 MJ/$ in 2040 in the Reference Case and 4.9 MJ/$ in the HCP Case.
Key Uncertainties
- EF2017 assumes modest growth of emerging technologies. However, technology’s influence on the energy system can be substantial and often difficult to predict. Chapter 4 explores this uncertainty by analyzing the impact of greater uptake of a selection of emerging technologies on the energy system.
- The HCP Case examines the impact of higher carbon prices in the long term. The energy use impact in this case is based on the energy demand forecasting model and assumptions employed for this analysis. Other energy models or assumptions could produce different impacts of carbon pricing.
- The HCP Case examines one element of future climate policy uncertainty: carbon pricing. Policies, programs, and regulations are continually under development at federal, provincial, territorial, and municipal levels. These may have significant implications for energy demand trends. The suite of climate policies that will be in place in the long term is unknown.
Crude Oil
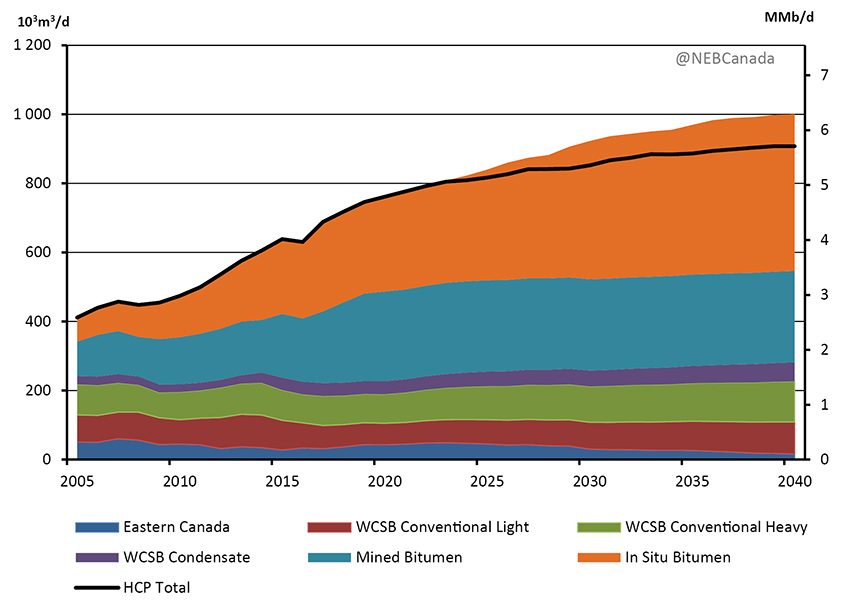
- By 2040 Canadian crude oil production in the Reference Case is 1 000 thousand cubic metres per day (103m3/d) or 6.3 million barrels per day (MMb/d). This is 59% higher than 2016 levels of 631 103m3/d (4.0 MMb/d). Figure 3.7 shows crude oil production by type in the Reference Case and total production in the HCP Case.
Figure 3.7 - Total Canadian Crude Oil and Equivalent Production, Reference and HCP Cases
Description
This graph breaks down the growth in Canadian crude oil and equivalent production in the Reference and HCP cases from 2005 to 2040. Eastern Canadian production changes from 51 MMb/d in 2005 to 16 MMb/d in 2040 in the Reference Case. WCSB conventional light production changes from 79 MMb/d in 2005 to 93 MMb/d in 2040 in the Reference Case. WCSB conventional heavy production changes from 89 MMb/d in 2005 to 118 MMb/d in 2040 in the Reference Case. WCSB condensate production changes from 24 MMb/d in 2005 to 55 MMb/d in 2040 in the Reference Case. Mined bitumen production changes from 100 MMb/d in 2005 to 265 MMb/d in 2040 in the Reference Case. In situ bitumen production changes from 70 MMb/d in 2005 to 453 MMb/d in 2040 in the Reference Case. Total production in the Reference Case changes from 412 MMb/d in 2005 to 1000 MMb/d in 2040. In the HCP Case total production changes from 412 MMb/d in 2005 to 908 MMb/d in 2040.
- Total oil production in the HCP Case reaches 908 103m3/d (5.7 MMb/d) by 2040, 9% lower than in the Reference Case.
Oil Sands
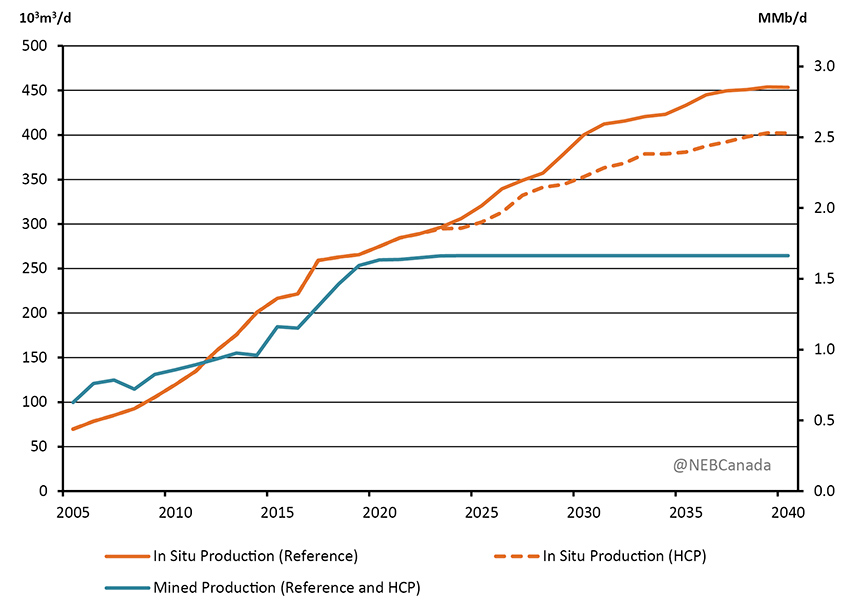
- Oil sands production in 2016 was 405 103m3/d (2.5 MMb/d). At nearly two-thirds of total Canadian oil production in 2016, oil sands make up most of the production growth over the projection period. As shown in Figure 3.8, oil sands production in the Reference Case increases by 77% from 2016 to 2040, reaching 718 103m3/d (4.5 MMb/d). The Reference and HCP Cases assume no major use of solvent-based technologies, which involves injecting propane or butane into in situ reservoirs to improve bitumen recovery and reduce energy use. The impact of greater use of this technology is explored in the Technology Case, discussed in Chapter 4.
Figure 3.8 - Oil Sands Production, Reference and HCP Cases
Description
This graph shows the forecasted changes in oil sands production in the Reference and HCP cases from 2005 to 2040. In situ production increases from 70 103m3/d in 2005 to 453 103m3/d in 2040 in the Reference case, while it increases to 402 103m3/d in the HCP Case. Mined production in both the Reference and HCP cases increases from 100 103m3/d in 2005 to 265 103m3/d by 2024 then levels off and remains constant until the end of the forecast in 2040.
- In the Reference and HCP cases, production of mined and in situ bitumen grows steadily early in the projection period. This growth is from recently completed oil sands projects that are ramping up production and those currently under construction. From 2018 to 2021, annual oil sands production growth averages 19 103m3/d (122 Mb/d) per year, slightly slower than growth in the past decade but quicker than the 2022 to 2040 period in both the Reference and HCP cases.
- After mining projects currently under construction are completed and their production is brought up to capacity, no additional mining capacity is added over the projection period. In both cases, crude oil prices do not reach high enough levels to encourage new investment. After 2024, mined bitumen production in the Reference and HCP cases stay constant at 265 103m3/d (1.7 MMb/d).
- In the Reference Case, in situ bitumen production more than doubles from 2016 to 2040, reaching 453 103m3/d (2.9 MMb/d) in 2040, up from 222 103m3/d (1.4 MMb/d) in 2016. The crude oil price assumptions in the Reference Case encourage sufficient investment to grow production, particularly by experienced producers with high quality deposits.
- In the HCP Case, in situ production continues to grow but more slowly than in the Reference Case. This is driven by:
- The assumption of lower global crude oil prices in the HCP Case.
- Higher carbon prices than in the Reference Case.
- The crude oil prices in the two cases slowly diverge starting in 2023 and by 2040 the Brent crude oil price is US$5/bbl lower in the HCP Case. This lower price reduces the incentive to invest in more costly projects and is a driver of lower in situ production in the HCP Case.
- In both cases, the carbon pricing scheme for industrial emissions described in the Alberta Climate Leadership Panel’s report is applied to the oil sands sector. A key element of this scheme is sector-specific output-based allocations that aim to mitigate the competitiveness and employment impacts of applying carbon pricing to trade-exposed industries.
- For oil sands producers the structure of the industrial carbon pricing scheme means that, in a given year, each producer receives the same allocation of free emission permits per barrel of output. However, each producer’s net per barrel carbon costs will vary based on how GHG-intensive they are compared to other producers.
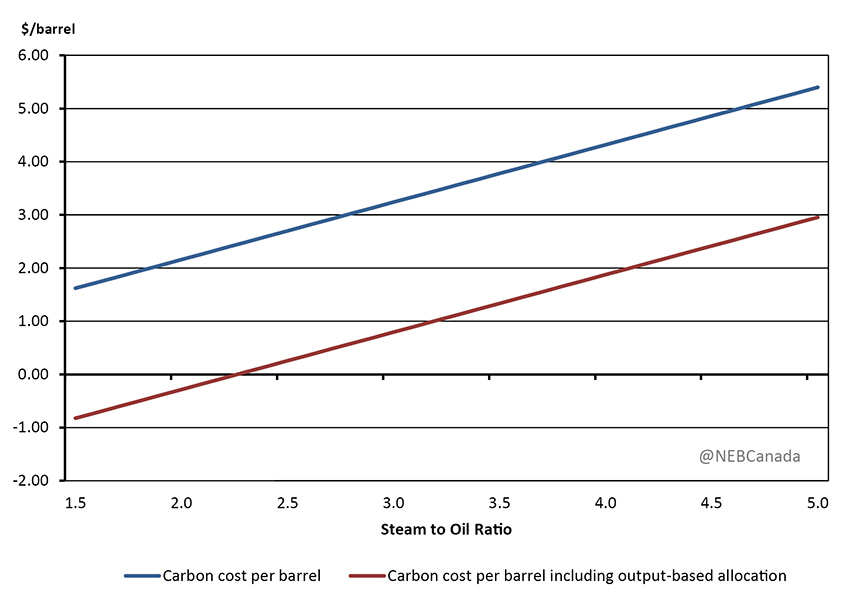
- A common metric of the energy intensity of in situ oil sands projects is their steam to oil ratio (SOR). Figure 3.9 shows the estimated per barrel carbon cost of in situ oil sands projects with different SORs. The figure shows the carbon costs associated with natural gas consumption for oil sands projects in the year 2022, when the carbon price is $50/tonne in both Reference and HCP cases. Most in situ oil sands projects have SORs ranging from 2 to 3 barrels of steam per barrel of oil produced.
Figure 3.9 - Estimated per Barrel In Situ Oil Sands Carbon Costs at $50/tonne in 2022
Description
This graph compares the estimated per barrel in situ oil sands carbon costs at $50/tonne in 2022 between a standard carbon cost per barrel and carbon cost per barrel including output-based allocation. At an SOR of 1.5 the carbon cost per barrel is 1.62 $/barrel and slopes steadily upwards to 5.4 $/barrel with an SOR of 5. At an SOR of 1.5 the carbon cost per barrel including output-based allocation is -0.82 $/barrel and slopes steadily upwards to 2.96 $/barrel with an SOR of 5.
- As shown in Figure 3.9, the per barrel cost increases as the SORs of in situ projects increase. It also shows the impact of the output-based allocations, which reduce the average per barrel carbon cost for all producers by roughly $2.40 per barrel. Producers performing better than the 25th percentile receive allocations in excess of their carbon costs, resulting in a net credit for producers with SORs lower than 2.3.
- In the HCP Case, the carbon price, and hence the carbon cost per barrel, continues to increase over the projection period. The HCP Case assumes greater global climate action. Accordingly, mechanisms addressing competitiveness concerns, like output-based allocations, are less necessary. The size of the output-based allocations is gradually reduced over the projection period in the HCP Case.
- Together, higher carbon costs and lower crude oil prices in the HCP Case cause in situ production to grow slower, reaching 402 103m3/d (2.5 MMb/d) in 2040, or 11% lower than in the Reference Case. Some more costly and emission-intensive projects that are included in the Reference Case are excluded from the HCP Case.
Western Canadian Conventional Crude Oil
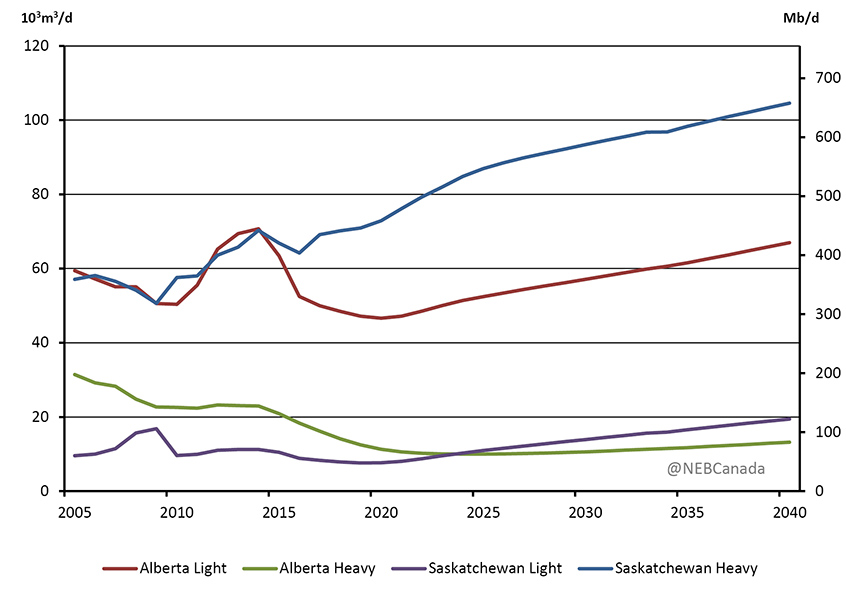
- Total conventional crude oil production from western Canada accounted for nearly 30% of total Canadian production in 2016 at 192 103m3/d (1.2 MMb/d). Conventional production is classified as light or heavy depending on the API gravity of the oil. In 2016, 43% of western Canadian conventional production was heavy and 57% was light (including condensate production). Over 90% of conventional production came from Alberta and Saskatchewan in 2016, with smaller amounts from Manitoba, B.C., and Northwest Territories (NWT). Figure 3.10 shows total conventional production over the projection period in Saskatchewan and Alberta.
Figure 3.10 - Conventional Oil Production by Type, Saskatchewan and Alberta, Reference Case
Description
This graph shows conventional oil production by type in Alberta and Saskatchewan based on the Reference case from 2005 to 2040. In 2005 Alberta light oil production was 59 103m3/d, which peaked in 2014 at 71 103m3/d. After 2014, Alberta light oil production declines to a low of 47 103m3/d in 2020, before steadily increasing to 67 103m3/d in 2040. In 2005 Alberta heavy oil production was 31 103m3/d. This is followed by a decline to 20 103m3/d in 2029 before an increase to 13 103m3/d by 2040. In 2005 Saskatchewan light production was 10 103m3/d and peaked in 2009 at 17 103m3/d. After 2009 Saskatchewan light oil production declines to a low of 8 103m3/d in 2019, after which production increases to 19 103m3/d by 2040. Saskatchewan heavy production was 57 103m3/d in 2005. This is followed by a generally steady increase until it reaches 105 103m3/d in 2040.
- In Saskatchewan, heavy oil production increases by over 60% from 2016 levels, increasing from
64 103m3/d (404 Mb/d) to 105 103m3/d (658 Mb/d) in 2040 in the Reference Case. Heavy oil production in Alberta declines early in the projection period and then grows moderately to 2040. - Heavy oil production growth in Saskatchewan is a result of the application of steam assisted gravity drainage recovery (SAGD) methods — a technology often deployed in the oil sands — to heavy oil fields. By early 2017, 15 thermal heavy oil projects were operating in Saskatchewan, a nearly 3-fold increase from 2012. Similar to the oil sands, production from these thermal projects does not exhibit the steep decline rates typical of traditional heavy oil wells. This contributes to the attractiveness of this type of production, leading to steady growth over the projection period.
- Production of light conventional oil declines in the first 4 years of the projection period in the Reference Case as oil prices are insufficient to encourage enough new drilling to offset declines from existing wells. After 2020, production begins to increase as higher prices encourage greater investment. By 2040, light conventional oil production, which includes tight oil, is 28% higher than in 2016, reaching 93 103m3/d (584 Mb/d).
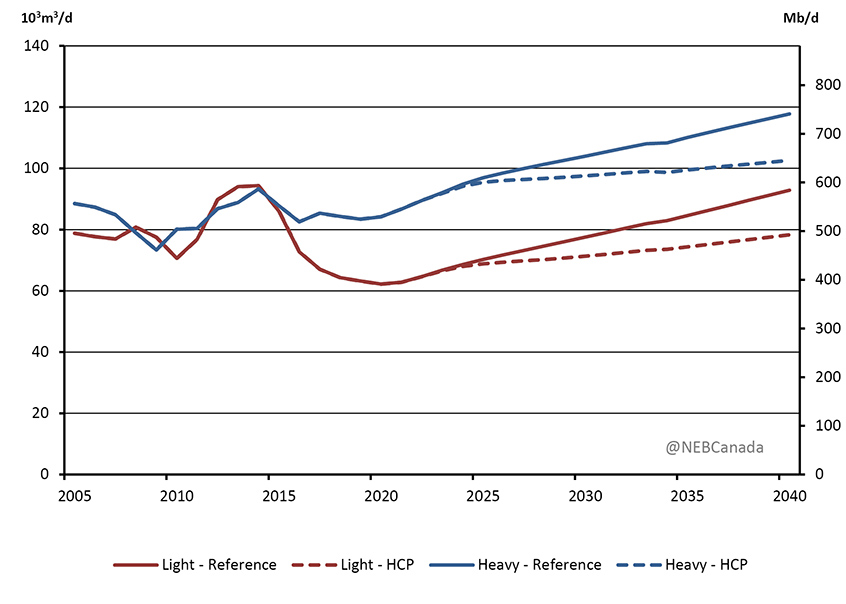
- In the HCP Case, higher carbon costs and lower crude oil prices result in conventional production growing slower, as shown in Figure 3.11. Total conventional production in western Canada reaches 181 103m3/d (1.1 MMb/d) in 2040, or 13% lower than in the Reference Case.
Figure 3.11 - Western Canada Conventional Oil Production by Type, Reference and HCP Cases
Description
This graph shows both Reference and HCP Case projections for western Canadian light and heavy oil production. In the Reference Case, light oil production increases from 73 103m3/d in 2016 to 93 103m3/d by 2040, while heavy oil production increases from 83 103m3/d in 2016, to 118 103m3/d by 2040. In the HCP Case, light oil production increases from 73 103m3/d in 2016 to 78 103m3/d by 2040, while heavy oil production increases from 83 103m3/d in 2016, to 103 103m3/d by 2040.
Newfoundland Offshore
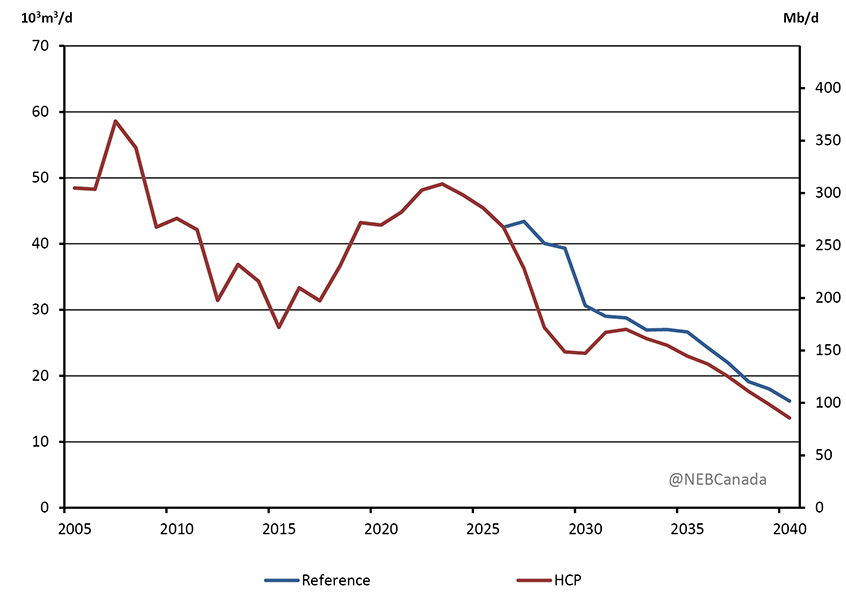
- In the Reference Case, Newfoundland and Labrador offshore oil production increases steadily over the next five years as the Hebron project begins production and additional wells are brought online at existing facilities. After peaking at 49 103m3/d (309 Mb/d) by 2023, production begins to decline as shown in Figure 3.12. The Reference Case assumes two generic offshore discoveries add new production starting in 2027 and 2033. As a result of lower oil price assumptions, the HCP Case assumes only one new discovery, which adds production starting in 2030.
Figure 3.12 - Newfoundland Oil Production, Reference and HCP Cases
Description
This graph shows both Reference and HCP Case projections for Newfoundland oil production. In the Reference Case, oil production decreases from 33 103m3/d in 2016 to 16 103m3/d by 2040, while in the HCP Case, oil production decreases from 33 103m3/d, to 14 103m3/d by 2040.
Key Uncertainties
- Future oil prices are a key driver of future Canadian oil production and a key uncertainty to the projections in EF2017. Crude oil prices could be higher or lower depending on demand trends, technological developments, geopolitical events, and the pace at which nations enact policies to reduce GHG emissions. The previous edition of Energy Futures, Canada’s Energy Future 2016: Update, provides additional sensitivity cases that explore the impact of higher or lower oil prices.
- The HCP Case assumes that global crude oil prices are lower compared to the Reference Case. This price impact is uncertain and depends on the robustness of concerted global climate action, the responsiveness of oil demand to higher carbon costs, and the availability of alternatives to existing technologies.
- The pace of technological developments in the oil sands is a key uncertainty. EF2017 assumes gradual technological improvement in the sector and more or less rapid technology development could impact the oil sands production projections. Potential advances that could change the supply projections include solvent-based processes, electrification, and CCS technology.
- The application of SAGD recovery techniques to Saskatchewan’s heavy oil resources is a recent trend and future production growth is uncertain.
- This analysis assumes that over the long term, all energy production will find markets and infrastructure will be built as needed. However, projects to increase oil transportation capacity in North America have proven controversial. Whether sufficient pipeline infrastructure is in place will impact pricing of Canadian crude oil and the economics of production. Chapter 10 of Canada’s Energy Future 2016 provides additional analysis on this key uncertainty to the Canadian energy outlook.
Natural Gas
- Natural gas production in the Reference Case declines early in the projection period, reaching a low of 414 million cubic metres per day (106m3/d) or 14.6 billion cubic feet per day (Bcf/d) in 2023. After 2023, production begins to increase as gradually higher prices encourage enough drilling to offset production declines from older wells. By 2040, production increases to 477 106m3/d (16.8 Bcf/d), its highest level since 2007. Figure 3.13 shows natural gas production in Alberta, B.C., and the rest of Canada in the Reference and HCP cases.
Figure 3.13 - Natural Gas Production, Reference and HCP Cases
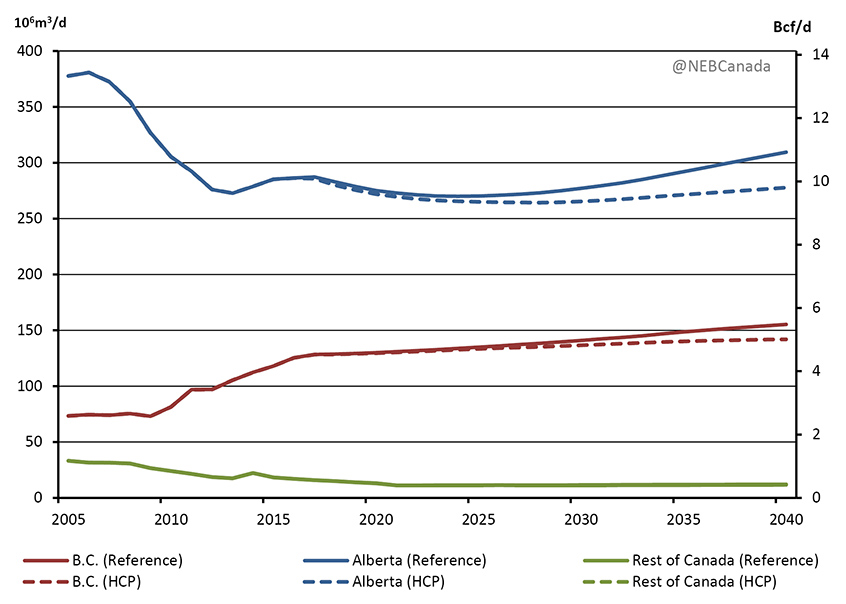
Description
This graph shows both Reference and HCP Case projections for Canadian natural gas production. In the Reference Case, B.C.'s production increases from 125.3 106m3/d in 2016 to 155.2 106m3/d by 2040, Alberta's production increases from 286.2 106m3/d in 2016 to 309.4 106m3/d by 2040, while production in the rest of Canada decreases from 17 106m3/d in 2016 to 12.2 106m3/d by 2040. In the HCP Case, B.C.'s production increases from 125.3 106m3/d in 2016 to 141.8 106m3/d by 2040, Alberta's production decreases from 286.2 106m3/d in 2016 to 277.6 106m3/d by 2040, while production in the rest of Canada decreases from 17 106m3/d in 2016 to 11.6 106m3/d by 2040.
- Figure 3.14 shows tight and shale gas production by play in the Reference Case. Production from the Montney formation, a large resource located in northeast B.C. that extends into northwest Alberta, has grown significantly over the past five years. Production of tight gas from the Montney increased from no production prior to 2006 to almost 128 106m3/d (4.5 Bcf/d) in 2016, or 30% of total Canadian natural gas production in 2016. The majority of production growth over the projection period comes from the Montney, with production reaching 223 106m3/d (7.9 Bcf/d) in 2040, a 74% increase from 2016. In the HCP Case, production from the Montney grows at a slightly slower pace and is 8% lower than the Reference Case by 2040.
Figure 3.14 - Tight and Shale Natural Gas Production by Play, Reference Case
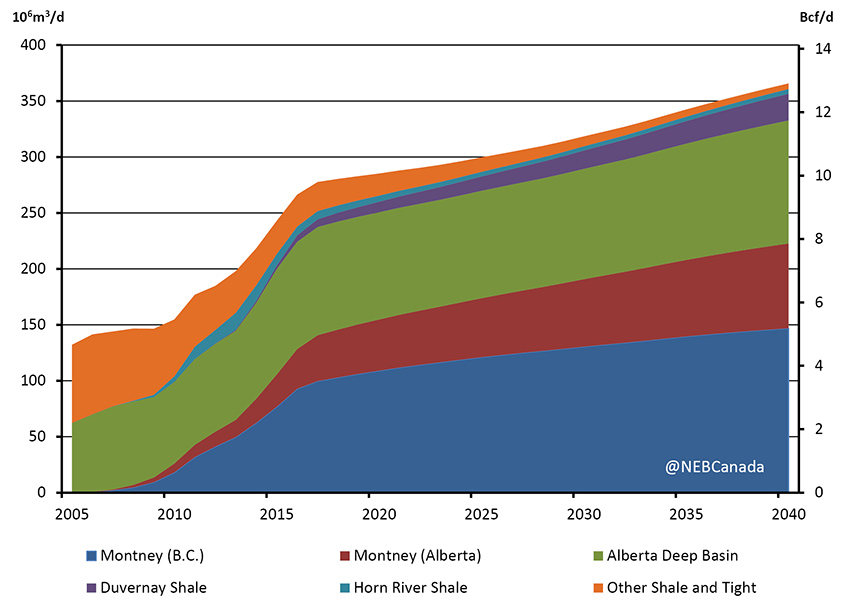
Description
This graph breaks down the Reference Case projection for Canadian tight and shale natural gas production by their play. B.C.'s portion of the Montney play is projected to increase production from 92.84 106m3/d in 2016, to 146.89 106m3/d by 2040, while Alberta's portion is projected to increase from 35.47 106m3/d in 2016 to 75.79 106m3/d by 2040. Alberta's Deep Basin is projected to increase from 95.95 106m3/d in 2016 to 109.95 106m3/d by 2040. Duvernay Shale is projected to increase from 5.69 106m3/d in 2016 to 23.84 106m3/d by 2040. Horn River Shale is projected to decreases from 7.91 106m3/d in 2016 to 4.26 106m3/d by 2040. Other Shale and Tight gas is projected to decreases from 28.47 106m3/d in 2016 to 4.99 106m3/d by 2040.
- The Alberta Deep Basin – a liquids rich tight gas play which runs along the Alberta foothills – produced 96 106m3/d (3.4 Bcf/d) in 2016. Production grows modestly as natural gas and natural gas liquids prices increase, reaching 110 106m3/d (3.8 Bcf/d) by 2040 in the Reference Case and 105 106m3/d (3.7 Bcf/d) in the HCP Case.
- The Duvernay and Horn River shale gas plays currently produce small amounts of natural gas and production from both grows modestly over the projection period. The Duvernay is an emerging shale play in Alberta that contains natural gas, natural gas liquids and crude oil. The Horn River play lacks natural gas liquids, reducing its attractiveness compared to other areas. Combined, production from the two plays increases from 14 106m3/d (0.5 Bcf/d) in 2016 to 28 106m3/d (1.0 Bcf/d) in the Reference Case by 2040.
- Production from conventional and coalbed methane natural gas resources – which do not rely on horizontal drilling and multi-stage hydraulic fracturing techniques – declines steadily over the projection period as new drilling targeting these resources is not economic given the natural gas price assumptions in EF2017. Western Canadian conventional non-tight production, which made up 65% of total production in 2006 and 37% in 2016, falls to 23% in 2040.
- Natural gas production in eastern Canada continues to decline over the projection period. Onshore natural gas production in New Brunswick falls to near zero in both the Reference and HCP Case by 2040. Offshore natural gas production in Nova Scotia declines steadily over the projection period. Production ceases in 2021 when the costs of offshore operations exceed the revenue generated by the natural gas produced.
-
Previous Energy Futures Reference Case projections have assumed some volumes of LNG exports within the projection period. The global LNG market is becoming increasingly competitive as more facilities are built around the world. Some LNG projects are still being considered by developers on Canada’s east and west coasts. However, given recent low global LNG prices and the relatively higher cost of commissioning a new LNG facility along with pipelines needed to supply gas to it, EF2017 makes an assumption that no LNG exports from Canada will take place over the projection period.
Key Uncertainties
- Future natural gas prices are a key uncertainty in the projections. The previous edition of Energy Futures, Canada’s Energy Future 2016: Update, provides additional sensitivity cases that explore the impact of higher or lower natural gas prices.
- This analysis assumes that over the long term, all energy production will find markets and infrastructure will be built as needed. However, lack of markets for Canadian natural gas production could reduce the prices Canadian producers receive relative to the Henry Hub price and impact gas production trends.
- The timing and volume of LNG exports from Canada is uncertain. Canadian LNG exports have several advantages over competitors such as its proximity to Asian markets, the low cost of natural gas feedstocks, and the benefits of cooler Canadian weather. It is possible that market conditions and the costs of commissioning a new LNG export facility may change in the future, influencing the future prospects of LNG in Canada. Uncertainty related to LNG exports is explored further in two sensitivity cases in Chapter 11 of Canada’s Energy Future 2016.
- The HCP Case assumes the same natural gas prices as in the Reference Case. As noted in Chapter 2, this is based on uncertainty related to the impact that stronger global action on climate could have on North American and global natural gas demand, and hence natural gas prices. Stronger carbon action may affect fuel choices, the competitiveness of renewables in the power generation sector, and the pace of technological developments.
Natural Gas Liquids
- Raw natural gas recovered at a wellhead is comprised primarily of methane, but often contains other hydrocarbons and some contaminants. These other hydrocarbons consist of ethane, propane, butanes and pentanes plus, which are collectively referred to as NGLs. The majority of NGLs are recovered from natural gas but some are also produced as a by-product of oil refining or bitumen upgrading.
- Total natural gas liquid production increases steadily throughout the projections, as natural gas producers increasingly target areas rich with NGLs. Combined NGL production increases by 30% over the projection period, from 142 103m3/d (0.9 MMb/d) in 2016 to 185 103m3/d (1.2MMb/d) in 2040. Figure 3.15 shows total NGL production in the Reference Case.
Figure 3.15 - Natural Gas Liquids Production, Reference Case
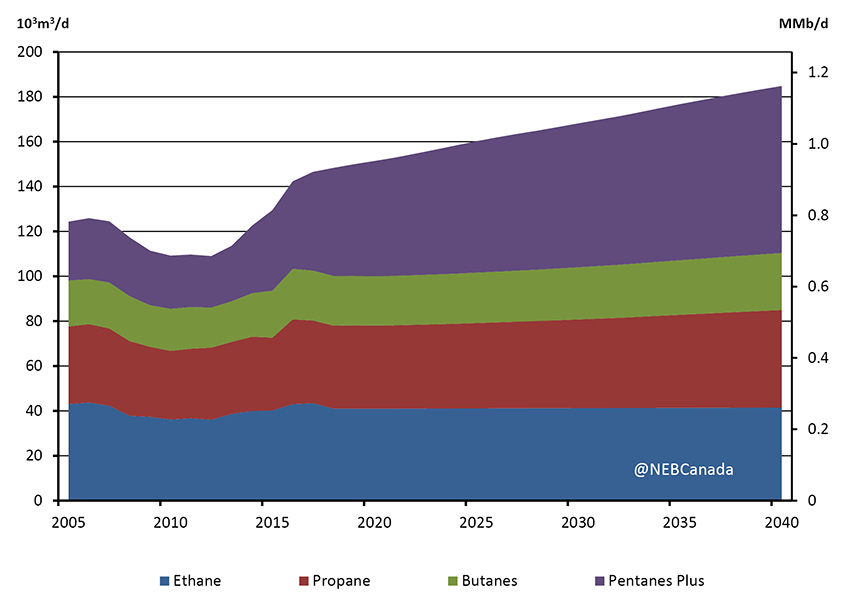
Description
This graph breaks down Canadian natural gas liquids production in the Reference Case projection. Ethane production decreases from 39.9 103m3/d in 2016 to 38.5 103m3/d by 2040. Propane production increases from 37.8 103m3/d in 2016 to 43.5 103m3/d by 2040. Production of butanes increases from 18.5 103m3/d in 2016 to 21.2 103m3/d by 2040. Pentanes Plus production increases from 39.0 103m3/d in 2016, to 69.9 103m3/d by 2040.
- Ethane, the majority of which is extracted at large natural gas processing facilities located on major natural gas pipelines in Alberta and B.C., made up 30% of NGL production in 2016 at 43 103m3/d (270 Mb/d). Ethane production in the Reference Case is relatively stable at 41 103m3/d (261 Mb/d) over the projection period as its production is limited to the capacity of petrochemical facilities in Alberta which use it as a feedstock.
- Propane production in the Reference Case declines until the end of the decade, following overall natural gas production trends. As natural gas production begins to increase, propane production begins to increase steadily, and reaches 43 103m3/d (273 Mb/d) by 2040, 15% higher than 2016 levels of 38 103m3/d (133 Mb/d).
- Butanes production follows a similar pattern to propane production, declining early and then increasing steadily through the remainder of the projection period. Butane production is 13% higher than 2016 levels by 2040, increasing from 23 103m3/d (142 Mb/d) to 25 103m3/d (160 Mb/d).
- Production of pentanes plus, also referred to as condensate, increased over 50% from 2013 to 2016, as producers targeted pentanes plus rich areas, such as the Montney and Duvernay plays. Of the NGLs, pentanes plus increases the most over the projection period, increasing by 91%, from 39 103m3/d (245 Mb/d) in 2016 to 74 103m3/d (468 Mb/d) in 2040. Production growth in the oil sands provides a growing market for pentanes plus, where it is used as diluent.
- In the HCP Case, NGL production is slightly lower due to somewhat lower natural production projections. Total NGL production reaches 172 103m3/d (1.1 MMb/d) in 2040, 7% lower than in the Reference Case.
Key Uncertainties
- NGLs are a by-product of natural gas production, and the uncertainties identified in the Natural Gas section are uncertainties to the NGL projections.
- The rate of oil sands production growth, and proportion of bitumen that is upgraded, will affect the demand for pentanes plus required for diluent. Likewise, greater use of solvent technologies in the oil sands could increase the market for propane and butanes, which could impact those production projections.
Electricity
- In 2015, installed electricity generation capacity in Canada reached 145 gigawatts (GW). Hydroelectricity remains the primary source of electric power, accounting for 55% of total capacity and 58% of generation. Natural gas, coal, nuclear and non-hydro renewables, including wind, solar, and biomass, provide most of the remaining supply.
- The electricity supply mix varies significantly among the provinces and territories, reflecting the types of energy available, economic considerations, and policy choices in each region. Quebec, B.C., Manitoba, Newfoundland and Labrador, and Yukon have significant hydroelectric resources which are used to supply most of their electricity needs. Saskatchewan and Alberta have historically relied on locally abundant coal resources but have recently expanded their natural gas-fired fleet. Nuclear power plants make up approximately one-third of Ontario’s capacity, with natural gas and hydro providing much of the remaining power. The Maritime provinces rely on a combination of hydro, various fossil fuels, nuclear, and non-hydro renewable resources. Diesel-fueled plants account for most of the capacity in Nunavut and NWT.
- In 2015, Canadian electricity demand was 522 terawatt-hours (TW.h) and accounted for 17% of total Canadian end-use energy demand. From 1990 to 2015, Canadian electricity demand increased by an average of 1% per year. In the Reference Case, electricity demand increases at an average annual rate of 0.9% over the projection period.
- Figure 3.16 shows additions and retirements of generating capacity over the projection period. The majority of additions to capacity in the Reference Case are natural gas, wind, and hydro facilities, accounting for 85% of the 54 GW added from 2016 to 2040. The remaining additions include 6.4 GW of solar, 1.1 GW of biomass and 0.4 GW of coal equipped with CCS technology. Coal, nuclear and oil-fired facilities, along with some older natural gas-fired facilities, make up the bulk of retirements.
Figure 3.16 - Capacity Additions and Retirements by 2040, Reference Case
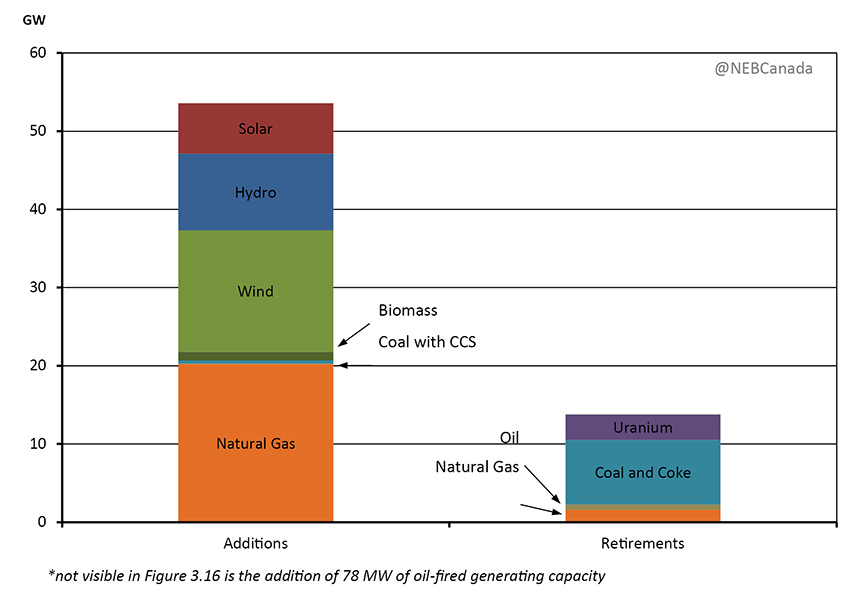
Description
This graph shows the total additions and retirements of electric generation capacity by 2040 for the Reference Case, and breaks it down by fuel source. Additions to natural gas capacity total 20.22 GW by 2040, while retirements total 1.58 GW of capacity. Additions to oil capacity total 0.07 GW by 2040, while retirements total 0.67 GW of capacity. Additions to coal and coke capacity total 0.39 GW by 2040, while retirements total 8.27 GW of capacity. There is no additions to uranium capacity, while 3.24 GW are retired by 2040. Additions to biomass capacity total 1.1 GW by 2040, while there are no retirements by 2040. Additions to wind capacity total 15.53 GW by 2040, while retirements total 0.03 GW of capacity. Additions to hydro capacity total 9.8 GW by 2040, while there are no retirements by 2040. Additions to solar capacity total 6.4 GW by 2040, while there are no retirements by 2040.
- Electricity supply is often discussed in terms of capacity and generation. Capacity is the maximum electric output a facility can produce while generation refers to the amount of power actually produced. These concepts are discussed in detail in the Board’s recent report “Canada’s Renewable Power Landscape”. Table 3.2 shows capacity and generation by fuel in 2016 and 2040 in the Reference Case.
Table 3.2 - Electric Capacity and Generation in 2016 and 2040, Reference Case
| Energy Source | Capacity in GW and % | Generation in TW.h and % | ||
|---|---|---|---|---|
| 2016 | 2040 | 2016 | 2040 | |
| Hydro | 80.4 | 89.2 | 376.7 | 413.0 |
| 54.8% | 48.0% | 58.3% | 56.4% | |
| Wind | 11.9 | 26.6 | 28.4 | 69.4 |
| 8.1% | 14.3% | 4.4% | 9.5% | |
| Solar | 2.3 | 8.6 | 3.6 | 13.0 |
| 1.6% | 4.6% | 0.6% | 1.8% | |
| Biomass | 2.7 | 3.5 | 13.2 | 15.3 |
| 1.8% | 1.9% | 2.0% | 2.1% | |
| Nuclear | 14.3 | 11.1 | 96.3 | 87.0 |
| 9.7% | 6.0% | 14.9% | 11.9% | |
| Coal | 9.7 | 1.8 | 61.9 | 4.1 |
| 6.6% | 1.0% | 9.6% | 0.6% | |
| Natural Gas | 21.5 | 41.7 | 62.9 | 128.0 |
| 14.7% | 22.5% | 9.7% | 17.5% | |
| Oil | 3.8 | 3.3 | 3.3 | 2.0 |
| 2.6% | 1.8% | 0.5% | 0.3% | |
| All Sources | 146.6 | 185.8 | 646.3 | 731.9 |
Outlook by Fuel
Hydro
- Hydroelectricity remains the dominant source of electricity supply in Canada over the projection period. Hydro power has numerous advantages, including flexibility, relative affordability, lack of GHG emissions at the operation stage, and cost-stability. With its capability to store water and to change output as needed, Canada’s hydro capacity also facilitates the development of intermittent renewable resources such as wind and solar.
- Hydro-based capacity, including small hydro and run-of-river facilities, increases from 80 GW in 2016 to 89 GW in 2040. This capacity expansion reflects a number of large hydro projects currently under construction or in the planning and development phases.
- As a result of hydro-based capacity expansions, annual hydroelectricity production increases from 377 TW.h in 2016 to 413 TW.h in 2040 in the Reference Case. Due to faster growth in other forms of generation, such as wind and natural gas, the share of hydroelectricity declines slightly over the projection period from 58% in 2016 to 56% in 2040.
Non-hydro Renewables
- Canada has considerable non-hydro renewable resource potential including wind, biomass, solar, tidal, wave, and geothermal. Over the past 5 years, policy incentives and declining costs have spurred significant growth in the use of some of these technologies. In 2015, Canada had 16 GW of wind, solar, and biomass capacity, nearly triple 2010 levels. Most wind power capacity is in Ontario, Quebec, and Alberta, while the majority of solar capacity is in Ontario.
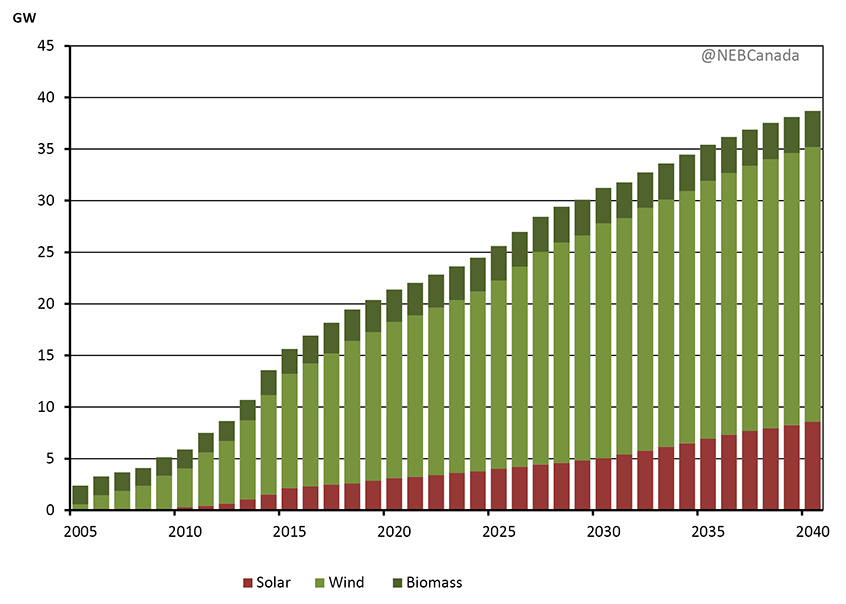
- As shown in Figure 3.17, non-hydro renewable capacity continues to grow in the Reference Case, more than doubling to 39 GW by 2040. Wind capacity increases from 12 GW in 2016 to 27 GW in 2040, with nearly 60% of that increase in Alberta. Solar capacity more than triples, increasing from 2.3 GW in 2016 to 8.6 GW in 2040, with the majority of growth in Ontario, Quebec, and Alberta. Biomass generation capacity grows steadily, from 2.7 GW in 2016 to 3.5 GW by the end of the projection period.
Figure 3.17 - Non-Hydro Renewable Capacity, Reference Case
Description
This stacked column chart breaks down total growth in non-hydro renewable capacity generation in the reference case, by source. Solar capacity increases from 2.3 GW in 2016 to 8.6 GW by 2040. Wind capacity increases from 11.9 GW in 2016 to 26.6 GW by 2040. Biomass capacity increases from 2.7 GW in 2016 to 3.5 GW by 2040.
- Recent cost declines, particularly for solar, play a role in increasing renewable capacity as do various government plans and policies. This includes Alberta’s Renewable Energy Program, which adds 5 GW of renewable capacity by 2030, and Saskatchewan’s goal of increasing its renewable capacity to 50% of total capacity by 2030. Generation from these sources increases from 45 TW.h in 2016 to 98 TW.h in 2040 in the Reference Case, accounting for 13% of all electricity generated.
Nuclear
- Nuclear energy accounted for 15% of total electricity generation in Canada in 2015. Ontario’s three nuclear facilities had a combined capacity of nearly 14 GW in 2015 and generated 58% of the province’s electricity. New Brunswick’s single nuclear facility generated a third of the province’s power in 2015.
- Annual nuclear generation declines from 92 TW.h in 2016 to 82 TW.h in 2040 in the Reference Case due to the shutdown of Ontario’s Pickering Nuclear facility in 2024. Through much of the projection period, nuclear generation is somewhat lower than current levels due to outages of several nuclear units in Ontario that are scheduled for refurbishment. No new nuclear units are built during the projection period.
- Non-emitting generation sources: hydro, renewables and nuclear, contribute 82% of generation by 2040 in the Reference Case. Despite considerable additions of non-hydro renewables, this is only up slightly from 80% in 2016 as natural gas-fired generation is also added over the projection period to meet increasing load growth.
Coal
- Coal-fired generation facilities accounted for 6% of installed capacity in 2015, and generated 9% of all electricity. Currently four provinces operate coal-fired power plants: Alberta, Saskatchewan, New Brunswick and Nova Scotia.
- Federal regulations apply a strict emission performance standard to units that have reached the end of their useful lives, essentially requiring them to be shut down or retrofitted with CCS technology. In 2015, Alberta announced plans to accelerate the phase out of its coal fleet, requiring traditional coal plants to be phased out by 2030. In autumn 2016, the federal government announced its intention to amend its existing coal regulations to phase out traditional coal-fired facilities by 2030 rather than at the end of their economic lives.
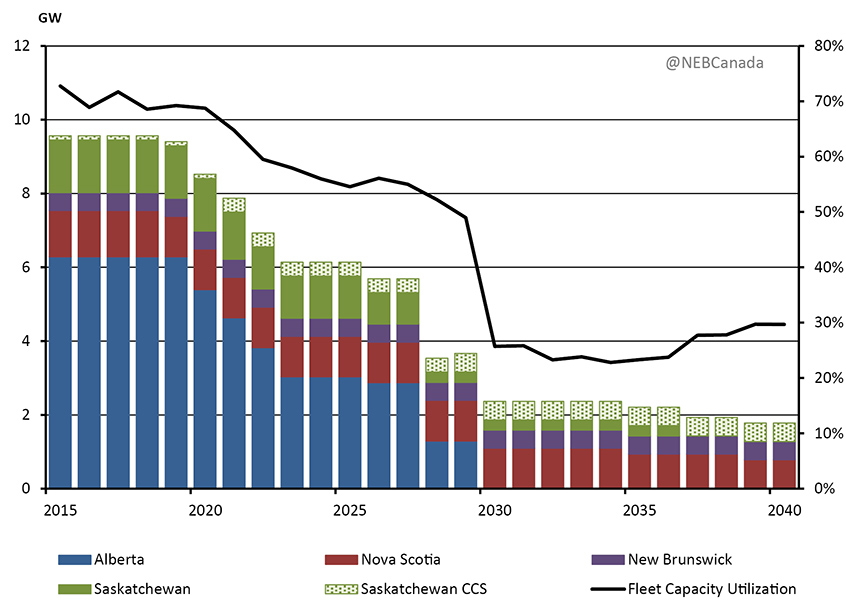
- As a result of these initiatives, coal capacity declines considerably over the projection period. EF2017 assumes equivalency agreements are reached in Saskatchewan, New Brunswick and Nova Scotia, allowing those provinces to keep some traditional coal capacity in place after 2030. That capacity is used sparingly in the 2030 to 2040 timeframe. Figure 3.18 shows coal capacity by province over the projection period, as well as the capacity utilization of the existing plants.
Figure 3.18 - Coal-fired Generating Capacity by Province, Reference Case
Description
This graph breaks down projected coal-fired generation capacity by province in the Reference Case, while also displaying coal capacity utilization rates throughout the projection period. Alberta's coal fired capacity decreases from 6.29 GW in 2015 to zero in 2030, where it remains for the remainder of the projection. Nova Scotia's coal fired capacity decreases from 1.25 GW in 2015 to 0.79 GW by 2040. New Brunswick’s coal fired capacity does not change throughout the projection, producing 0.49 GW from 2015 to 2040. Saskatchewan's coal fired capacity decreases from 1.42 GW in 2015 to zero in 2037, where it remains for the remainder of the projection. Conversely, Saskatchewan's coal generation capacity using carbon capture and storage technology increases from 0.12 GW from 2015 to 0.51 GW by 2040. Overall utilization of coal-fired capacity decreases from 73% in 2015 to 30% in 2040.
- Saskatchewan currently has one coal-fired generation station that is equipped with CCS technology. The Boundary Dam facility was put into operation in autumn 2014 and as of May 2017, it has captured 1.6 MT of CO2. Over the projection period, three additional Saskatchewan coal units are retrofitted with CCS technology, providing 0.4 GW of capacity.
Natural Gas
- Natural gas-fired capacity accounted for 15% of total capacity in 2015, with 22 GW installed. All regions in Canada other than Prince Edward Island and Nunavut use natural gas to generate some electricity, although its share is most significant in Alberta and Saskatchewan.
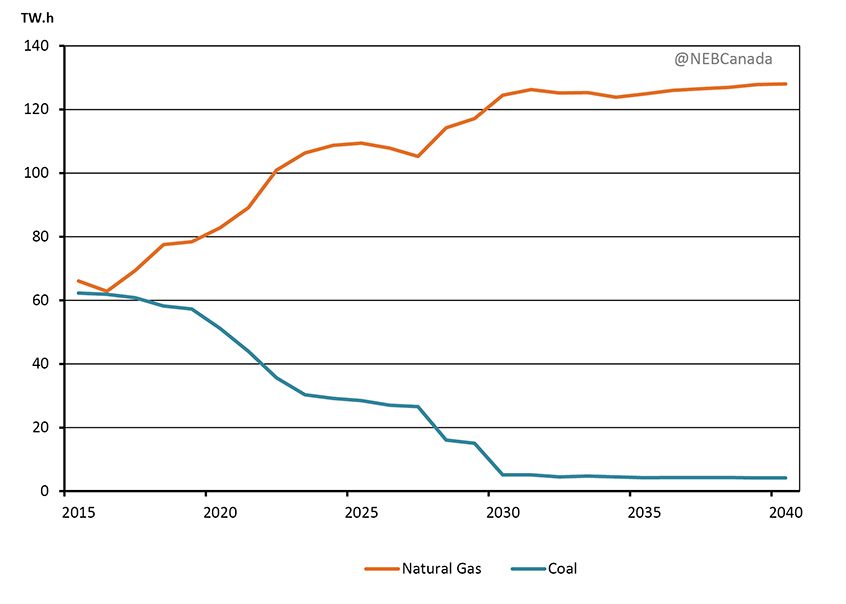
- Natural gas-fired capacity increases steadily over the projection period. As a result of relatively low fuel prices and upfront capital costs, natural-gas fired capacity replaces much of the coal capacity that is retired over the projection period. In the Reference Case, natural gas capacity nearly doubles from 21.5 GW in 2016 to 41.7 GW in 2040. Figure 3.19 shows generation from natural gas and coal over the projection period.
Figure 3.19 - Generation by Natural Gas and Coal Plants, Reference Case
Description
This graphs compares projected electricity generation by natural gas plants to coal plants in the Reference Case for all of Canada. While natural gas plant generation increase from 66.06 TW.h in 2015 to 128.05 TW.h in 2040, coal decreases from 62.26 TW.h in 2015 to 4.14 TW.h in 2040.
- Natural gas capacity also increases as a result of increasing use of intermittent renewable resources such as wind and solar. Greater production from intermittent generation sources requires grid operators to be able to accommodate fluctuations in both electricity consumption and production. This makes natural gas plants’ ability to increase or decrease generation quickly an attractive quality, especially in provinces without large scale hydro resources. Chapter 4: Technology Case Results, discusses some of the options available to integrate intermittent renewables.
Oil
- Oil-fired power plants accounted for only 2.5% of total Canadian installed capacity in 2015 but are an important part of the electricity supply mix in some smaller provinces and territories. Oil-fired power plants, which mostly run on diesel, are used to generate electricity during peak demand periods or in areas where other generation options are not widely available.
- Total oil-fired capacity declines from 3.8 GW in 2016 to 3.3 GW in 2040. This reflects the retirements of aging units, which are being replaced by renewable power, natural gas or LNG-fired units when possible.
HCP Case Electricity Results
- Higher carbon pricing has a modest overall impact on Canada’s electricity sector. Reasons for this include:
- Canada already has a low emitting electricity sector, with hydro, renewables, and nuclear making up the majority of generation. Carbon pricing more directly impacts emitting resources which make up a smaller portion of Canada’s electricity supply.
- Numerous climate policies already target the electricity sector, particularly the phase out of traditional coal-fired generation. As a result, the impact of higher carbon pricing is muted compared to scenarios in which those policies are not in place.
- Many types of generating facilities have high upfront capital costs and long economic lives. As a result, the electricity mix can be slow to change in response to changing fuel prices.
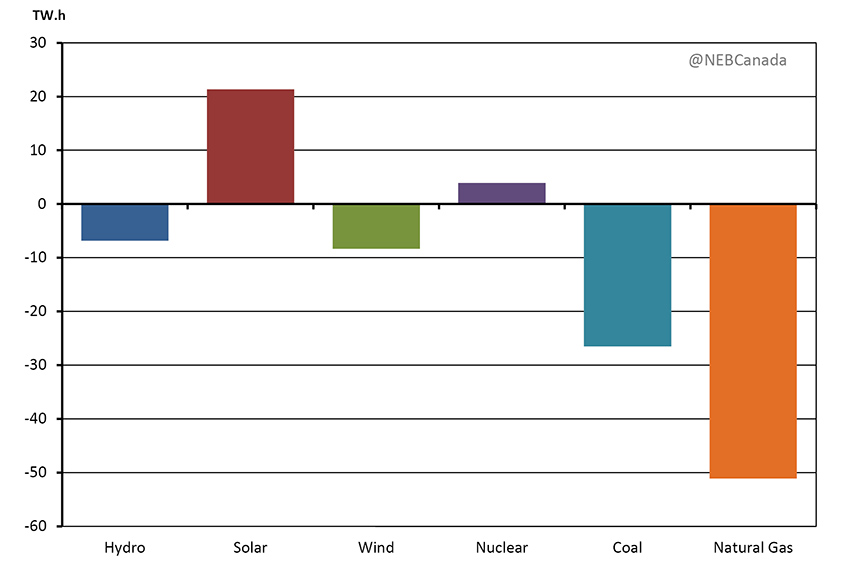
- In the HCP Case, higher fuel prices, and hence higher electricity prices, result in somewhat lower electricity consumption over the projection period. By 2040, electricity use is 1.1% lower compared to the Reference Case. This results in slightly lower generation by most generation types over the projection period, although the biggest reduction is for coal and natural gas. Figure 3.20 shows cumulative generation from 2022 to 2040, by fuel type, in the HCP Case compared to the Reference Case. Solar capacity grows somewhat more quickly in the HCP Case due to higher carbon pricing, resulting in greater solar generation compared to the Reference Case.
Figure 3.20 - Cumulative Generation from 2022 to 2040 by Fuel, HCP Case Compared to the Reference Case
Description
This chart compares the cumulative difference in electricity generation, by fuel source, between the Reference and HCP Cases for the projection period. Throughout the projection period, hydro generation in the HCP Case is 6.83 TW.h lower compared to the reference case, while wind generation is 8.33 TW.h lower, coal is 26.53 TW.h lower, and natural gas 51.1 TW.h lower. Conversely, solar generation is 21.3 TW.h higher in the HCP Case compared to the Reference Case, while nuclear is also 4 TW.h higher in the HCP Case.
Key Uncertainties
- The capital costs associated with building different generating technologies is an important factor in determining what type of facilities are built. Future costs for technologies can be uncertain, particularly for less mature technologies such as wind, solar, and CCS. Chapter 4 explores the uncertainty associated with lower cost assumptions for these types of technologies compared to the Reference Case.
- Strong growth in both utility-scale and rooftop solar capacity in some southwestern U.S. states is creating new challenges for grid operators. High levels of solar generation during sunny hours results in steep drops in non-solar generation in the morning and rapid increases in the evening once the sun begins to set. This pattern is impacting non-solar generation in those regions, favouring generators with the ability to increase or decrease generation quickly. While most regions in Canada do not get as much solar radiation as the U.S. southwest, the implications of much faster growth in solar than projected in EF2017 is a key uncertainty.
- Electricity demand growth is an important factor in determining future electricity supply. As a result, the uncertainties identified in the “Energy Demand” section are uncertainties to the electricity supply projections.
Coal
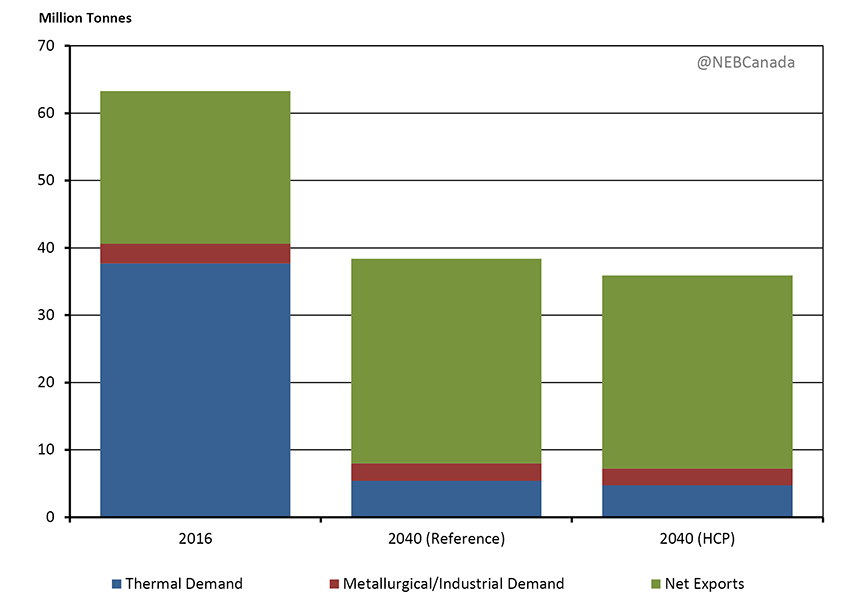
- Total Canadian coal production in 2015 was 61.9 million tonnes. There are two main types of coal produced in Canada, thermal and metallurgical coal. As the fuel for coal-fired power generation, Canadian thermal coal production is linked to the use of coal in the electricity sector, particularly in Alberta and Saskatchewan. Metallurgical coal is primarily used for steel manufacturing domestically and internationally. Much of Canada’s metallurgical coal production is exported and future production trends are linked to global coal demand and prices.
- Thermal coal, mostly used for power generation, accounted for 93% of total coal consumption in 2015 in Canada. In the Reference Case, demand for thermal coal declines by 86% over the projection period, falling from 37.7 million tonnes in 2016 to 5.4 million tonnes in 2040. Most of the thermal coal consumed in 2040 is used in coal-fired generation facilities equipped with CCS technology.
- This declining trend is driven primarily by retirements of coal-fired generation capacity resulting from regulations to phase out traditional coal-fired power plants by 2030. In response to declining domestic demand, production of thermal coal in Canada falls from 36.3 million tonnes in 2016 to 7.9 million tonnes by 2040.
- Domestic demand for metallurgical coal used in steel manufacturing peaks in 2019 at 3.0 million tonnes and declines slightly over the projection period to 2.6 million tonnes in 2040. Global demand for metallurgical coal grows moderately over the projection period, resulting in steady growth in net exports from Canada. Total metallurgical coal production in Canada increases from 26.9 million tonnes in 2016 to 30.5 million tonnes in 2040.
- Figure 3.21 shows Canadian production and consumption of coal in Canada in 2016 and 2040 in the Reference and High Carbon Price Cases.
Figure 3.21 - Canadian Coal Production and Disposition, Reference and High Carbon Price Cases
Description
This graphs breaks down coal production and disposition in both the Reference and Higher Carbon Price Cases. Demand for thermal coal decreases from 37.7 million tonnes in 2016 to 5.4 million tonnes in the Reference Case, and 4.7 million tonnes in the Higher Carbon Price Case, by 2040. Metallurgical coal demand decreases from 2.9 million tonnes in 2016 to 2.6 million tonnes in the Reference Case, and 2.5 million tonnes in the Higher Carbon Price Case, by 2040. Net Exports increase from 22.7 million tonnes in 2015 to 30.4 million tonnes in the Reference Case, and 28.7 million tonnes in the Higher Carbon Price Case, by 2040.
- In the HCP Case, coal production is 6% lower by 2040 compared to the Reference Case. Coal is a GHG-intensive fuel meaning that the carbon costs per unit of energy are higher compared to other fossil fuels when carbon is priced. As a result, utilization of coal-fired generation in the HCP Case is lower compared to the Reference Case. In addition, the HCP Case assumes greater global climate action than in the Reference Case, resulting in somewhat lower global demand for metallurgical coal and lower exports of Canadian coal.
Key Uncertainties
- Global coal markets and price trends are a key uncertainty for Canadian coal exports. If coal importing countries shift further away from using coal, it is also possible that demand and prices could decrease. It is also possible that global coal demand for steel and electricity generation could be higher than anticipated and lead to greater exports as well.
GHG Emissions
- Currently, energy use and GHG emissions in Canada are closely related. The majority of GHGs emitted in Canada are a result of fossil fuel combustion. Fossil fuels provide the vast majority of energy used to heat homes and businesses, transport goods and people, and power industrial equipment. Emissions from fossil fuels, including those used for the production of energy, accounted for 81% of Canadian GHG emissions in 2015. The remaining emissions are from non-energy sources such as agricultural and industrial processes, and waste handling.
- Environment and Climate Change Canada (ECCC) publishes Canada’s official GHG projections in its Canada’s Emission Trends report and in Canada’s Biennial Report to the United Nations Framework Convention on Climate Change.
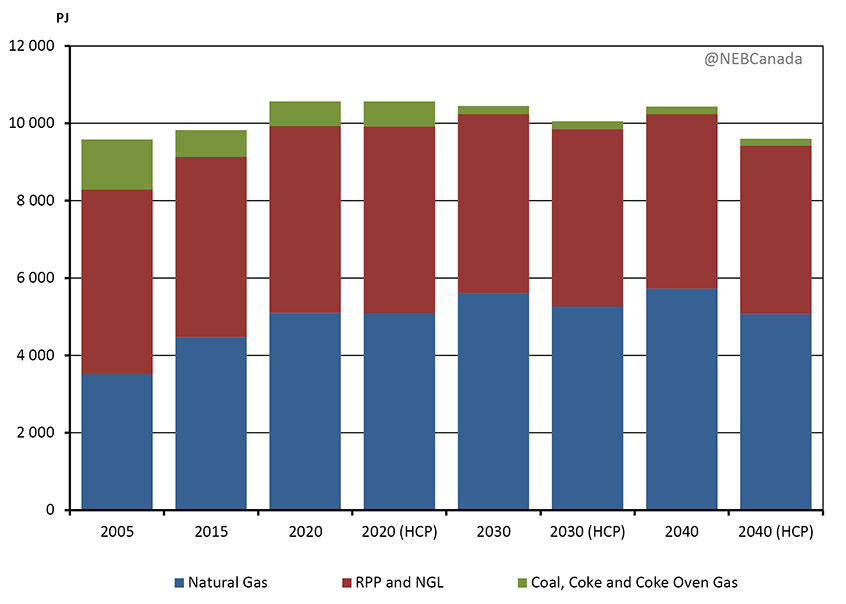
- In the Reference Case, fossil fuel consumption increases early in the projection period. By 2019 consumption peaks and is relatively flat through the remainder of the projection period and is slightly lower than 2019 levels by 2040. Fossil fuel consumption in 2040 is 4.3% higher than in 2016, and nearly 9% higher than in 2005.
- In the HCP Case, fossil fuel consumption also peaks in 2019 and declines more quickly compared to the Reference Case. Fossil fuel consumption in 2040 is 4% lower than in 2016, and is nearly the same as in 2005. Figure 3.22 shows fossil fuel consumption by fuel in the Reference and HCP cases.
Figure 3.22 - Total Demand for Fossil Fuels, Reference and HCP Cases
Description
This chart shows total demand for fossil fuels in both the Reference and HCP Cases. Total demand for coal, coke, and coke oven gas in the Reference Case decreases from 694 PJ in 2015, to 640 PJ in 2020, 207 PJ in 2030, and 191 PJ in 2040. Likewise, total demand for coal, coke, and coke oven gas in the HCP Case decreases from 694 PJ in 2015, to 639 PJ in 2020, 197 PJ in 2030, and 175 PJ in 2040. Total demand for refined petroleum products and natural gas liquids in the Reference Case increases initially from 4 658 PJ in 2015, to 4828 PJ in 2020, before decrease to 4 637 PJ in 2030, and 4 509 PJ in 2040. Likewise, total demand for refined petroleum products and natural gas liquids in the HCP Case increases initially from 4 658 PJ in 2015, to 4 832 PJ in 2020, before decrease to 4 588 PJ in 2030, and 4 357 PJ in 2040. Total demand for natural gas in the Reference Case increases from 4 471 PJ in 2015 to 5 100 PJ in 2020, 5 602 PJ in 2030, and 5 729 PJ in 2040. Total natural gas demand in the HCP Case increases initially from 4 471 PJ in 2015 to 5 091 PJ in 2020 and 5 264 PJ in 2030, before decreasing to 5 067 PJ in 2040.
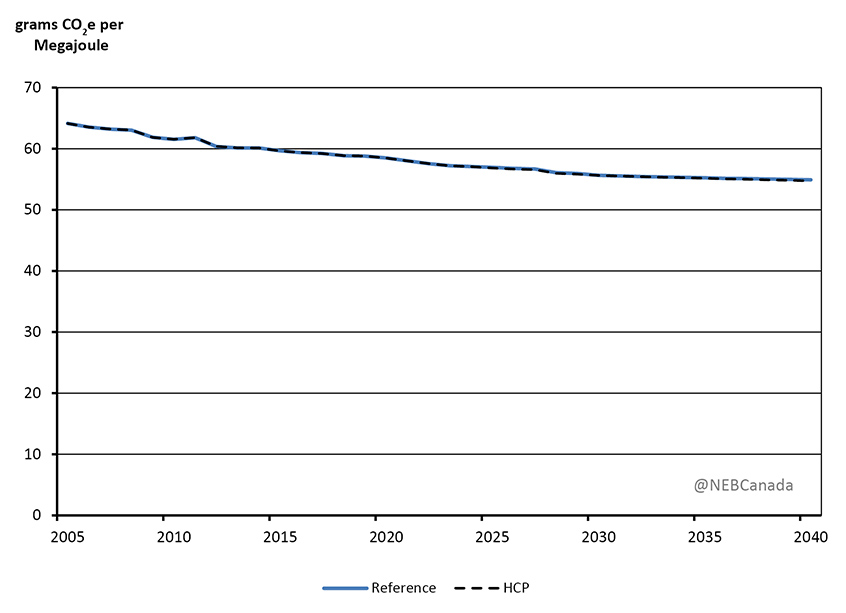
- While total fossil fuel consumption grows in the Reference Case, a changing fuel mix leads to declining GHGs per unit of fossil fuel energy used, as shown in Figure 3.23. Growth in natural gas, coupled with a steep drop in coal, results in GHG intensity declining by 7.5% from 2016 to 2040, or 14% from 2005 to 2040. Capturing carbon from facilities that employ CCS technology also reduces the GHG intensity of fossil fuel use. The GHG intensity of the fuel mix in the HCP Case is similar to the Reference Case. Accounting for reductions in non-combustion emissions, such as reducing methane leaks, as well as including emission credits purchased through international trading mechanisms (such as Ontario and Quebec’s emission trading with California) could further decrease emissions intensity.
Figure 3.23 - Estimated Weighted-Average GHG Emission Intensity of Fossil Fuel Consumption, Reference and HCP Cases
Description
This chart shows the estimated weighted average GHG emission intensity of fossil fuel consumption for both the Reference and HCP cases over the projection period. In the Reference Case, grams of CO2 per MJ decrease from 59.64 in 2015 to 54.91 in 2040. In the HCP Case, grams of CO2 per MJ decrease from 59.64 in 2015 to 54.73 in 2040.
Key Uncertainties
- The uncertainties identified in the Energy Demand section of this chapter, such as future climate policies and technology development, are also key uncertainties to the fossil fuel combustion-related GHG emission results.
- Date modified: