ARCHIVED – Canada’s Energy Future 2016: Energy Supply and Demand Projections to 2040
This page has been archived on the Web
Information identified as archived is provided for reference, research or recordkeeping purposes. It is not subject to the Government of Canada Web Standards and has not been altered or updated since it was archived. Please contact us to request a format other than those available.
January 2016
Copyright/Permission to Reproduce
ISSN 2292-1710
How to cite: National Energy Board. Canada's Energy Future 2016: Energy Supply and Demand Projections to 2040
DOI: https://doi.org/10.35002/qb3a-x355
Downloads
- Canada’s Energy Future 2016: Energy Supply and Demand Projections to 2040 [PDF 10697 KB]
- Executive Summary [PDF 3518 KB]
Data
Letter from the Chair and CEO of the National Energy Board
I am pleased to introduce the 2016 edition of the National Energy Board’s Energy Futures series. Canada’s Energy Future 2016: Energy Supply and Demand Projections to 2040 (EF 2016) continues a long tradition of energy outlooks which the National Energy Board has been producing regularly since 1967. The only publicly available Canadian long-term energy outlook covering all energy commodities and all provinces and territories, this series provides Canadians a key reference point for discussing the country's energy future. This Report relies on the extensive energy market expertise of the Board’s technical staff. In addition, energy experts from government, industry, environmental organizations and academia across Canada provided input on the preliminary assumptions and results of this report. I would personally like to thank all those who contributed.
To use “uncertain” to characterize the past 18 months in Canadian energy would be an understatement. I doubt there is a single market observer who could have foreseen the dramatic fall in the global price of crude oil, one of Canada’s largest exports, from US$110 per barrel in mid-2014 to less than US$40 per barrel by end of December 2015 and then to less than US$30 per barrel in January 2016. Among many other factors contributing to the lack of clarity on Canada’s energy future were the unprecedented market volatility, the rapid deployment of advanced technologies for renewable and fossil fuel energy production, a historic climate agreement in Paris, the denial of the Keystone XL project in the U.S., the lifting of the U.S. oil export ban, as well as the lifting of sanctions on Iran.
Producing an energy supply and demand projection in this context is challenging, to say the least. Nonetheless, the projections in EF 2016 remain valid reference points for discussing Canada’s long-term energy future amid the current global energy uncertainty. Our analysis is not a prediction of future outcomes but rather projections of what might occur given a certain set of assumptions and inputs. This report, which centers on a baseline projection, also outlines alternate projections for higher and lower energy prices, and alternate market access and energy infrastructure assumptions, and then goes on to explore the important long-term implications of these energy market uncertainties.
The alternative projections in EF 2016 strike me as particularly relevant in the current context. As recently noted by Bank of Canada Governor Stephen Poloz, the drop in crude oil prices, as well as in other commodities, has had an unambiguously negative impact on the Canadian economy. EF 2016 indicates that the development of future energy infrastructure directly impacts export prices, future production growth and the overall Canadian economy. While Canada has no influence on global commodity prices, it does have control over the ability to access new markets for our exports and receive the full value in the global market place, whatever future global prices may be.
Of course, building new infrastructure and reaching new markets will hinge on Canada’s ability to develop its resources sustainably and transport them safely. And one thing that is clear amidst this uncertainty is that the link between energy and the environment is stronger than ever, and will continue to strengthen in the future. This stems from the fact that a majority of greenhouse gases (GHGs) emitted in Canada result from the combustion of fossil fuels and that those fossil fuels provide the vast majority of energy currently used to heat homes and businesses, transport goods and people, and power industrial equipment. In all of the EF 2016 projections, hydrocarbon energy use continues to increase, which implies increasing GHG emissions. This is important because it shows that high or low oil and natural gas prices, or the number of pipelines or LNG terminals that are built, while having a modest impact on energy use, will not lead to significant overall emission reductions by themselves. As long as there is demand for energy, markets will function to provide the supply, whether from domestic or international sources, with little consequential impact on global energy use and the associated emissions.
In recent months the federal and many provincial governments in Canada have made announcements about new climate policy initiatives and the momentum is increasing, especially following the agreement at the 21st Conference of the Parties in Paris. Many of these policies are quite bold and put Canada in the position of having some of the most advanced climate change policies in the world. EF 2016 does not include many of these recent announcements, as it only reports on policies and programs that are law, or near law at the time of analysis, but it does highlight their significance. The insights from the report suggest to me that these policy developments will be critical factors in CTable of Contentsanada’s energy and environmental future, and the possible addition of climate policy developments beyond those just announced will represent a considerable uncertainty for long-term energy projections.
Canada’s energy future will not be determined by a single force, but rather the interaction of many. Energy prices, economic growth, policies and regulation, market access and infrastructure development, and the development and use of new technologies will all play an important role. It is our goal to help Canadians understand these complex interactions through our analysis, reports, and statistics. The long-term projections in our Energy Futures series are an important part of that, along with the topical market analysis found in publications such as the Canadian Energy Dynamics annual review, and the weekly Market Snapshots. However, as climate policy and energy markets rapidly and continuously evolve, the type of analysis we undertake and the way by which we share that analysis with Canadians must evolve as well. In response, the Board will complete an update to EF 2016 this coming autumn to incorporate recent developments. Just as EF 2016 includes groundbreaking analysis on the long-term impacts of market access and transportation infrastructure, future work may focus on the implications of future climate policy developments.
Not only will we increase the frequency and depth of our Energy Futures projections, we will also implement some new and exciting ways of engaging with Canadians on energy, and look forward to hearing from them on issues that matter the most in these uncertain times.
C. Peter Watson, P.Eng., FCAE
Chair and CEO
- Letter from the Chair and CEO of the National Energy Board
- Executive Summary
- Foreword
- Chapter 1. Introduction
- Chapter 2. Energy Context
- Chapter 3. Key Drivers
- Chapter 4. Energy Demand Outlook
- Chapter 5. Crude Oil Outlook
- Chapter 6. Natural Gas Outlook
- Chapter 7. Natural Gas Liquids Outlook
- Chapter 8. Electricity Outlook
- Chapter 9. Coal Outlook
- Chapter 10. Constrained Oil Pipeline Capacity Case
- Chapter 11. Liquefied Natural Gas Export Cases
- Chapter 12. Greenhouse Gas Emission Outlook
- List of Figures
- List of Tables
- List of Acronyms and Abbreviations
- List of Units
- Glossary
- Endnotes
Executive Summary
Canada’s Energy Future 2016: Energy Supply and Demand Projections to 2040 (EF 2016) is a continuation of the National Energy Board’s (NEB) Energy Futures series. The Board released the last full report, Canada’s Energy Future 2013 (EF 2013), in November 2013.
In developing EF 2016, the NEB met with various energy experts and interested stakeholders, including representatives from industry and industry associations, government, non-governmental organizations, and academia to gather input and feedback on the preliminary projections. The information obtained from these consultations helped shape the key assumptions and final projections.
It is important to note that the projections presented in EF 2016 are a baseline for discussing Canada’s energy future today and do not represent the Board’s predictions of what will take place in the future. The projections in EF 2016 are based on assumptions which allow for analysis of possible outcomes. Any assumptions made about current or future energy infrastructure or market developments are strictly theoretical and have no bearing on the regulatory proceedings that are or will be before the Board.
Key Findings
The key findings of EF 2016 are outlined below and then summarized in the following pages:
- 1. Recent developments have highlighted numerous uncertainties for Canada’s long-term energy outlook.
- 2. In the Reference Case, energy production grows faster than energy use and net exports of energy increase.
- 3. The levels of future oil and natural gas production are highly dependent on future prices, which are subject to considerable uncertainty.
- 4. Without development of additional oil pipeline infrastructure, crude oil production grows less quickly but continues to grow at a moderate pace over the projection period.
- 5. The volume of liquefied natural gas exports is an important driver of Canadian natural gas production growth.
- 6. Total energy use in Canada, which includes energy use in the energy production sector, grows at similar rates in all EF 2016 cases, and GHG emissions related to that energy use will follow similar trends.
1. Recent developments have highlighted numerous uncertainties for Canada’s long-term energy outlook.
In recent years, energy prices, technology, external markets and societal factors have all undergone substantial shifts over a short period of time. As the energy system continues to adjust and new trends emerge, there are considerable uncertainties in Canada’s long-term energy outlook.
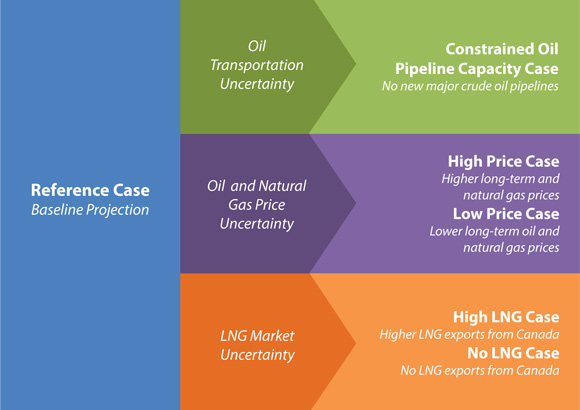
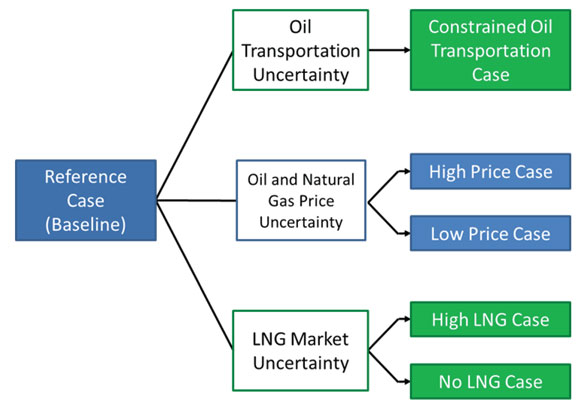
The projections in EF 2016 include a Reference Case, two price sensitivity cases and three supplemental sensitivity cases:
- The Reference Case provides a baseline outlook, based on a moderate view of future energy prices and economic growth.
- Two price cases, with higher and lower oil and natural gas prices, capture some of the uncertainty related to future energy prices.
- EF 2016 also addresses uncertainties related to future oil export infrastructure by considering a case where no new major oil pipelines are built over the projection period.
- The uncertainty related to eventual volumes of liquefied natural gas (LNG) exports is explored in two additional cases.
Figure ES.1 - Overview of Cases in EF 2016
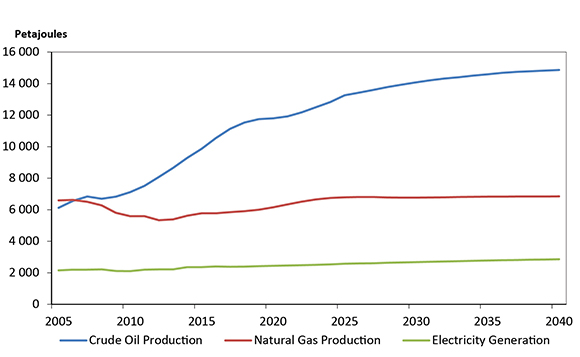
2. In the Reference Case, energy production grows faster than energy use and net exports of energy increase.
In the baseline projection of EF 2016 (the Reference Case), total Canadian energy production grows substantially over the projection period:
- Oil production leads this growth, with production reaching 963 10³m³/d (6.1 MMb/d) by 2040, a 56 per cent increase from 2014. Much of this growth takes place in the oil sands.
- Natural gas production increases 22 per cent from 2014 levels to 506 106m³/d (17.9 Bcf/d), and LNG exports are a key driver of production growth.
- Electricity generation grows steadily over the projection period, with considerable additions of natural gas and renewable capacity while coal capacity declines.
Figure ES.2 - Energy Production in Canada, on an Energy Equivalent Basis, Reference Case
While production grows steadily, energy use in Canada increases less quickly than in the past. Total end-use energy demand increases at an average annual rate of 0.7 per cent from 2014 to 2040, almost half the rate of increase from 1990 to 2013.
Combined, net exports of energy increase over the projection period, led by increasing heavy crude oil exports.
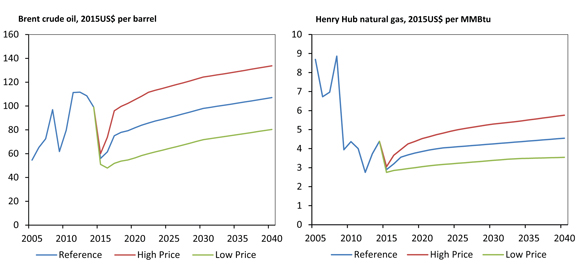
3. The levels of future oil and natural gas production are highly dependent on future prices, which are subject to considerable uncertainty.
Over the last decade, both crude oil and natural gas prices have been volatile. The EF 2016 High and Low price cases consider the impacts of different price trends on Canada’s energy outlook. Crude oil and natural gas prices can exhibit substantial variation in the short term, and could be outside of the ranges assumed in EF 2016 at a given point in time.
Production of crude oil in all three EF 2016 price cases is similar from 2015 to 2020, as oil sands projects already under construction are likely to be developed. In the High Price Case, total oil production continues to grow robustly, reaching 1 103 10³m³/d (6.9 MMb/d) by 2040, 15 per cent higher than the Reference Case. In the Low Price Case, total oil production grows little after 2020, reaching 770 10³m³/d (4.8 MMb/d) by 2040, or 20 per cent less than the Reference Case.
In the High Price Case, natural gas production grows quickly, reaching 665 106m³/d (24 Bcf/d) by 2040, 31 per cent higher than in the Reference Case. In the Low Price Case, total gas production is relatively flat until 2019. Production begins to increase in conjunction with assumed LNG exports and then declines gradually starting in 2026, reaching 440 106m³/d (16 Bcf/d) by 2040, or 13 per cent less than in the Reference Case.
Figure ES.3 - EF 2016 Crude Oil and Natural Gas Price Assumptions
4. Without development of additional oil pipeline infrastructure, crude oil production grows less quickly but continues to grow at a moderate pace over the projection period.
The Reference Case assumes that energy infrastructure is built as needed. However, the pace of development of oil pipeline infrastructure is a notable uncertainty for the Canadian energy system. The Constrained Oil Pipeline Capacity Case (Constrained Case) considers the impact on the Canadian energy system if no new major oil export pipelines are built over the projection period, including the Keystone XL, Northern Gateway, Trans Mountain Expansion and Energy East pipeline proposals.
In this case, the increased use of rail, a more expensive shipping mode, leads to lower prices received by Canadian producers, net of transportation costs. Despite somewhat lower prices compared to the Reference Case, crude oil production continues to grow as many projects remain profitable. Oil production in the Constrained Case reaches 882 10³m³/d (5.6 MMb/d) by 2040, eight per cent lower than the Reference Case. Crude oil shipped by rail grows substantially over the projection, reaching 187 10³m³/d (1.2 MMb/d) by 2040.
Figure ES.4 - Total Oil Production, Reference, High Price, Low Price and Constrained Cases
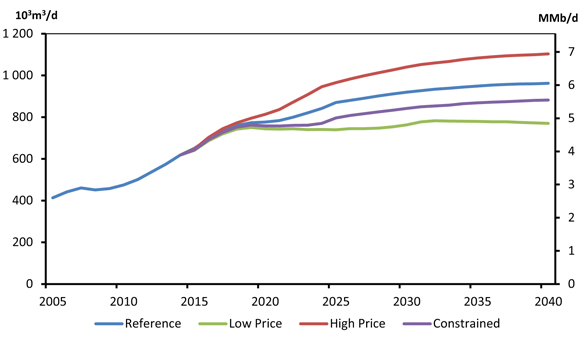
Total Canadian production in the Constrained Case grows quicker than in the Low Price Case, and production is 15 per cent higher than the Low Price Case by 2040. This suggests that although pipeline infrastructure may impact Canadian oil production, it is one of many factors that may do so. The High and Low Price cases suggest that crude oil prices, driven by global supply and demand dynamics, are also an important - perhaps the most important - determinant of Canadian production growth.
5. The volume of liquefied natural gas exports is an important driver of Canadian natural gas production growth.
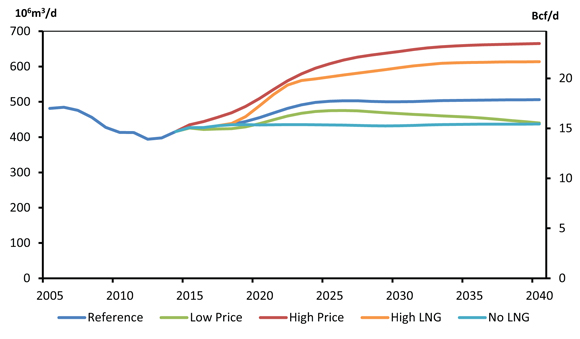
The Reference Case assumes that LNG exports begin in 2019 at 14 106m³/d (0.5 Bcf/d) and increase to 71 106m³/d (2.5 Bcf/d) by 2023. This is an assumption, as there is considerable uncertainty regarding the volume of LNG that Canada might export globally. Two EF 2016 cases, the High and No LNG cases, analyze this uncertainty.
The High LNG Case assumes higher LNG exports than the Reference Case, with exports reaching 170 106m³/d (6 Bcf/d) by 2040. The No LNG Case assumes that no LNG exports occur by 2030.
Exports of LNG could be a significant driver of future Canadian natural gas production growth. In the High LNG Case, total natural gas production reaches 614 106m³/d (22 Bcf/d) by 2030, 21 per cent higher than in the Reference Case. In the No LNG Case, total production is 437 106m³/d (15 Bcf/d) by 2040 or 14 per cent lower than the Reference Case.
Figure ES.5 - Total Natural Gas Production, Reference, Price, and LNG Cases
6. Total energy use in Canada, which includes energy use in the energy production sector, grows at similar rates in all EF 2016 cases, and GHG emissions related to that energy use follow similar trends.
The outcomes of the sensitivity cases in EF 2016 have implications for Canadian energy use. Numerous dynamics are at play but overall, the total differences in energy consumption across the cases are relatively small.
In the Reference Case, total energy use grows from 13 444 petajoules (PJ) in 2013 to 16 233 PJ in 2040. The energy intensity of the Canadian economy, measured in energy use per unit of economic activity, continues its declining trend and falls by an average of one per cent per year from 2013 to 2040.
Given the policy and technology assumptions of this analysis, fossil fuels remain the primary source of energy in Canada over the projection period. This increase in fossil fuel consumption implies that GHG emissions will increase over the projection period, consistent with the most recent GHG emission projections from Environment and Climate Change Canada.
Higher and lower energy prices impact energy use across the economy in different ways. Canada is a major producer of energy and this tends to influence its role as a consumer of energy. Energy use is highest in the High Price Case, reaching 16 659 PJ by 2040. Slightly higher economic growth and more demand in the oil and natural gas producing sector outweigh the downward impact of higher prices on consumption. The impact is reversed in the Low Price Case, which has the lowest energy use of the cases at 15 840 PJ in 2040, despite higher consumption outside of the oil and natural gas sector.
Figure ES.6 - Canadian Energy Use, All Cases
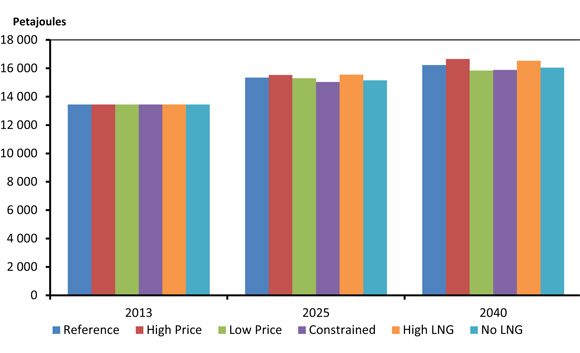
Energy use in the Constrained Case falls between the Reference and Low Price Case projections, at 15 887 PJ by 2040. The primary reason for lower total demand is lower energy use for oil production. Slightly slower economic growth also has a minor impact.
Canadian energy use in the High LNG Case reaches 16 531 PJ by 2040, slightly above the Reference Case. The impact is reversed in the No LNG Case, with energy use reaching 16 042 PJ by 2040, just below the Reference Case.
The relatively small impact on energy use in the sensitivity cases suggests that factors other than energy prices, oil pipeline development and LNG exports could have a more significant impact on future energy use and GHG emission trends in Canada. Economic growth trends are also important and can have a very large impact on Canadian energy use and emissions. For example, the 2008-2009 global economic downturn contributed to the nearly eight per cent drop in Canadian energy use from 2007 to 2009. Similarly, technological developments beyond those considered in this report could result in markedly different outcomes. Finally, the EF 2016 cases only include existing laws, policies and programs, and future laws, policies and programs could strongly influence long term energy use and GHG emissions.
Foreword
The National Energy Board (NEB or Board) is an independent federal, quasi-judicial regulator established in 1959 to promote safety and security, environmental protection, and economic efficiency in the Canadian public interest within the mandate set by Parliament for the regulation of pipelines, energy development, and trade.
The Board's main responsibilities of the NEB are established in the NEB Act and include regulating:
- the construction, operation and abandonment of oil and gas pipelines that cross international borders or provincial/territorial boundaries, as well as the associated pipeline tolls and tariffs;
- the construction and operation of international power lines, and designated interprovincial power lines; and
- imports of natural gas, and exports of crude oil, natural gas, oil, natural gas liquids (NGLs), refined petroleum products and electricity.
Additionally, in specified areas, the Board has regulatory responsibilities for oil and gas exploration and production activities under the National Energy Board Act (the NEB Act), Canada Oil and Gas Operations Act (COGOA), the Canada Petroleum Resources Act (CPRA), and the North West Territories’ Oil and Gas Operations Act (OGOA) and Petroleum Resources Act (PRA). For oil and natural gas exports, the Board’s role is to evaluate whether the oil and natural gas proposed to be exported is surplus to reasonably foreseeable Canadian requirements, having regard to the trends in the discovery of oil or gas in Canada. The Board monitors energy markets, and assesses Canadian energy requirements and trends of oil and natural gas discovery to support its responsibilities under Part VI of the NEB Act. The Board periodically publishes assessments of Canadian energy supply, demand and markets in support of its ongoing market monitoring. These assessments address various aspects of energy markets in Canada. This report, Canada’s Energy Future 2016: Energy Supply and Demand Projections to 2040 (EF 2016) is one such assessment that projects long-term Canadian energy supply and demand trends.
This report does not provide an indication about whether any application will be approved or not. The Board will decide on specific applications based on the material in evidence before it at that time.
Comments or questions on this report can be directed to: energyfutures@cer-rec.gc.ca.
If a party wishes to rely on material from this report in any regulatory proceeding before the NEB, it may submit the material, just as it may submit any public document. Under these circumstances, the submitting party in effect adopts the material and that party could be required to answer questions pertaining to the material.
EF 2016 was prepared by National Energy Board technical staff under the Direction of Abha Bhargava, Director, Energy Integration; Matthew Hansen (matthew.hansen@cer-rec.gc.ca, 403-299-3179), Co-Project Manager - Energy Futures; Bryce van Sluys (bryce.vansluys@cer-rec.gc.ca, 403-299-3711), Co-Project Manager - Energy Futures.
Specific questions about the information in this report may be directed to:
Connor McDonald
Darcy Johnson
Michael Nadew (michael.nadew@cer-rec.gc.ca)
Chris Doleman (chris.doleman@cer-rec.gc.ca)
Chapter 1. Introduction
- Canada’s Energy Future 2016: Energy Supply and Demand Projections to 2040 (EF 2016) projects energy supply and demand for Canada to the year 2040.
- The National Energy Board (NEB) has been producing long-term supply and demand projections regularly since 1967.
- EF 2016 considered three core cases which are discussed throughout the main body of the report:
- The Reference Case with baseline projections is based on the current macroeconomic outlook and a moderate view of energy prices; and
- The High and Low Price Cases which address the uncertainty related to future crude oil and natural gas prices.
- Four key assumptions underpin the core cases:
- All energy production will find markets and infrastructure will be built as needed.
- Only policies and programs that are law at the time of writing are included in the projections. As a result, any policies under consideration, or new policies developed after the projections were completed in the summer of 2015, are not included in this analysis.
- Environmental and socio-economic considerations beyond the included policies and programs, are outside the scope of this analysis.
- Energy markets are constantly evolving. The analysis presented in EF 2016 is based on the best available information at the time of finalizing the analysis and results, which was the summer of 2015.
- EF 2016 also introduces three supplemental sensitivity cases which explore issues related to markets and infrastructure:
- The Constrained Oil Pipeline Capacity Case (Constrained Case) considers the impact on the Canadian energy system if no new major oil pipelines are constructed over the projection period. This case is discussed in Chapter 10.
- The High Liquefied Natural Gas (LNG) and No LNG cases consider the uncertainty related to the global LNG market and Canada’s ability to compete for market share. These cases consider higher and lower Canadian LNG export volumes than those in the Reference Case. These cases are discussed in Chapter 11. The relationship between the six cases in EF 2016 is shown in Figure 1.1.
Figure 1.1 - EF 2016 Sensitivity Cases
- While developing EF 2016 the NEB met with various energy experts and interested stakeholders, including representatives from industry and industry associations, government, non-governmental organizations and academia to gather input and feedback on the preliminary projections. Over 160 participants attended one of 12 sessions held either in person or by video conference. The Board would like to thank all participants for their contributions to EF 2016.
- The information obtained from these consultations helped shape the key assumptions and final projections. In addition, feedback following the release of Canada’s Energy Future 2013 (EF 2013) influenced the coverage of EF 2016. Specifically, the development of the LNG and Constrained cases resulted from EF 2013 user comments and questions. Over the projection period, it is likely that developments beyond the realm of normal expectations, such as geopolitical events or technological breakthroughs, will occur. Likewise, new information becomes available and trends, policies, and technology evolve. Readers of this analysis should consider the projections a baseline for discussing Canada’s energy future today, not a prediction of what will take place.
- The following chapters discuss the results from the Reference and sensitivity case projections, highlighting key changes in Canadian energy supply and demand trends. Detailed data tables supporting this discussion are available in the Appendices on the NEB website.
Chapter 2. Energy Context
Content
- The Canadian energy system is in a constant state of change. Factors such as technology, macroeconomics, infrastructure, and government policy and programs continually influence how energy is produced, transported, and consumed in Canada. This section provides insights into these ongoing changes and helps to provide context to the projections discussed in EF 2016. It is organized according to three themes: Canadian Energy in the Global Marketplace, Recent Developments and Emerging Trends, and Unique Regional Energy Dynamics.
- In addition to the information in this section, the NEB issues several other energy information publications that help provide perspective on Canadian energy trends. The Board’s report Canadian Energy DynamicsFootnote 1 reviews important energy market developments each year. Also, the Board publishes regular Market SnapshotsFootnote 2, which provide topical information and analysis on emerging trends in Canadian energy. These reports are part of the collection of energy analysis and statistics available on the NEB’s websiteFootnote 3.
Canadian Energy in the Global Marketplace
Canada in a Global Context
- Canada is a vast northern nation with a relatively small population, a developed economy, and a large natural resource base. Combined, these factors have helped to shape Canada’s energy production and consumption patterns.
- Canada’s energy resources are among the largest in the world. Canadian rivers discharge close to seven per cent of the world's renewable water supplyFootnote 4. This resource provides tremendous hydroelectric generating capability. In addition, Canada ranks third globally in proven oil reserves, 97 per cent of which are in the oil sands, and 15th in both proven natural gas and coal reservesFootnote 5. Canada also ranks fourth in identified resources of uraniumFootnote 6.
- This large and diversified resource base contributes to Canada’s status as a significant global energy producer and exporter. In terms of production, Canada ranks among the top five in the world for hydroelectricity, crude oil, natural gas and uraniumFootnote 7. Table 2.1 illustrates Canadian and global production of major energy commodities.
Table 2.1 - Canadian and Global Production of Select Energy Commodities
| Canadian Production | Global Production | Percentage of Global Production | Canadian Production Rank Among Global Producers | |
|---|---|---|---|---|
| Hydro Electricity (terawatt-hours) |
379 | 3 885 | 9.8% | 2nd |
| Crude Oil (thousand cubic metres per day) |
682 | 14 093 | 4.8% | 4th |
| Natural Gas (million cubic metres per day) |
444 | 9 485 | 4.7% | 5th |
| Coal (Million Tonnes) |
69 | 8 165 | 0.8% | 13th |
| Uranium (Tonnes)Note a |
8 998 | 58 816 | 15.3% | 2nd |
- Canada is also a large consumer of energy. In 2012, Canadian total final energy consumption was 2.3 per cent of the global totalFootnote 8. On a per capita basis, Canada’s energy intensity is among the highest in the world.
- Climate and geography play a key role in Canada’s relatively high energy intensity. A cold and variable northern climate means more energy is consumed heating homes and businesses. Similarly, goods and people often travel further to reach their destinations due to Canada’s large land mass. This requires more energy use compared to geographically smaller nations.
- Economic structure is also important in determining how Canadians use energy. Canada is a developed country with a mature and highly industrialized economy. Extraction and processing of energy and non-energy resources contribute substantially to Canada’s industrial activity, and tend to be energy-intensive.
Crude Oil Price Trends
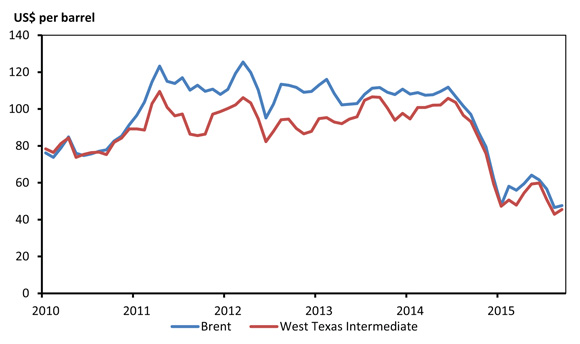
- From 2011 to mid-2014, global crude oil prices were relatively stable at over US$100 per barrel (bbl). In June 2014, Brent crude oil, a key global crude oil pricing benchmark, traded above US$110/bbl. In mid-2014, oil prices began to drop quickly. By January 2015, prices had declined by about 60 per cent to under US$46/bbl. Although prices increased slightly in the spring, in August 2015 both Brent and West Texas Intermediate (WTI), a benchmark for U.S. crude oil, were again trading under US$50/bbl. Figure 2.1 shows the prices for Brent and WTI from 2010 to mid-2015.
Figure 2.1 - Global Crude Oil Prices
- From 2008 to 2014, crude oil production in the U.S. increased by 591 thousand cubic metres per day (10³m³/d)Footnote a or 3.7 million barrels per day (MMb/d)Footnote 9. This substantial increase was made possible by technological advancements that have reduced extraction costs for previously uneconomic resources. This increase in production was an important contributing factor to the decline in oil prices in the second half of 2014.
- Oil demand growth has shifted away from developed economies including Europe and North America to emerging economies: particularly China, India and the Middle East. However the expectations of future demand growth from emerging economies are lower than in past years. Global oil demand, which had increased by 222 10³m³/d (1.4 MMb/d) in 2013, grew by only 134 10³m³/d (0.8 MMb/d) in 2014. China's oil demand growth, which averaged 87 10³m³/d (0.6 MMb/d) per year from 2009 to 2013, fell to 62 10³m³/d (0.4 MMb/d) in 2014Footnote 10.
- In past instances when global oil prices have begun to fall, the Organization of Petroleum Exporting Countries (OPEC) acted to reduce oil production available to the global market. However, in late November 2014, OPEC decided to maintain its crude oil production level despite falling prices. This change in policy surprised many market participants.
- Crude oil producers are responding to lower prices by cutting capital investments in proposed projects and wells in higher cost areas. These decisions will likely affect global crude oil output in the coming years as upstream activity is reduced. The oil price assumptions in EF 2016 reflect this reduction in output and an eventual rebalancing of supply and demand at a higher price level. In the Reference Case, Brent increases to about US$80/bbl by 2020 in current dollar terms. After 2020, Brent slowly increases to US$107/bbl by 2040 given the expectations for continued growth in global oil demand and the need to access higher cost sources of oil supply to meet that demand.
Markets for Canadian Energy Exports
- Almost all of Canada’s crude oil, natural gas and electricity exports go to the U.S. Relatively small amounts of crude oil are shipped overseas to Europe, Asia and South America. The U.S. is likely to be Canada’s primary export market over the projection period. However, the potential emergence of LNG exports and possible additions to crude oil export infrastructure could allow Canadian energy to reach broader markets. Table 2.2 shows Canadian exports of crude oil, natural gas, and electricity in 2014.
Table 2.2 - Canadian Exports of Crude Oil, Electricity and Natural Gas in 2014Note a
| Crude Oil | |||||||
|---|---|---|---|---|---|---|---|
| East Coast (PADD I) |
Midwest (PADD II) |
Gulf Coast (PADD III) |
Rocky Mountain (PADD IV) |
West Coast (PADD V) |
Non-U.S. | Total | |
| 10³m³/d | 40 | 302 | 30 | 38 | 32 | 13 | 454 |
| MMb/d | 0.3 | 1.9 | 0.2 | 0.2 | 0.2 | 0.1 | 2.9 |
| % of Total | 8.8% | 66.5% | 6.5% | 8.4% | 7.1% | 2.8% | - |
| Electricity | |||||||
| East Coast | Midwest | Gulf Coast | Rocky Mountain | West Coast | Non-U.S. | Total | |
| Terawatt-hours | 35.9 | 15.0 | 0.0 | 0.1 | 7.4 | - | 58.6 |
| % of Total | 61.4% | 25.7% | 0.0% | 0.2% | 12.6% | - | - |
| Natural GasNote b | |||||||
| East | Midwest | West | Non-U.S. | Total | |||
| 106m³/d | 27 | 110 | 72 | - | 209 | ||
| Bcf/d | 1.0 | 3.9 | 2.5 | 7.4 | |||
| % of Total | 12.9% | 52.8% | 34.3% | - | - | ||
Crude Oil
- Canada is currently the largest exporter of crude oil to the U.S. Two-thirds of Canadian crude oil exports are delivered to refineries in the U.S. Midwest. The majority of growth in Canadian crude oil exports is likely to be heavy crude oil as the oil sands are projected to be the main driver of growth in Canadian oil production. In addition, the U.S. market is likely to be well supplied with light oil due to growing U.S. light oil production.
- The U.S. Gulf Coast has the largest current capacity to refine heavy crude oil. The U.S. Midwest and West Coast also have significant heavy oil refining capacity. Heavy oil used in the U.S. Midwest mostly comes from Canada.
- Growth in Canadian exports to the U.S. Gulf and West Coasts will depend on demand growth and on the extent that Canadian producers can compete with existing heavy oil suppliers from the Middle East, Mexico, and South America.
- There are a variety of potential destinations for Canadian crude oil exports outside of the U.S. Currently, some light oil produced offshore of Newfoundland and Labrador is exported to markets in the Atlantic basin. Depending on future oil transportation infrastructure developments, western Canadian heavy oil could potentially reach markets in Europe where there is significant refining capacity.
- Western Canadian producers have identified Asia as a potential long-term growth market for heavy crude oil. Canada is well positioned geographically to supply these markets as the distance from Canada’s West Coast to Asia is shorter compared to many other heavy crude oil producing nations.
- Future developments in oil pipeline infrastructure will be an important factor for Canadian oil producers accessing markets outside Canada and the U.S. EF 2016 includes a sensitivity case that considers the impact on the Canadian energy system if no new major oil pipelines are constructed. Chapter 10, which highlights the results of this case, also provides additional context on crude oil transportation issues.
Natural Gas
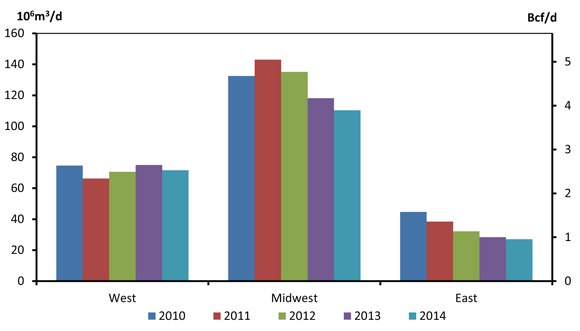
- Canada exports natural gas solely to the U.S. Total exports of natural gas declined by 29 per cent between 2007 and 2014, from 294 million cubic metres per day (106m³/d) or 10.4 billion cubic feet per day (Bcf/d) to 209 106m³/d (7.4 Bcf/d). The U.S. Midwest typically receives about half of Canadian natural gas exports, with the remainder split between the eastern and western U.S. As shown in Figure 2.2, the volume of natural gas exports to the western U.S. has remained relatively stable. Export volumes to the eastern U.S. and the Midwest have declined primarily due to increased natural gas production in the U.S. Northeast.
Figure 2.2 - Canadian Natural Gas Exports by U.S. Market
- Canada also imports natural gas from the U.S., mostly into Ontario. Small amounts of natural gas received as LNG are also imported into the Maritimes via the Canaport LNG terminal. Total natural gas imports more than doubled from 36 106m³/d (1.3 Bcf/d) in 2007 to peak at 86 106m³/d (3.0 Bcf/d) in 2011 before declining gradually in subsequent years.
- In its Annual Energy Outlook 2015 (AEO 2015), the U.S. Energy Information Administration (EIA) projects modest growth in U.S. natural gas demand over the long term, with only the power generation sector showing robust demandFootnote 11. Meanwhile, U.S. natural gas supply is projected to continue to grow, increasing pressure on Western Canadian natural gas production to compete for market share. The EIA projects much of this supply growth to take place in the U.S. Northeast, where natural gas is relatively inexpensive to produce and reserves are situated close to large existing markets, including Eastern Canada. The EIA projects that the U.S. will transition from being a net importer of natural gas to a net exporter by 2018Footnote 12.
- While the market share of western Canadian natural gas in the U.S. and eastern Canada may be contracting, other markets for Canadian natural gas are being explored. Currently, there are multiple proposals to build natural gas liquefaction facilities on Canada’s West and East coastsFootnote 13, all aiming to export LNG to global markets. The eventual volume of LNG exports from Canada is a significant uncertainty for the projections in EF 2016. As a result, two LNG sensitivity cases are considered in Chapter 11, which contain additional context related to potential Canadian LNG exports.
Electricity
- Canada only exports electricity to the U.S. These exports are predominately sourced from provinces with large hydro-electric generation capability: Quebec, British Columbia (B.C.), and Manitoba. Over 60 per cent of Canadian electricity exports are sold into the eastern half of the U.S., the vast majority of which is sold to the U.S. Northeast. States in the Midwest receive about one quarter of Canada’s electricity exports, while about 13 per cent is exported to the U.S. West Coast.
- In August 2015, the U.S. Environmental Protection Agency (EPA) released the final version of the Clean Power Plan (CPP) which sets emissions reduction goals for 47 U.S. states. The EPA estimates that meeting those targets could reduce GHG emissions from the power sector in the U.S. by 32 per cent from 2005 levelsFootnote 14.
- The CPP creates considerable uncertainty for the electricity projections in EF 2016. The final version of the CPP was released in August 2015 and specifies that to meet their emission reduction targets, U.S. states could import electricity from Canadian sources installed after 2012Footnote 15,Footnote 16 . This could create a new market opportunity for Canadian electricity exports and increase the likelihood that various proposed large hydroelectric facilities will be built. Several hydroelectric projects included in the projections are more likely to be constructed if demand for Canadian electricity in the U.S. is stronger.
Energy Consumption and Greenhouse Gas Emissions
- By-products of the combustion of fossil fuels include carbon dioxide (CO2) and other greenhouse gases (GHGs). The Intergovernmental Panel on Climate Change (IPCC)Footnote 17 has reported that recent changes in the Earth’s climate can largely be attributed to the release of GHGs into the atmosphere through human activities. The IPCC also notes that the more human activities disrupt global climate, the greater the risk of severe impacts for people and ecosystems. Many consider climate change to be one of the most important issues of our day. Canada’s total GHG emissions in 2013 were approximately two per cent of global emissions.
- Environment and Climate Change Canada publishes Canada’s official GHG projections in its Canada’s Emission Trends reportFootnote 18 and also in Canada’s Biennial Report to the United Nations Framework Convention on Climate ChangeFootnote 19 (UNFCCC). Much like the analysis in EF 2016, the Emission Trends projections include policies and programs that were in place at the time of analysis.
- The majority of GHGs emitted in Canada result from the combustion of fossil fuels. Fossil fuels include crude oil, natural gas, coal, and refined petroleum products such as gasoline and diesel. They provide the vast majority of energy used to heat homes and businesses, transport goods and people, and power industrial equipment. Emissions from the combustion of fossil fuels, including those used for the production of energy, accounted for 81 per cent of Canadian GHG emissions in 2013Footnote 20. The remaining emissions are from non-energy sources such as agricultural and industrial processes, and waste handling.
- The level of GHGs emitted by the various services that fossil fuels provide depend on how efficiently the fuel is used, and the emission content of fuel. Not all fossil fuels produce the same amounts of GHG emissions when they are converted to energy. The amount of GHG emissions produced depends on the carbon content of the fuelFootnote 21. Natural gas for example, emits about half the carbon dioxide emitted by coal to produce the same amount of energy.
- Given the direct relationship between fossil fuel consumption and GHG emissions, future policies related to climate change represent a key uncertainty for Canada’s energy outlook. The projections in EF 2016 only include policies and programs that are law at the time of analysis. Speculating on government policies and programs that are in planning or are yet to be developed is beyond the scope of this report. Also, as future policies and programs are not known and their potential impact cannot be factored toward achieving emissions objectives, federal or provincial emissions targets may or may not be met in the projections.
Recent Developments and Emerging Trends
Oil and Natural Gas Production from Shale and Tight Resources
- As outlined in EF 2013, the way crude oil and natural gas are produced in North America has undergone a dramatic shiftFootnote 22. The ability to profitably develop the shale and tight formations that had previously been inaccessible has reversed declining trends in both oil and natural gas production. This shift can be largely attributed to technological advancements; a combination of extended-reach horizontal drilling, and multi-stage hydraulic fracturing. Following the widespread application of these technologies, producers have continued to make their operations more efficient and productive through ongoing operational improvements, such as pad drilling.
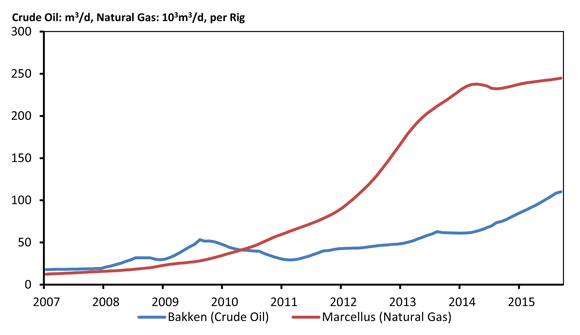
- Production of oil and natural gas produced from tight and shale formations across the U.S. and Canada has demonstrated large improvements in productivity for at least the past eight years. Figure 2.3 shows estimated new production per rigFootnote 23 from two such regions: the U.S. portion of the Bakken, a tight oil play located in North Dakota and Montana, and the Marcellus shale gas play, located in the U.S. Northeast. The trend is similar in numerous other regions of the U.S. and Canada.
Figure 2.3 - Estimated New Production per Drilling Rig, Bakken and Marcellus Production Regions
- Horizontal drilling techniques continue to improve and the distances producers have been able to drill laterally have increased. As a result, producers can access more of the producing zone from one well and perform more stages of hydraulic fracturing per well. In addition, new techniques, such as movable sleeve and coiled tubing fracturing systemsFootnote 24, allow for quicker and more controlled fracturing operations.
- Increasingly, companies are taking advantage of pad drilling. This optimizes horizontal drilling and hydraulic fracturing from a centralized location or well pad. Pad drilling also allows some activity to continue during the spring break-up period, formerly a down-time in Canada.
- The extent to which the productivity of future oil and natural gas wells will increase is a key uncertainty for the price and production projections in EF 2016. Recent improvements in productivity are partly due to producers responding to low prices by only drilling their most productive assets. Over time, it is likely that activity will move to less prolific areas of producing basins which would have a downward impact on productivity. The extent to which technology and improved efficiencies can offset this is uncertain. The projections in EF 2016 take into account recent productivity trends, with productivity increasing or decreasing depending on the producing area. Over the long term, productivity is held constant or declines, depending on the characteristics of particular producing regions.
Energy Use in the Oil Sands
- Over the last several decades, the oil sands have been a major growth area for natural gas use in Canada. Oil sands natural gas demand, including gas consumed for cogeneration, rose from 18 106m³/d (0.7 Bcf/d) in 2000 to 88 106m³/d (3.1 Bcf/d) by 2014, and now represents over 20 per cent of total Canadian natural gas demandFootnote 25.
- Natural gas is used in mining, upgrading, and in situ oil sands production. As discussed in Chapter 5, in situ production represents the majority of future bitumen production and natural gas demand.
- In situ oil sands production can be broadly categorized into two types, primary and thermal. Primary production is heavy oil that flows naturally into a well without the use of heat. It is therefore not energy intensive because it does not use natural gas during production. Primary production has become a smaller component of total in situ production, shrinking from 42 per cent in 2000 to 23 per cent in 2014, and is expected to continue to decline to 11 per cent by 2040.
- Thermal in situ processes are energy intensive. Natural gas is used to heat water to produce steam, which is injected into the ground to heat up the bitumen in the oil reservoir. Heating the bitumen reduces its viscosity, allowing it to flow to the well and be pumped to the surface.
- A project’s steam oil ratio (SOR) is the volume of steam per volume of oil produced. When natural gas is used to produce steam, the SOR becomes a measure of natural gas intensity and a key indicator of an operation’s energy efficiency.
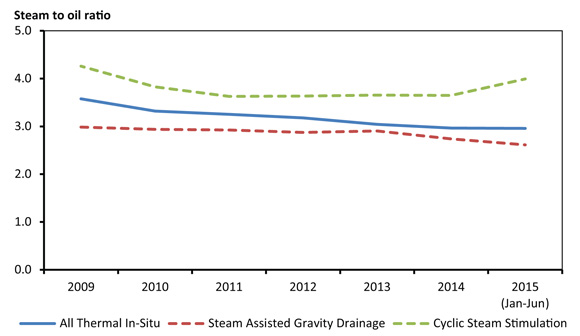
- Figure 2.4 depicts the aggregate SOR for the Alberta in situ industry over the past six years as measured by the ratio of the annual steam usage to annual bitumen production. The two main categories of in situ production are cyclic steam stimulation (CSS) and steam assisted gravity drainage (SAGD). In general, SAGD operations have a lower SOR than CSS. Overall, the recent trend has been declining SORs, but this has varied year-to-year with production type. For example, SAGD SOR was fairly consistent from 2009 to 2013, and exhibited a large decline in 2014. CSS SORs declined from 2009 to 2011, but has gradually trended upward since.
Figure 2.4 - Aggregate Production-weighted SORs for In Situ Oil Sands Projects
- EF 2016 projects that in situ oil sands production will be Canada’s largest source of future oil production growth, as well as one of the key drivers of natural gas demand. However, future trends of oil sands natural gas use are uncertain as various factors may lead to higher or lower SOR values. One factor that may increase SORs is the quality of reservoirs yet to be developed. Recent projects have encountered reservoir rock types that have made production more challenging. These reservoirs exhibit variability in thickness, as opposed to formations that are more predictable and therefore require less steam.
- Technical innovation is an important factor that could decrease future SOR values. Recent innovations include the use of flow control devices that direct steam more uniformly into the reservoirFootnote 26, injecting methane or a solvent such as propane or butane along with the steamFootnote 27, and the drilling of vertical infill wells, or "wedge wells" between older SAGD wells to recover additional bitumen from beyond the existing boundaries of the steam chambersFootnote 28.
- The projections in EF 2016 assume a one per cent annual decrease in SOR over the projection period to reflect the potential for continued innovation.Footnote b Given the uncertainty in future SOR trends and the projected growth in oil sands production, Canadian natural gas demand could vary significantly. For more information on how different SOR assumptions impact energy use projections, Energy Futures Supplement: Demand SensitivitiesFootnote 29 includes various sensitivity cases that change the SOR in the EF 2013 projections.
Small-Scale LNG and Potential for Fuel-Switching in Canada
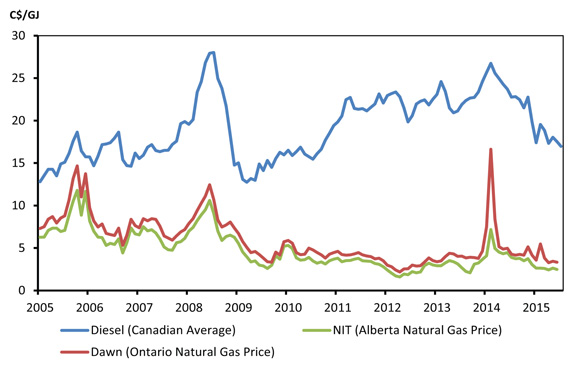
- Small-scale natural gas liquefaction facilities have been in operation Ontario, Quebec and B.C. for almost 45 years. Used in conjunction with LNG storage, these facilities historically functioned to supply natural gas when demand exceeds the capacity constraints of nearby pipelines, a service referred to as "peaking". While there is potential for expanding such peaking services, it is LNG’s role as a substitute for diesel that may be a key driver of investments into small-scale liquefaction facilities into the future.
- In Canada, natural gas costs less than diesel for an equivalent amount of energy. This discount has created interest in using LNG domestically as a diesel substitute. LNG for domestic use is typically produced by small-scale liquefaction facilities which are much smaller than facilities built to liquefy natural gas for export.
- A major challenge to using LNG in Canada has been the lack of small-scale liquefaction infrastructure. Without nearby plants to liquefy natural gas, LNG must be shipped via truck over long distances, adding to the cost for users and reducing its competitiveness compared to other fuels. However, the recent and proposed construction and expansion of small-scale liquefaction facilities will decrease trucking distances for many prospective LNG usersFootnote 30.
- The rate of LNG adoption is related to the difference in prices between natural gas and refined petroleum products (RPPs). Figure 2.5 shows the wholesale prices for diesel and natural gas in Canadian dollars. The oil and natural gas price projections in EF 2016 suggest the differential could be sufficient to encourage growth in domestic LNG consumption.
Figure 2.5 - Wholesale Diesel and Natural Gas Prices
- Electricity producers in remote regions often cannot use natural gas for power generation due to a lack of nearby natural gas production and pipelines. Instead, they have relied on more expensive but more easily transported diesel for their generation needs. The lower cost of LNG compared to diesel could encourage electricity producers to invest in regasification and natural gas-fired generation facilities. This is already occurring in Yukon and the Northwest Territories (NWT),Footnote 31 and several utility companies and governments are exploring whether it is economically feasible in the long term.
- LNG can provide an effective source of natural gas supply when demand exceeds pipeline capacity to a region. It can be expensive to expand pipeline capacity, and if the additional capacity will only be used a few days of the year, it is likely uneconomic. Building LNG storage tanks and trucking in LNG can be a less expensive alternative. A SaskEnergy pilot project currently underway in Aberdeen, SaskatchewanFootnote 32 is an example of this approach. LNG could also be used to convert existing remote distribution networks from propane to natural gas, as FortisBC is planning to do in Revelstoke, B.C.Footnote 33
- Freight trucks with engines designed to run on LNG are currently available. Two large Canadian LNG trucking fleets have been built-up over the past three years Footnote 34. The availability of refueling stations has grown considerably along Canada’s main freight corridors in recent years. However, technological challenges may create hurdles for further adoption. LNG engines are currently less efficient than their diesel counterpartsFootnote 35, eroding the potential fuel-savings of switching to LNG-powered trucks. Currently there is no LNG engine on the market that has the horsepower to carry the maximum loads of Canadian freight trucksFootnote 36.
- LNG can also be used to fuel oil and natural gas drilling and completion activities, especially when local gas resources are abundant. Two small-scale liquefaction plants have recently been commissioned in northeast B.C., a rapidly growing area for natural gas production.
- Several ferry companies in B.C. and Quebec have invested in LNG-fueled technology for existing ferries and have purchased new ferries with LNG capabilities. Ferries travel set routes, usually between two points, and tend to return back to dock every day, making accessing LNG refueling infrastructure relatively straightforward.
- There is considerable uncertainty related to the adoption of LNG as a diesel alternative in Canada. Technological development and the relative prices of natural gas and diesel are two of the largest uncertainties. The projections in EF 2016 assume gradual adoption of LNG in the areas described here. Due to the mentioned uncertainties, it is possible that adoption will be higher or lower than in these projections.
Growth of Solar Photovoltaic Electricity Generation
- In the past decade, global solar generation has grown significantly from a relatively small base. As shown in Figure 2.6, between 2004 and 2014, solar photovoltaic (PV) capacity worldwide increased from less than three gigawatts (GW) to 177 GWFootnote 37 Approximately six per cent of power generated in Italy, Greece and Germany in 2014 came from PV power systemsFootnote 38. In the U.S., 6.2 GW of solar capacity came online in 2014, or 32 per cent of the new electricity generation capacity added, second only to natural gas capacity additionsFootnote 39. A significant portion of solar additions in the U.S. have been in California, which generated more than five per cent of its electricity from large scale, grid-connected solar sources. Other states, including Nevada, Arizona and New Jersey, produced more than one per cent of electricity from solar sourcesFootnote 40. Programs and policies to encourage solar PV installations have played a role in the strong growth in these regions.
Figure 2.6 - Global Installed Photovoltaic Capacity
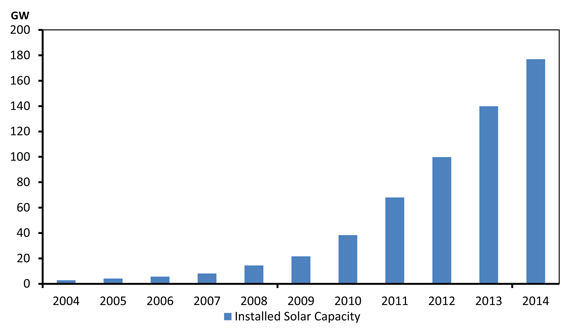
- Solar capacity in Ontario increased from 0.8 GW in 2012 to 1.2 GW in 2013Footnote 41. By the beginning of 2015, Ontario’s solar capacity reached 1.7 GW, or about 4.5 per cent of Ontario’s total installed capacityFootnote 42. In the rest of the country, grid-connected PV capacity is quite small, totaling 10 megawatts (MW) in 2013Footnote 43. Canadian solar capacity remains modest from a global perspective and accounted for only 0.3 per cent of total Canadian electricity production in 2013Footnote 44. Future growth will likely depend on several factors, including local solar potential, costs and incentives, ease of integration with the existing grid, and further technological breakthroughs.
- Solar potential is especially high in arid and semi-arid areas close to the tropicsFootnote 45. Although Canada has a temperate climate, certain prairie cities including Regina, Calgary and Winnipeg have well above average solar potential. In much of Canada solar potential is generally higher than in Germany, which had the most installed solar PV capacity in the world as of 2014. This suggests there could be significant potential for higher adoption of solar in CanadaFootnote 46.
- One of the factors driving the increase in solar generation across the world is the decline in costs supported by technological advances and mass-manufacturing. Prices for solar panels have dropped from C$10.70 per watt in 2000 to C$0.95 per watt in 2013Footnote 47. In several regions of the world solar energy reached "grid-parity" meaning that the cost of PV systems fell to levels that are below the variable, per kilowatt-hour (kW.h) portion of retail electricity prices, making it price-competitive with other fuel sourcesFootnote 48.
- Recent studies indicate that PV generation costs must decrease below retail electricity prices to become competitive without incentivesFootnote 49. The most significant support measures to date are Ontario’s Feed-in-Tariff (FIT) and microFIT programs which allow solar energy producers to sell their electricity to the province at a guaranteed price for a fixed contract termFootnote 50,Footnote 51. In the near term, support programs and their scope may determine the pace of growth of solar generation across Canada.
- Integrating solar generation with existing grids presents both challenges and opportunities. Infrastructure upgrades may be required to maintain grid safety and reliability due to the decentralized nature of solar generation. Electric systems must be able to balance substantial fluctuations in solar electricity production. This can be achieved by using flexible generation sources such as natural gas plants which can quickly increase or decrease generation, or with connections to resources in other electricity jurisdictions. In Canada, hydroelectric plants are well suited for this role. Water can be stored in hydroelectric reservoirs and then used to generate electricity when solar generation is not available. However, displacing affordable hydro power with more expensive solar may not be practical for some utilities.
- In some cases, consumers generating electricity from home solar installations compete with existing generators. This could lead to a decline in utilities’ customer bases and result in higher electricity costs for the remaining customers. While this is not yet an issue in Canada, some jurisdictions and industry groups in the U.S. have expressed concernsFootnote 52. On the other hand, because solar installations often generate electricity during hours of the highest electricity demand, they could help reduce the need for additional generation and transmission facilities. Also, during times of peak demand electricity prices are usually higher, making solar an attractive option for consumers who are charged higher rates during peak periods.
- Further technological breakthroughs could improve the economics of solar generation and facilitate its integration. For example, continued development of utility scale electricity storage options would provide a boost to the solar industry. Currently, Ontario has plans to add 50 MW of electrical storage capacity to its systemFootnote 53.
- Examples from other countries show that solar can play a much bigger role in the electricity mix. Canadian solar capacity is expected to increase but the extent of this growth constitutes a major uncertainty in this report’s electricity assumptions. Growth of solar generation in Ontario has been robust, but growth in other provinces and territories has been slower. Consequently, the extent of solar penetration during the projection period remains highly speculative and will depend, in large part, on future policies and technology advancements.
Other Emerging Technologies
- In many cases, the most impactful technological advancements in energy happened quickly and were largely unexpected even a few years prior to their wide-scale adoption. The effect of recent advancements is evident in the projections in this report.
- A striking example of an abrupt change due to technology is the change in the outlook for natural gas production over the last eight years. In the Energy Futures 2007 Report, total Canadian gas production was expected to steadily decline to 297 106m³/d (10.5 Bcf/d) by 2030Footnote 54. However, despite natural gas price assumptions that are approximately half of those assumed in 2007, production in EF 2016 is projected to be 490 106m³/d (17.3 Bcf/d) by 2030, or 65 per cent higher than in the 2007 Report.
- The dramatic shift in the natural gas production outlook was largely driven by technological advances. Many of these advances were being developed several years before their widespread application. However, the supply and market dynamics at the time were also an important driver of innovation. Relatively high natural gas prices from 2005 to 2008 drove additional investment in technology development. Also, the competitive and adaptive nature of the North American natural gas market encouraged experimentation with new technologies in the field. In many areas of production growth, significant gas processing and pipeline infrastructure from decades of prior natural gas development was already in place, enabling growing production to reach consuming markets easily. In other growth areas, additional infrastructure was required to access markets. The convergence of these factors and technological advancements drove the dramatic shift in the North American natural gas market.
- A wide range of technologies are currently being developed and have the potential to transform the energy system. These include grid-scale electricity storage, various renewable electricity generating technologies, carbon capture and storage (CCS), and alternative fuel vehicles. Many of these innovations have the potential to increase the effectiveness of the others. For example, improvements in electric vehicle battery technology could support improvements in utility energy storage. Energy storage could improve grid-stabilization and buffer peak electricity demands, which could in-turn, support a larger share of renewables in the electricity grid.
- Between today and 2040, it is likely that unexpected developments will occur. This analysis takes a conservative approach to technological change and assumes a continuation of small, incremental improvements in technology and efficiency over the projection period. Speculative technologies are beyond the scope of this analysis.
Unique Regional Energy Dynamics
Changing Energy Mix in Canada’s Territories
Yukon, NWT and Nunavut form a distinct region in Canada in terms of energy use. Remoteness, extreme weather conditions, limited local energy production, sparse population, and limited energy transportation infrastructure together reduce the fuel options for consumers. Most communities in the region rely on imported RPPs, mainly diesel, for their electricity and heating requirements, making their energy costs among the highest in the country. Figure 2.7 demonstrates residential electricity costs in the tTerritories compared to other parts of the country. Heating costs are also generally higher. Heating oil is the most common home heating fuel in the Territories and is generally more expensive than the fuels used in most other jurisdictions in Canada. In addition, colder temperatures in north climates result in greater energy use for heating requirements. In recent years, these high costs have encouraged switching to less expensive alternatives and this could have a lasting impact on the energy mix in Northern communities.
Figure 2.7 - End-Use Electricity Costs, Yukon, NWT, Nunavut, Quebec B.C., Alberta and Ontario

- Another unique aspect of the territories is that mining activity is a primary driver of energy demand and the economy. As a result, the commissioning or closure of a mine can substantially affect energy consumption and fuel mix in the region. This can result in volatile energy demand projections compared to the more stable outlooks of the ten provinces.
- Limited energy production and an absence of pipelines to transport oil and natural gas into the territories require energy imports via truck or barge. While Yukon is fairly well connected by three highways, access around much of the NWT is limited and Nunavut does not have a highway connecting it to the rest of Canada. Barge shipments of RPPs are required to meet the energy needs of the remote communities in Nunavut and the NWT. Due to these limitations, 69 per cent of the energy consumed in the territories in 2013 was RPPs, compared to 31 per cent for the rest of Canada.
- In Inuvik, the nearby gas field has been exhausted. In order for Inuvik to use their existing natural gas infrastructure for heating purposes, they have started importing propane, which is a cheaper alternative, via truck and mixing it with air to produce synthetic natural gasFootnote 55.
- Biomass is becoming an attractive alternative for heating in the form of wood pellets, especially in the NWT, where it is cost-competitive with alternative heating fuelsFootnote 56. The total installed capacity of registered wood-pellet boilers in the NWT has increased by 35 per cent per year since 2006Footnote 57. Adding to this momentum is the potential for both producing biomass in the NWT from forest fire debris and the potential to expand biomass use for community district heating systems.
- Rising fuel costs have made LNG a competitive alternative for electricity generation in Yukon and NWT. Northwest Territories Power Corporation has been trucking LNG into Inuvik from Delta, B.C. for this purpose since late 2013Footnote 58. This success has led to feasibility studies for using trucked LNG to fuel generation in other communities in NWT. Yukon Electrical Company started trucking LNG to Whitehorse in 2015 so that it can power a dual-fuel generator with LNG when conditions are appropriateFootnote 59. The cost of LNG could decrease with the commissioning of closer liquefaction plants in Elmworth, Alberta, and Dawson Creek, B.C. LNG is also being considered for powering remote mines throughout the territories.
- The projections in EF 2016 assume continuation of these trends at a gradual pace, with steady growth in the use of biomass and LNG in the region.
The Nova Scotia and New Brunswick Natural Gas Market
- The provinces of Nova Scotia and New Brunswick, along with the New England states of Maine and New Hampshire form a distinct natural gas market.
- Natural gas prices in the region are higher and more volatile than in the rest of Canada, particularly in winter months when demand increases. For example, between December 2014 and March 2015, natural gas spot prices at the regional trading hub at Dracut, Massachusetts, averaged US$11.16 per million British thermal units (MMBtu). In comparison, natural gas averaged about US$2.37/MMBtu in Alberta, and US$3.69/MMBtu at the Dawn trading hub in Ontario during the same period. Limited regional natural gas production and pipeline bottlenecks in the U.S. Northeast are the primary reasons for this.
- Natural gas consumption in the region is driven mainly by electricity generation and industrial uses such as pulp and paper and oil refining. A small amount of natural gas is also used in the commercial and residential sectors for heating purposes. In 2013, 66.8 PJ of natural gas was consumed in the Nova Scotia and New Brunswick, or 4 914 10³m³/d (173 MMcf/d).
- Production from the region’s two offshore natural gas facilities is expected to decline due to technical issues and resource constraints. At the Sable Offshore Energy Project (SOEP), production has been in steady decline in recent years, averaging 4 097 10³m³/d (145 MMcf/d) in 2014. Production from SOEP averaged 9 038 10³m³/d (319 MMcf/d) in 2010Footnote 60. Production from SOEP averaged 9 038 10³m³/d (319 MMcf/d) in 2010.
- Production at the Deep Panuke offshore project started in August 2013 and production averaged 5 742 10³m³/d (203 MMcf/d) in 2014Footnote 61. In early 2015, Deep Panuke began producing higher than expected amounts of water and the facility operator, Encana, recently announced that it would produce only in winter months when prices are typically higherFootnote 62. Production from the facility has been shut-in since June 2015.
- Along with declining domestic production, the region faces difficulty accessing imports of natural gas from supply sources in the Northeast U.S. because of pipeline bottlenecks downstream of the region.
- Figure 2.8 shows the pipeline infrastructure in the region. The main pipeline supplying the market is the Maritimes & Northeast Pipeline (M&NP). M&NP extends from Goldboro, Nova Scotia, through New Brunswick to the Canada-U.S. border where it connects to the US portion of M&NP. At the border, M&NP also connects with the Emera Brunswick Pipeline, which transports natural gas from the Canaport LNG import terminal located in Saint John, New Brunswick. In the US, M&NP continues through Maine and New Hampshire into Massachusetts. The U.S. portion of M&NP interconnects with several other pipelines.
Figure 2.8 - Pipeline Infrastructure in Nova Scotia, New Brunswick, and New England Natural Gas Market
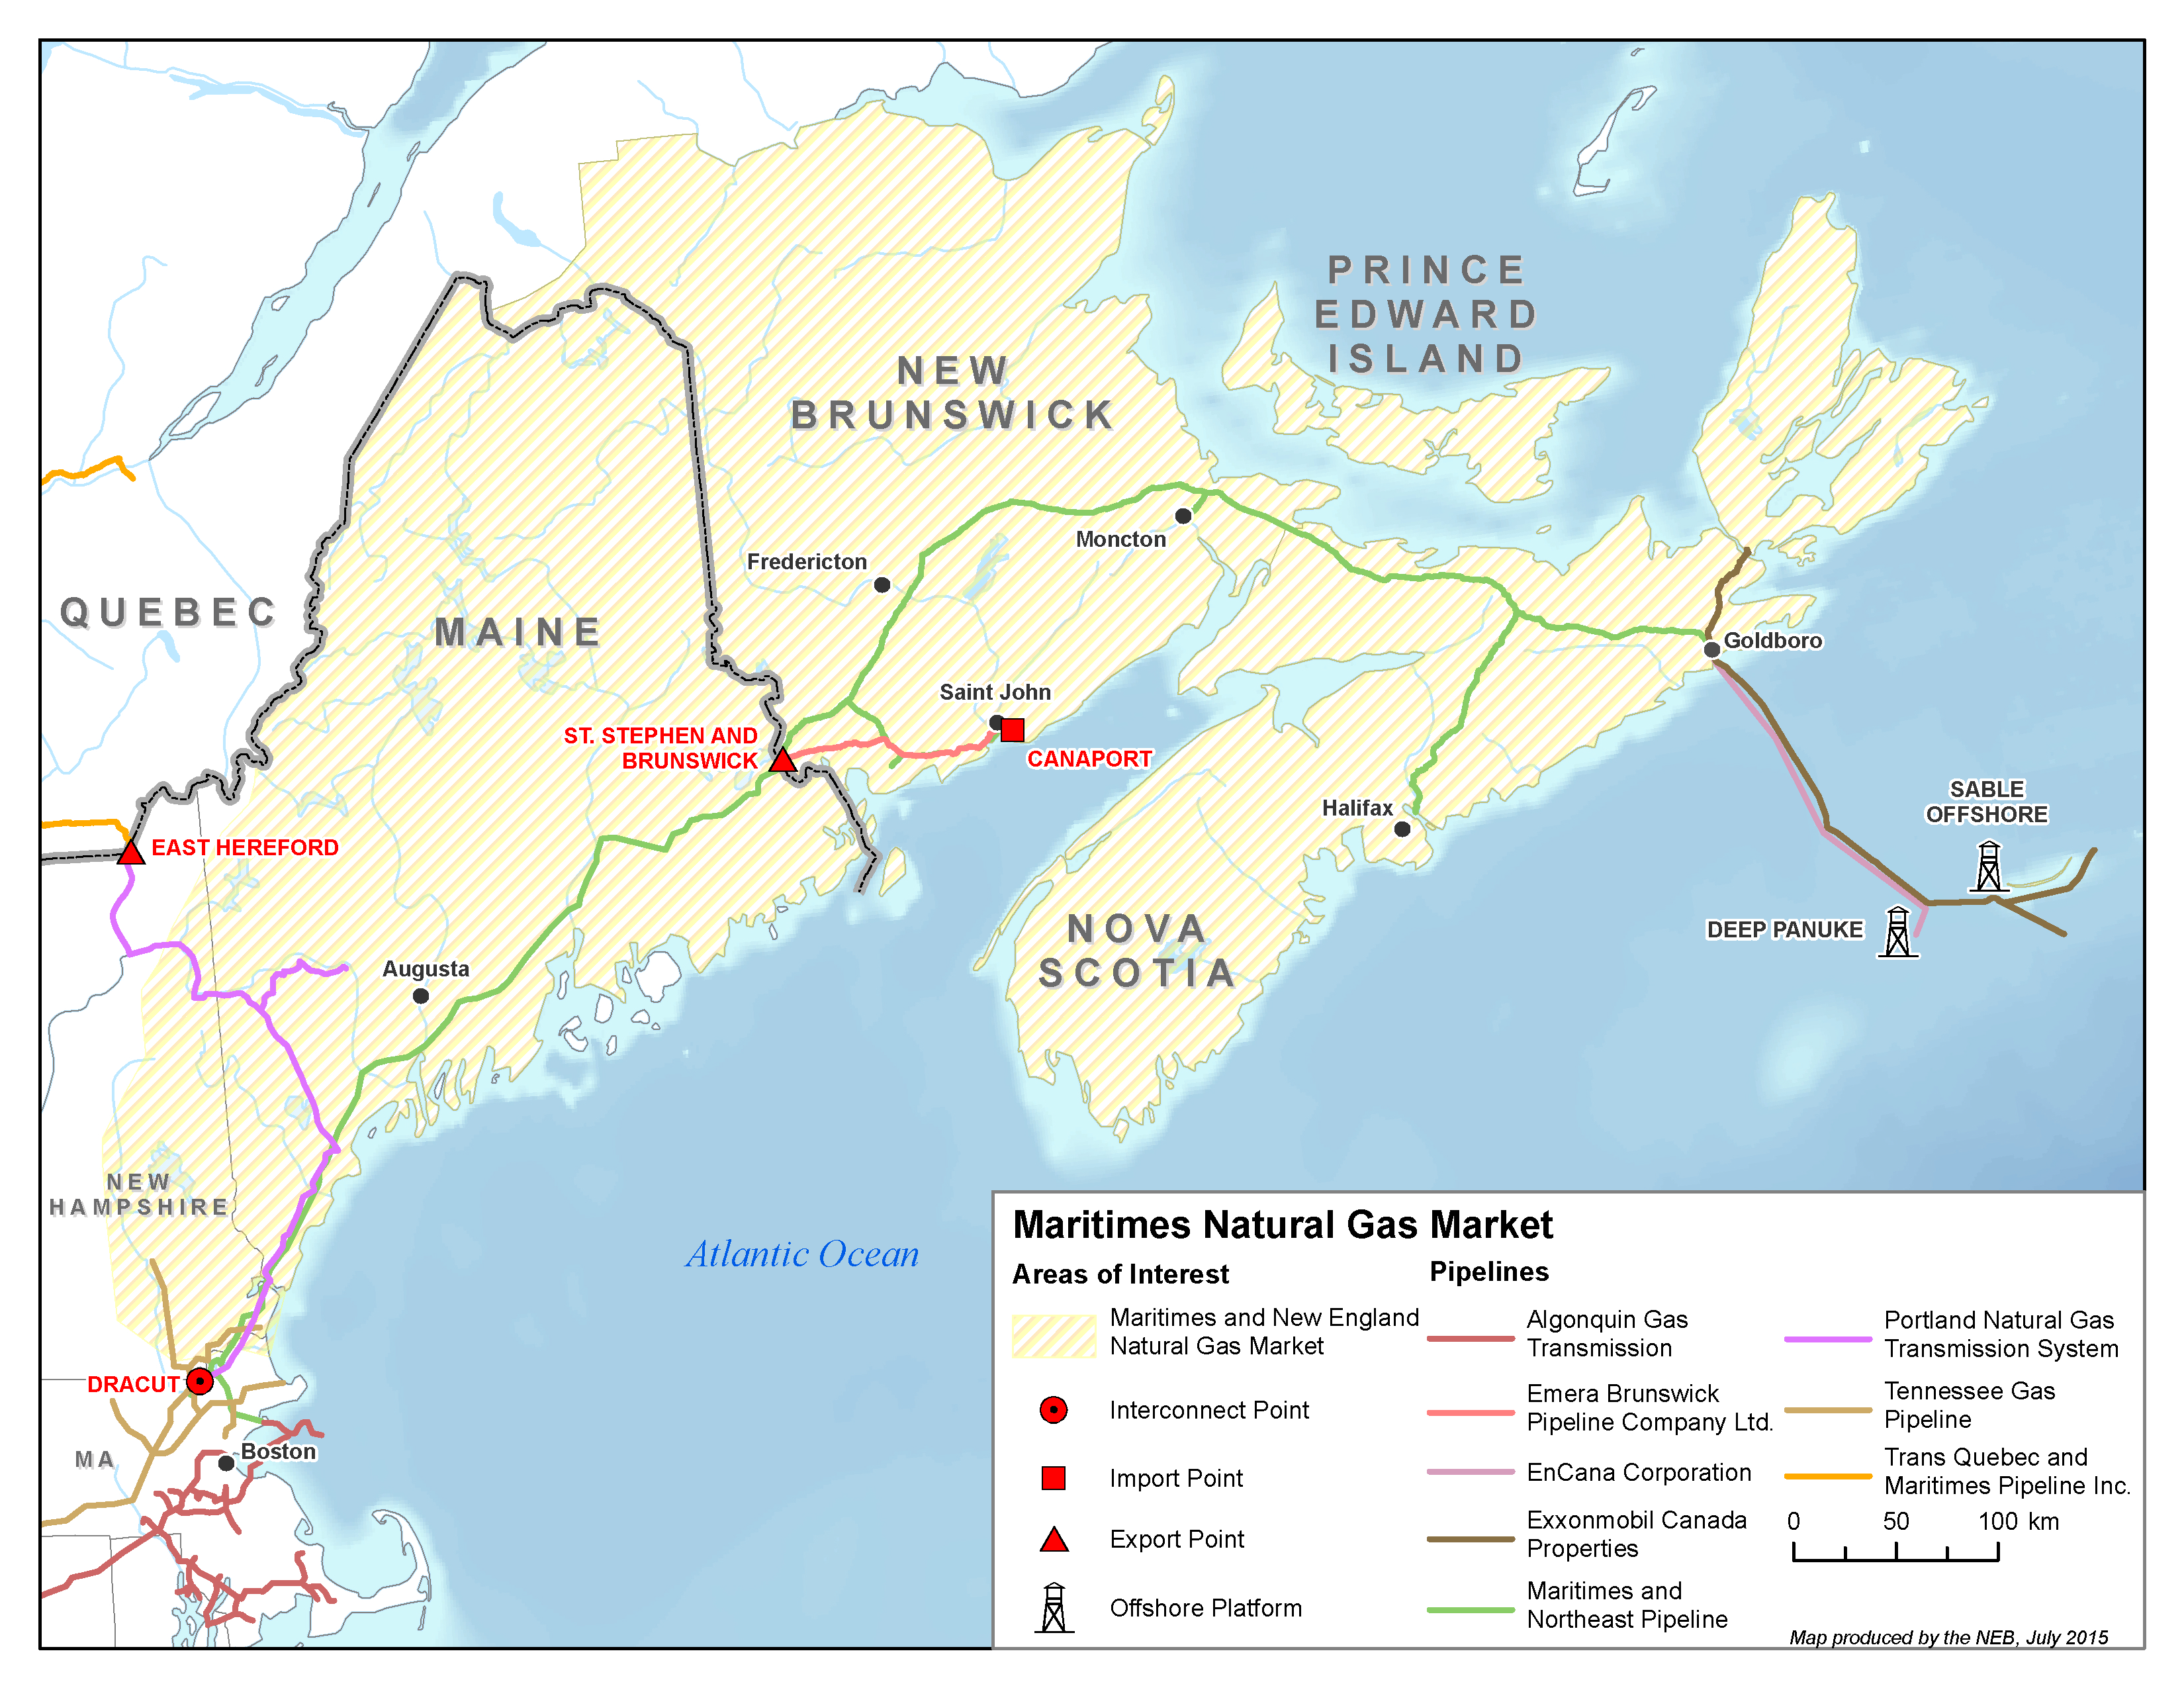
- M&NP can be used to import in addition to its primary role to export natural gas. While most of the time natural gas flows from Canada to the U.S., natural gas supplied from the Canaport terminal or from the U.S. will flow northbound during periods of high demand or when there are offshore production outages in Nova Scotia. This supply, however, is limited by the capacity on interconnecting pipelines in the U.S. and the relatively high cost of LNG imports to the Canaport terminal.
- In order to increase supply availability to the region, several pipeline expansions and de-bottlenecking initiatives are currently under development in the U.S. and are in the early stages of regulatory review. Proposed project in-service dates are scheduled for 2017 and 2018.
- Whether these de-bottlenecking and expansion projects will be approved by regulators and built, and the extent to which these changes would affect this region’s natural gas market is uncertain. Given this uncertainty, the end-use natural gas price projections for Nova Scotia and New Brunswick in this report assume that the historic price difference between the market and Henry Hub will remain constant in the projection. If access to natural gas increases and natural gas prices in the region become more closely linked to North American prices, the use of natural gas as a fuel in New Brunswick and Nova Scotia may be higher than in this analysis.
Quebec and California Emissions Trading
- In November 2009, the Government of Quebec adopted a new provincial target of reducing emissions 20 per cent below 1990 levels by 2020, and noted that achieving this goal would depend on the introduction of a GHG cap-and-trade systemFootnote 63. To help develop this system, Quebec became a partner in the Western Climate Initiative (WCI), a non-profit corporation formed to support the development of greenhouse gas emission trading programsFootnote 64.
- The cap-and-trade program developed by the WCI regulates emissions of CO2 and six other GHGs. California also participates in the WCI and permit auctions are jointly held by Quebec and California.
- In general, a cap-and-trade system sets a cap on the maximum allowable GHG emissions for a jurisdiction and then sets the number of permits available equal to this level. Market participants must hold permits equal to the amount of GHGs they will emit over a given period. This cap is typically lowered over time. The amount a market participant is willing to pay for a permit will be proportional to how costly it is for them to reduce their GHG emissions. Through trading between many participants, market forces act to determine an economy-wide price for GHGs. The benefit of such a system is those that can reduce their emissions at a cost that is lower than the permit price will choose to do so. Those for whom it is more expensive to reduce emissions will prefer to purchase a permit, meaning GHG reductions are achieved in an economically efficient manner.
- Emission units are auctioned off by the Quebec government four times a year. A minimum price of C$10.75 per tonne of GHG emissions was set for 2013 and is scheduled to increase at a rate of five per cent, plus inflation, annually until 2020. At the same time, the emissions cap is scheduled to decline steadily by approximately three to four per cent annually. In the February 2015 joint California-Quebec auction, permits were sold at a price of approximately US$12 (C$15)Footnote 65. This was the highest price since the commencement of the program.
- The future cost of Quebec emission permits is an important uncertainty for Quebec energy use and the projections in this report. EF 2016 follows analysis by the WCI which suggests the prices will rise from an average of C$15 per tonne of GHG emissions in 2015 to C$55 per tonne by 2020, and assumes they will grow at the rate of inflation for the remainder of the projectionFootnote 66.
- In 2015, Ontario announced plans to create a cap-and-trade system for greenhouse gas emissions that will be linked with the Quebec and California systemFootnote 67. Details are currently limited on the Ontario plan and EF 2016 does not include a cap-and-trade program for Ontario.
Chapter 3. Key Drivers
- EF 2016 considers six cases: a Reference Case, which reflects a baseline view of future energy prices and economic growth, two price sensitivity cases and three supplemental sensitivity cases. These sensitivity cases represent a range of uncertainties and possible outcomes for the Canadian energy system. Higher and lower crude oil and natural gas prices characterize the price sensitivity cases, referred to as the High Price and Low Price cases. The supplemental sensitivity cases, the Constrained and the High LNG and No LNG cases, are discussed in Chapter 10 and Chapter 11, respectively.
Energy Prices
Crude Oil Prices
- The Brent crude oil price is a key global benchmark price for crude oil. In the Reference Case, the Brent price averages US$56/bbl in 2015. As shown in Figure 3.1, the price in 2015 dollars steadily increases to roughly US$80/bbl by 2020. After 2020, the price increases more gradually, reaching US$107/bbl by 2040. As discussed in Chapter 2, recent growth in tight and shale oil production in North America has increased global supply and crude oil prices have dropped significantly since mid-2014. Continued growth in global oil demand and the need to access higher cost sources of oil supply results in moderate price growth over the projection period. In the Reference Case, the WTI oil price, a benchmark for U.S. crude oil prices, is approximately US$5/bbl less than the Brent price throughout the projection period. The Western Canadian Select (WCS) price, the benchmark for heavy crude oil prices in Western Canada, averages US$17/bbl less than the WTI price.
Figure 3.1 - Brent Crude Oil Price, Reference, High and Low Price Cases
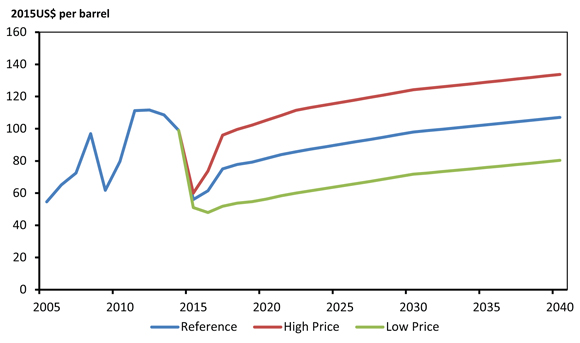
- In the Low Price Case, the Brent crude oil price averages US$26/bbl below the Reference Case price throughout the projection period, reaching US$80/bbl in 2040. In the High Price Case, the Brent price averages US$26/bbl higher than the Reference Case price, rising to US$134/bbl by 2040.
Natural Gas Prices
- The Reference Case assumes that the Henry Hub price for natural gas increases from US$2.90/MMBtu in 2015 to US$4.55/MMBtu in 2040 in 2015 dollars as shown in Figure 3.2. Steady demand growth in North America results in a gradual increase in natural gas prices over the projection period.
Figure 3.2 - Henry Hub Natural Gas Price at Louisiana, Reference, High and Low Price Cases
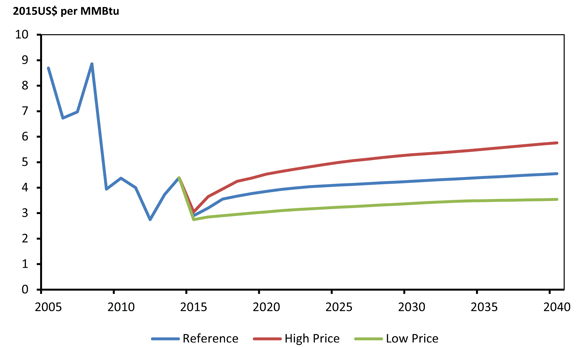
- In the Low Price Case, the natural gas price reaches US$3.55/MMBtu by 2040, and in the High Price Case, it reaches US$5.75/MMBtu.
Economy
- The economy is a key driver of the energy system. Economic growth, industrial output, inflation, exchange rates, and population growth are key macroeconomic factors that influence the energy supply and demand outlook.
- As shown in Figure 3.3, Canadian real gross domestic product (GDP) growth averages 1.7 per cent per year from 2014 to 2040. In the first five years of the projection, economic growth averages 1.8 per cent per year before slowing somewhat over the long term, averaging 1.6 per cent per year from 2020 to 2040. This is slower growth compared to the historical trend; annual real GDP growth averaged 2.4 per cent from 1990 to 2013.
Figure 3.3 - Annual GDP Growth, Reference Case
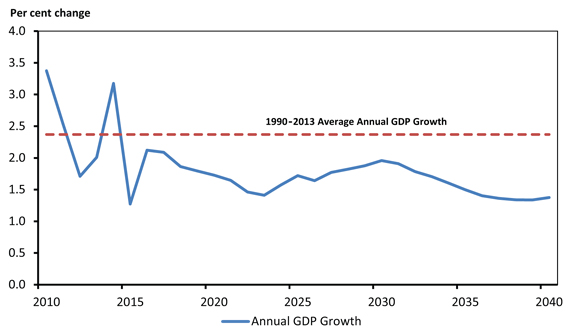
- Demographics play a key role in the long-term macroeconomic projections. Canadians born between 1946 and 1965, referred to as "baby boomers", represent a large segment of the current workforce. The oldest baby boomers have begun to retire and this segment of the population will continue to move into retirement over the next 20 years. Therefore, the working age proportion of the population shrinks over the projection, creating slower labour force growth compared to the historical trend. This is a key factor moderating economic growth.
- The U.S. is Canada’s largest trading partner and the economic performance of the U.S. is an important determinant of Canadian economic growth. In the Reference Case, U.S. GDP growth averages 2.4 per cent from 2014 to 2040. The exchange rate is relatively stable in the Reference Case at roughly 0.80 US$/C$ from 2014 to 2040.
- In recent years, developing nations such as China and India have grown rapidly compared to developed nations. These markets are a growing source of demand for Canadian products. Economic growth in these countries is showing signs of slowing compared to recent history but long-term growth prospects for these regions remains relatively strong over the projection period and is a key driver of growth in Canada’s export-oriented sectors.
- Regionally, economic growth in the Reference Case is strongest in B.C., averaging 2.0 per cent per year from 2014 to 2040. The investment associated with the LNG exports assumed in the Reference Case, combined with strong growth in natural gas production, results in above average economic activity. At 1.7 per cent per year from 2014 to 2040, economic growth is also relatively strong in Alberta. Oil sands production growth is slower than projected in previous Energy Futures outlooks due to lower price assumptions but remains a key driver of growth in the province. Combined, Quebec and Ontario’s annual GDP growth also averages 1.7 per cent over the projection period. Growth is slowest in Atlantic Canada because of slower population growth and declining offshore oil and natural gas production in the long term.
- Total real GDP in the High Price Case is 2.1 per cent higher than in the Reference Case by 2040. Higher oil and natural gas production results in faster economic growth in western Canada while higher fuel input costs have a small impact on economies that have large energy intensive manufacturing sectors. In the Low Price Case, real GDP is 2.7 per cent lower than the Reference case by 2040.
Key Uncertainties to the Outlook
- Energy prices are a key uncertainty to the projections. The High and Low Price cases capture some of this uncertainty. However, prices could be outside the chosen range, or swing dramatically in the short term.
- Economic conditions significantly affect the Canadian energy system. Several key uncertainties could impact the economic drivers and hence the energy supply and demand projections described in EF 2016.
- International demand for Canadian goods, the manufacturing of which can be energy intensive, will influence export-oriented industries. Faster or slower economic growth in the U.S., Canada’s largest trading partner, would affect the economic and energy demand projections. The sustainability of rapid economic growth in many emerging markets is also a key uncertainty of the projections.
- Large projects in the mining, oil and natural gas, and electricity sectors contribute to the macroeconomic projections in a number of provinces. The pace of these developments is uncertain and could contribute to higher or lower economic growth.
- The uncertainty related to the development of an LNG export industry, or the construction of additional oil export infrastructure, could affect the Canadian economy and hence the energy supply and demand projections. The Constrained Case and the High LNG and No LNG cases capture some of this potential uncertainty and are addressed in Chapter 10 and Chapter 11, respectively.
Chapter 4. Energy Demand Outlook
- In this analysis, end-use, or secondary energy demand includes energy used in Canada in four sectors: residential, commercial, industrial and transportation. It excludes the energy used to generate electricity, which is included under primary demand. The majority of this chapter focuses on end-use consumption by sector, with a brief section on primary demand at the end. Chapter 8 includes further details on electricity generation and the fuel mix in that sector.
- End-use demand includes non-energy use and producer consumption. Non-energy use is the use of energy commodities for a purpose other than fuel. Examples of this include energy commodities used as petrochemical feedstock, lubricants and asphalt. Producer consumption accounts for the energy consumed by energy producers for their activity. For example, this would include the combustion of natural gas by natural gas producers to operate compressors and processing equipment.
- In the Reference Case, total end-use energy demand increases but at a slower rate than in historical trends. Figure 4.1 shows that energy use increased by 1.3 per cent per year from 1990 to 2013. From 2014 to 2040 energy use increases by nearly half the historical pace, at 0.7 per cent per year.
Figure 4.1 - Historical and Projected Growth in End-Use Energy Demand by Sector, Reference Case
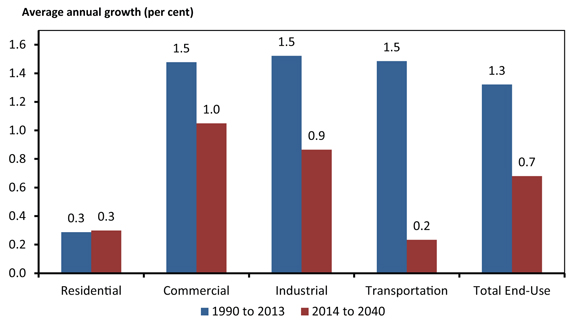
- Figure 4.2 shows that the industrial sector is the main driver of overall growth due to its larger share of total demand. Figure 4.2 also highlights the impact of the global economic downturn in 2009 on energy demand in Canada, decreasing end-use demand in 2009 to 10 510 PJ, its lowest level since 2002. End-use demand was 11 407 petajoules (PJ) in 2013 and marked the first year that Canada reached its pre-recession high of 11 112 PJ set in 2007.
Figure 4.2 - End-Use Demand by Sector, Reference Case
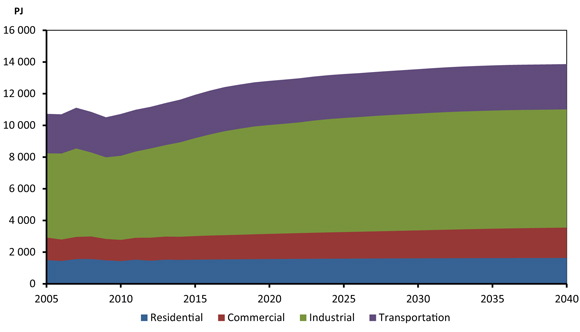
- Total energy intensity, measured as energy use per unit of economic activity, decreases by an average annual rate of 1.0 per cent over the projection period. This continues along the historical trend of declining energy intensity, although at a slightly more moderate pace. Energy intensity declined by an average of 1.1 per cent per year from 1990 to 2012. Energy intensity is influenced by a variety of factors, including improvements in energy efficiency.
- Energy demand grows slightly faster in the High Price Case, with an average annual rate of 0.8 per cent per year over the projection period. Generally, higher prices decrease energy demand growth as energy is more expensive for consumers. However, this effect is more than offset by higher demand in the oil and natural gas sector. The Low Price Case demand projection is lower than the Reference Case, with growth averaging 0.6 per cent per year. The increased demand growth resulting from lower prices is more than offset by lower activity in the energy industry. Energy use in the energy sector is driven by the production projections discussed in Chapter 5 and Chapter 6. Energy use in the Constrained Case and the High LNG and No LNG Cases are discussed in Chapter 10 and Chapter 11.
- The majority of Canada’s GHG emissions are related to the use of energy, including energy used for the production of energy, so the energy-use projections in this chapter will drive Canada’s GHG emissions trends, which are discussed in Chapter 12.
Energy Consumption by Sector
Residential and Commercial Sectors
- Residential energy use is the energy consumed by Canadian households. This includes energy used for space and water heating, air conditioning, lighting, large appliances, and other energy-using devices like televisions and computers.
- The commercial sector is a broad category that includes offices, stores, warehouses, government and institutional buildings, utilities, communications, and other service industries. It also includes energy consumed by street lighting and pipelines. Buildings use energy for space and water heating, air conditioning, lighting, appliances and other devices. Pipelines use energy to power pumps or compressors that move oil and natural gas through pipelines.
- Residential and commercial demand is volatile because the demand for space heating and cooling is influenced by the weather.
- In 2013, residential energy demand was 1 526 PJ and accounted for 13 per cent of total Canadian energy demand. In the Reference Case, residential energy demand increases at an average of 0.3 per cent per year over the projection period, reaching 1 635 PJ by 2040.
- Energy use per square metre of residential floor space declines at an annual average rate of 0.6 per cent over the projection period. Improvements in building shell construction practices, increased penetration of high efficiency heating appliances, substantial energy efficiency improvements in major home appliances and electronics, and new standards for lighting and water heating are key factors in this trend. Many of these efficiencies are driven by provincial and federal demand management strategies, which encourage greater energy efficiency in new homes and appliances.
- In 2013 Canadian commercial energy demand was 1 457 PJ and accounted for 13 per cent of total Canadian energy demand. Commercial energy demand increases at an average of 0.7 per cent per year over the projection period, reaching 1 914 PJ in 2040 in the Reference Case.
- Energy useFootnote c per square metre of commercial floor space declines at an annual average rate of 0.9 per cent over the projection period. Improvements to building efficiency are driven by 2011 updates to the National Energy Code of Canada for Buildings, which sets minimum performance standards for building shell, heating, cooling and ventilation, lighting and electrical loads for new buildings and certain renovated ones. These standards are guidelines for regulatory authorities in provinces and municipalities to target with their own separate building codes.
- The types of energy used in the residential and commercial sectors vary across Canada. Energy prices, energy requirements, and regional fuel availability determine the differences in energy mix between regions. Atlantic Canada primarily meets its energy needs with electricity, oil and biomass. Quebec, Manitoba and B.C. rely more on electricity, given their relatively low-cost hydroelectric supply. Alberta and Saskatchewan rely on natural gas more heavily. The Ontario mix is composed mainly of natural gas and electricity, along with a moderate share of biomass and oil. The territories and northern regions of several provinces generally use RPPs due to their isolation from other markets and lack of domestic supply options, although the share of biomass has grown rapidly in recent years as discussed in Chapter 2.
Industrial Sector
- The industrial sector includes manufacturing, forestry, fisheries, agriculture, construction, mining, and oil and natural gas extraction. In 2013, 81 per cent of industrial energy was consumed by a number of energy-intensive industries such as iron and steel, aluminum, cement, chemicals and fertilizers, pulp and paper, petroleum refining, mining, and oil and natural gas extraction.
- The industrial sector makes up the largest share of Canadian end-use energy demand, accounting for 51 per cent, or 5 770 PJ in 2013. As shown in Figure 4.3, it increases to 7 461 PJ in 2040, at an average annual rate of 0.9 per cent per year.
Figure 4.3 - Industrial Energy Demand by Fuel, Reference Case
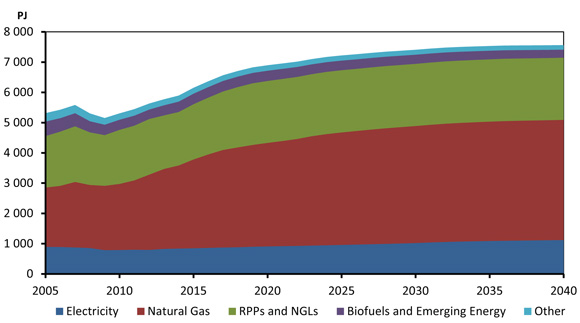
- The Canadian industrial demand projection is driven by the economic growth projections discussed in Chapter 3, as well as the projections of oil and natural gas production. Key trends that shape industrial demand projections in the Reference Case include rising natural gas production in western Canada due to LNG exports starting in the next decade, strong in situ oil sands growth, and modest manufacturing growth.
- Figure 4.4 compares the oil and natural gas sector’s energy demands to the rest of industrial energy demand. Demand in the oil and natural gas sector outpaces growth in the rest of the industrial sector in the Reference Case, increasing by 1 098 PJ over the projection period. Much of this is driven by increases in natural gas consumption in the oil sands, and demand associated with natural gas production, particularly in B.C.
- Figure 4.4 also shows that demand in the oil and natural gas sector is quite responsive to the alternate price cases. Demand in that sector is driven by the production trends described in Chapter 5 and Chapter 6, which are significantly higher in the High Price Case and lower in the Low Price Case for both oil and natural gas production. Energy use in the other industrial sectors is less responsive to the differences in oil and natural gas price, and is higher in the Low Price Case and lower in the High Price Case. Higher prices in the High Price Case put downward pressure on demand, while lower prices in the Low Price Case lead to higher levels of energy use.
Figure 4.4 - Oil and Natural Gas Sector and Other Industrial Energy Demand, Reference, High and Low Price Cases
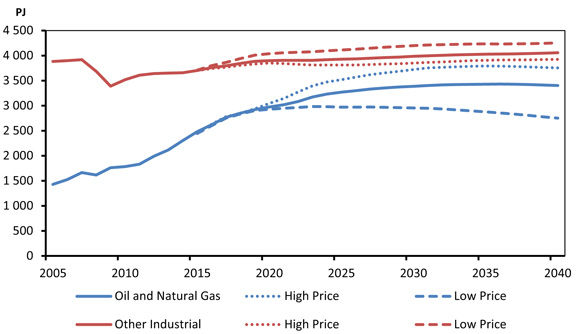
- Various federal, provincial, and utility programs and emission reduction regulations focus on the industrial sector. These programs promote energy efficient devices and equipment such as boilers or motors. They also encourage operational improvements, equipment maintenance and employee training for energy efficiency and conservation. British ColumbiaFootnote 68, QuebecFootnote 69, and AlbertaFootnote 70 have carbon pricing mechanisms, which also influence energy use in the industrial sector.
Transportation Sector
- The transportation sector includes passenger and freight on-road transportation, as well as air, rail, marine, and non-industrial off-road travel, such as recreational all-terrain vehicles and snowmobiles.Footnote d
- Figure 4.5 shows that the transportation sector demand was 2 653 PJ in 2013, 23 per cent of total demand, and grows over the Reference Case projection to 2 858 PJ in 2040.
- Energy efficiency increases in both the passenger and freight sectors over the projection period. Federal emission standardsFootnote 71,Footnote 72, for both sectors are important drivers of improving fuel efficiency.
- Demand growth is faster in the freight sector compared to the passenger sector as shown in Figure 4.5. Freight transportation energy use surpasses total passenger energy use in 2018.
Figure 4.5 - Transportation Energy Demand by Travel Type, Reference Case
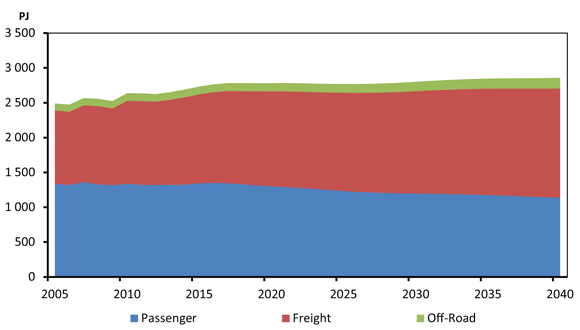
- Passenger energy demand declines over the projection period, largely due to increasing fuel economy associated with Canada’s Passenger Automobile and Light Truck Greenhouse Gas Emission Regulations. As passenger travel uses the majority of gasoline in the transportation sector, this leads to a decrease in the fuel share of gasoline demand as shown in Figure 4.6.
- Freight demand is driven by growth in the goods-producing industries and increases at a slower rate than it did from 1990 to 2013. This is from fuel economy gains, associated with Canada’s Heavy Duty Vehicle and Engine Greenhouse Gas Emission Regulations, and somewhat slower economic growth over the projection period. The increase in freight share leads to an increase in the fuel share of diesel.
Figure 4.6 - Transportation Energy Fuel Share of Demand, Reference Case(a)
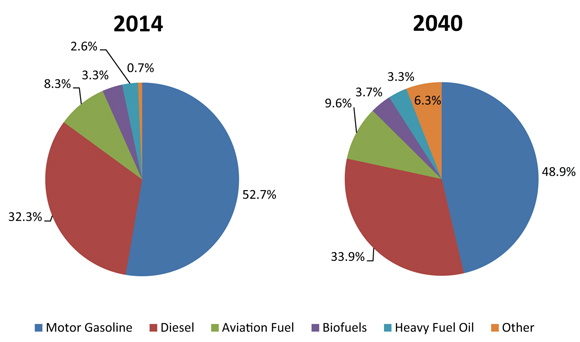
(a) Heavy fuel oil is used in marine and rail transportation. Biofuels include ethanol and biodiesel blended with petroleum products. Other includes natural gas, electricity, lubricants and propane.
- Interest in electrical vehicles and plug-in hybrid vehicles continues to grow and several provinces have programs and policies in place to support their growth, including rebates and pilot projects. The Reference Case assumes a moderate penetration of electric and plug-in hybrid vehicles in the passenger sector. In 2040, they use approximately seven PJ of electricity, or just over two terrawatt-hours (TW.h).
- Natural gas use in the transportation sector is another emerging trend. Natural gas vehicles (NGVs) use either compressed natural gas or LNG. In the longer term, the projections include a moderate penetration of NGVs in both forms. The outlook also accounts for the recent adoption of LNG use by ferries, and assumes moderate levels of LNG adoption by marine tankers and rail locomotives. In the Reference Case, freight natural gas use reaches 151 PJ in 2040, representing 10 per cent of total freight demand.
Primary Demand
- Primary demand is the total energy used in Canada. In addition to end-use demand, it includes the energy required to generate electricity.
- Primary demand is calculated by adding the energy used to generate electricity (including fossil fuels, hydro, nuclear, and renewable) to total end-use (or secondary) demand, and then subtracting the end-use demand for electricity. Removing end-use electricity demand from the total avoids double counting.
- Primary demand increases at an average annual rate of 0.7 per cent over the projection period. As shown in Figure 4.7, the fastest growing fuel is natural gas, which increases its share of overall primary demand from nearly 29 per cent in 2014 to 44 per cent in 2040. The share of coal and nuclear declines over the projection period, driven by the electricity projections discussed in Chapter 8. The share of other renewable fuels decreases slightly, as growth in wind and other non-hydro renewable electric generation is offset by limited growth in biomass consumption in manufacturing.
Figure 4.7 - Share of Fuel in Primary Energy Demand, Reference Case
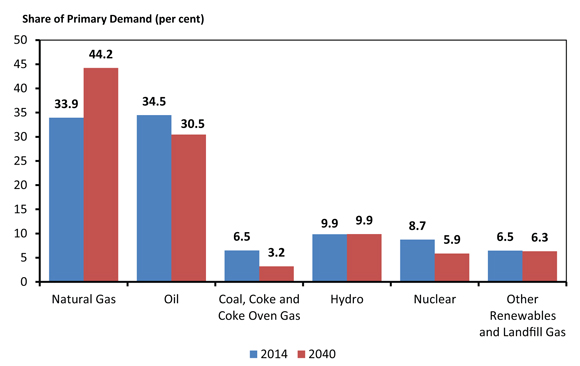
- In addition to being used heavily in the residential, commercial, and industrial sectors, natural gas is also used for electricity generation. Figure 4.8 shows primary demand for natural gas, which increases almost 2 500 PJ over the projection periodFootnote e. A significant contributor to this growth is power generation, which increases to over 1 300 PJ by 2040.
Figure 4.8 - Primary Natural Gas Demand, Reference Case
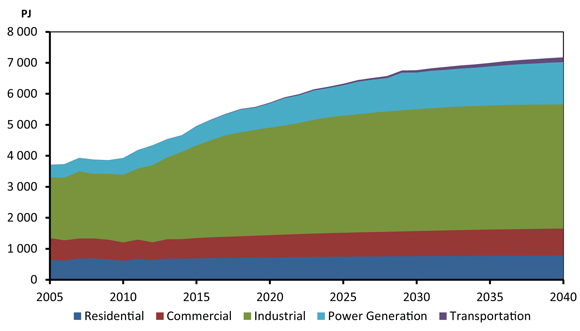
Key Uncertainties to the Outlook
- Policies, programs, and regulations are continually under development at federal, provincial, territorial, and municipal levels. These may have significant implications for energy demand growth. For example, Ontario and Manitoba have recently announced that they will join Quebec and California’s carbon market, and in the fall of 2015 an advisory panel to the Alberta government released a broad suite of climate policy recommendationsFootnote 73. In late 2015, the Paris Climate Conference culminated in an ambitious new global climate agreement which will have significant implications for Canadian and global energy use trends. Policies and programs that may result from various recent provincial announcements and the Paris Agreement are not included in the analysis in EF 2016.
- In recent years, the oil and natural gas industry has undergone rapid transformations in both the types of resources extracted and the technologies used to extract them. Depending on the future development of these resources and technologies, the energy used in this sector may be higher or lower than these projections. The most notable example of this would be the trend of the SOR for in situ oil sands development, which will have a substantial effect on future natural gas demand in AlbertaFootnote 74. As the oil and natural gas sector is a large growth area for energy demand, key uncertainties for the oil and natural gas production outlooks, as described in Chapter 5 and Chapter 6, will also be uncertainties for the energy demand projections.
- The mining sector introduces significant uncertainty to the energy demand projections. The development of a variety of announced projects is uncertain due to current low prices for various minerals. Energy requirements for mines also vary on a project-by-project basis creating additional uncertainties, particularly for electricity demand in regions where mining is a significant portion of economic activity.
- The Reference Case includes a modest penetration of several emerging technologies, such as electric vehicles and NGVs in transportation, LNG in marine tankers, ferries and rail locomotives, geothermal space heating, and solar hot water heating. Adoption of such technologies beyond the levels included in the Reference Case may change Canada’s future energy mix and growth.
- Changing demographic and consumer preferences might be an important factor in future energy demand trends. For example, driving patterns of younger Canadians appear to be different than previous generations, with a smaller proportion of young drivers obtaining their licences and those that do drive, driving lessFootnote 75.
Chapter 5. Crude Oil Outlook
Content
Crude Oil and Bitumen Resources
- Canada has abundant resources of crude oil, with an estimated remaining ultimate potential of 52.4 109m³ (330 billion barrels) as of December 2014, 90 per cent of which are bitumen resources located in the oil sands of Alberta. Ten per cent is attributed to traditional or "conventional" oil reservoirs, located across Canada, but dominated by resources in the Western Canada Sedimentary Basin (WCSB) and the East Coast offshore.
- Resources become reserves after producers demonstrate that economic recovery of the resources can be achieved. Canada has a remaining oil reserve of 27.1 109m³ (171 billion barrels) as of December 2014 as shown in Table 5.1. Of this volume, 97 per cent is in the oil sands. At current production levels, Canada has enough remaining reserves of oil to last 120 years.
- There is still considerable potential to add to Canada’s crude bitumen reserves. The Grosmont and Leduc Carbonates, and the Grand Rapids and Wabiskaw Sandstones combined, account for over 30 per cent of Alberta’s oil sands resources which, if economic viability is demonstrated, would mark a significant increase in reserves.
- Horizontal drilling and multi-stage hydraulic fracturing has increased access to previously low-producing or unproductive oil reservoirs in the WCSB. This technology could potentially be used in other regions of Canada. These advancements have allowed operators to increase available reserves and add to known resources in Canada. Recent assessments of resources in the MontneyFootnote 76, BakkenFootnote 77, and Canol/BluefishFootnote 78 plays located in the WCSB have helped to better understand the extent of, and resource volumes for, tight oil in Canada.
- Additions to crude oil reserves in conventional oil reservoirs can also be achieved through enhanced oil recovery techniques. Common methods include water, polymer or CO2 flooding, and thermal methods such as the application of SAGD to conventional heavy oil reservoirs. Several projects in western Canada, existing and proposed, are designed to capture CO2 from large emitters and distribute it to oil pools to enhance oil recovery. Two such projects are in operation in Saskatchewan, and additional projects in Saskatchewan and Alberta are in the planning stages.
Table 5.1 - Remaining Ultimate Potential and Established Crude Oil Reserves, as of December 31, 2014
| WCSBNote a | Eastern Canada | Northern Canada Note b,Note c | Other | Oil Sands | Canada Total | |
|---|---|---|---|---|---|---|
| Remaining Ultimate Potential | ||||||
| 106m³ | 1 219 | 489 | 1 615 | 197 | 48 339 | 51 859 |
| Billion Barrels | 7.7 | 3.1 | 10.2 | 1.2 | 304.0 | 326.2 |
| Remaining Established ReservesNote d | ||||||
| 106m³ | 486 | 223 | 8 | 0.0 | 26 431 | 27 149 |
| Billion Barrels | 3.1 | 1.4 | 0.1 | 0.0 | 166.3 | 170.8 |
Canadian Crude Oil Production Outlook
- By 2040, Canadian crude oil production in the Reference Case reaches 963 10³m³/d (6.1 MMb/d)Footnote f , 56 per cent higher than 2014 levels. By the end of the projection period, oil sands production accounts for 79 per cent of total production, compared to 59 per cent in 2014. Figure 5.1 shows the Reference Case projection by type of crude oil.
Figure 5.1 - Total Canadian Crude Oil and Equivalent Production, Reference Case
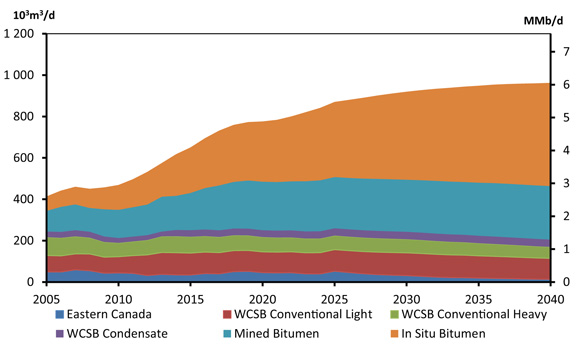
- Oil sands activity continues to make up the majority of crude oil production over the projection. In situ bitumen production is by far the dominant source of overall production by 2040 as operators continue to favour SAGD over other extraction methods.
- Total conventional crude oil production in the WCSB slowly declines early in the projection period due to relatively low prices. As the oil price climbs, investment in total conventional oil gradually increases production between 2022 and 2030, largely due to growing light oil production. After 2030, total conventional oil production begins a slow decline that continues to 2040.
- Eastern Canadian production continues to be led by activity in Newfoundland and Labrador’s offshore throughout the projection period. In the near term, production increases due to new production from the Hibernia South and White Rose extensions, and the Hebron Field, which is expected to begin production in 2017. The Reference Case assumes incremental production resulting from the discovery of a new field begining in 2025. As offshore fields mature, long-term production declines continue from 2025 until the end of the projection.
Oil Sands Production
- Oil sands production during the first five years of the projection is estimated by taking into account projects already producing or currently under construction. For the remainder of the projection period the list of all known proposed projects is taken into consideration. The long-term production projections take into account historical production growth rates, projected economic returns and capital expenditure requirements.
- Oil sands production continues to grow over the projection period, reaching 757 10³m³/d (4.8 MMb/d) in 2040. The industry continues to develop in situ projects and focuses less on mining and upgrading projects. The economics of mining and upgrading operations are relatively less attractive compared to in situ over the projection period.
Figure 5.2 - Oil Sands Production, Reference Case
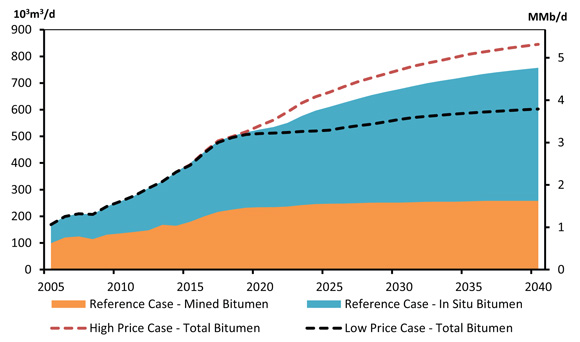
- In situ operations became the largest form of oil sands production in 2014 and this continues throughout the remainder of the projection period. In 2040, in situ accounts for 499 10³m³/d (3.1 MMb/d), or 66 per cent of total bitumen production, with mining representing the remaining 258 10³m³/d (1.6 MMb/d). Total production from oil sands more than doubles from 2014 levels by 2040.
- The effect of recent low crude oil prices on oil sands production is limited in the near-term projections. Oil sands producers are unlikely to lower production from currently producing projects or delay projects that are nearly complete. As shown in Figure 5.2, production growth in the next five years keeps pace with recent years. Although production continues to grow post 2020, it does so at a slower pace because of operators’ current decisions to defer or cancel projects.
- Historically, mined bitumen production and bitumen upgrading, where the bitumen is converted into a higher quality crude oil, have been closely related. This is because the mines were directly associated with upgrader projects. However, the startup of two mining projects without associated upgraders, Kearl in 2014 and Fort Hills, scheduled for 2017, means this direct relationship will no longer apply. Mined bitumen production outpaces upgrading over the course of the projection.
- The average growth rate from 2014 to 2019 is seven per cent for both mined and in situ production. After 2020 the average growth rates are one per cent for mining, and three per cent for in situ. This decline in growth is partly due to higher overall production levels resulting in more maintenance capital spending, leaving a relatively smaller amount of capital available for new projects. As is often the case with any source of supply, new oil sands projects will likely experience a decline in the overall quality of the reservoir as core production areas are exploited, leading to a drop in productivity. Also, several projects will be terminated at the end of their productive life throughout the projection period.
- Oil sands production in all cases is similar from 2015 to 2020. Most oil sands projects under construction or in the advanced planning stages are likely to be developed in all three price cases. In the High Price Case, total bitumen production continues to grow robustly, reaching 845 10³m³/d (5.3 MMb/d) by 2040, 12 per cent higher than in the Reference Case. In the Low Price Case total oil production grows very little from 2020 to 2025 as prices are too low to encourage additional investments. After 2025, growth begins to increase slowly reaching 603 10³m³/d (3.8 MMb/d) by 2040, or 20 per cent less than the Reference Case. Table 5.2 illustrates an average of publically available industry information on the cost of building various types of oil sands projects. The table also includes the WTI price per barrel that would likely be required to entice an operator to build that particular type of project.
Table 5.2 - Estimated Initial Capital Expenditure and Threshold Prices for New Oil Sands Projects
| Capital Expenditure ($/bbl of capacity)Note a |
Economic ThresholdNote b (WTI US$ equivalent/bbl, US$2014) |
|
|---|---|---|
| Mining, Extraction and Upgrading | 100 000-120 000 | 80-100 |
| Stand-Alone Mining and Extraction (No Upgrading) | 55 000-75 000 | 80-90 |
| SAGD, CSSNote c | 25 000-45 000 | 50-60 |
- The North West Redwater Partnership upgrader, which will process bitumen received by the Alberta government under the bitumen royalty-in-kind initiative, is currently under constructionFootnote 79. The facility, designed with three 7.9 10³m³/d (50 Mb/d) phases, will produce vacuum gas oil, diluent, and diesel fuel. Production from Phase 1 is planned to begin September 2017. The facility is designed to capture 1.2 MT CO2 per year for each phase, which will be transported by the Alberta Carbon Trunk LineFootnote 80 and used for enhanced oil recovery in south-central Alberta.
- Feedstock for upgraders is almost entirely sourced from mining operations, with in situ operations providing approximately 10 per cent. In the Reference Case, upgraded bitumen reaches 197 10³m³/d (1.2 MMb/d) in 2040, consuming 26 per cent of bitumen production.
Natural Gas for Oil Sands
- Oil sands extraction is energy intensive and uses natural gas as fuel. The amount of natural gas needed to produce a barrel of bitumen decreases over the course of the projection to reflect continuing technological improvements. For the various oil sands technologies, the projections assume a one per cent decrease in natural gas intensity per year. However, in situ production is more natural gas intensive than mining operations and in situ production increases more than mining. As a result of these opposing factors, the natural gas intensity of the oil sands changes over the projection period. From 2015 to 2025 when a larger proportion of in situ projects are commissioned, intensity of the oil sands increases slowly. After 2025, efficiency improvements begin to outweigh the effect of growing in situ production, resulting in declining natural gas intensity for the remainder of the projection period.
Figure 5.3 - Purchased Natural Gas for Oil Sands Extraction and Upgrading, Reference Case
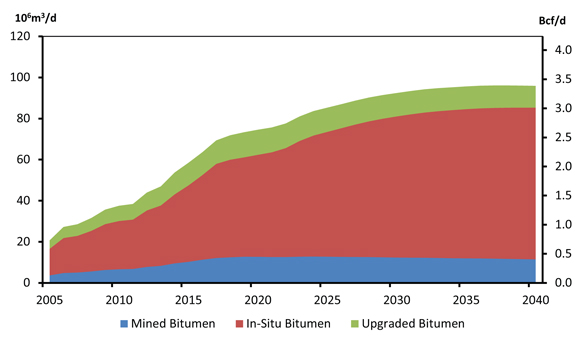
- As shown in Figure 5.3, natural gas requirements for oil sands use, including those for electrical cogeneration rise to 96 106m³/d (3.4 Bcf/d) by 2040 in the Reference Case.
- A number of solvent-added processes are currently being used and others are undergoing trials in pilot stages. These processes increase recovery efficiency by adding small amounts of solvents such as butane and propane to the steam injected in SAGD and CSS projects. Other pilot projects are testing electrical-stimulation methods.
Conventional Oil Production
- The projections of conventional crude oil production in the WCSB are guided by a combined oil and natural gas drilling model. It considers oil and natural gas prices, historical capital expenditures, oil and natural gas drilling levels, revenues, reinvestment ratios, and other factors. Historical relationships between these factors are extrapolated to project activity levels for oil and natural gas drilling.
Figure 5.4 - WCSB Conventional Oil Production, Reference Case
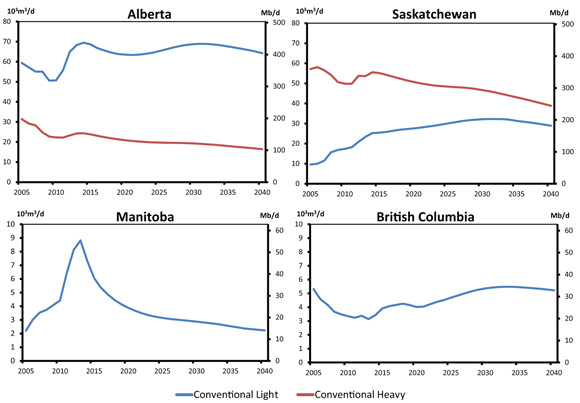
- Figure 5.4 shows conventional light and heavy oil production, including tight oil production, in western Canada. In 2014, light oil production from 16 tight oil plays in the WCSB reached 69 10³m³/d (432 Mb/d). Most of the recent activity has centered in the Cardium, Viking, and Bakken plays. Tight oil production accounted for 57 per cent of total WCSB conventional light oil production in 2014.
- In Alberta, Saskatchewan and B.C. light oil production declines in the near term as a result of lower oil prices. As prices increase, conventional production starts to grow early in the next decade and then begins a long-term decline by 2030 as production rates from new wells start to decline with the maturing of oil reserves. The light oil production profiles reflect the focus on tight oil plays, using horizontal drilling and multi-stage hydraulic fracturing. Unable to be developed using the same hydraulic fracturing technology applied to tight oil reservoirs, conventional heavy oil production slowly declines through the projection period.
- In Manitoba, production declines over the projection period, reflecting the limited resource potential currently assigned to the tight oil plays in that province.
- Newfoundland and Labrador produce most of the oil in eastern Canada, with Ontario and Nova Scotia contributing small amounts. In 2014, Newfoundland and Labrador produced an average of 34 10³m³/d (216 Mb/d) of light crude oil.
- In all of the price cases, medium-term production in eastern Canada increases because of new fields coming online. This includes production from the Hibernia South and White Rose extensions, and the Hebron Field which begins production in 2017. As shown in Figure 5.5, the projections assume a discovery of a 79 106m³ (500 MMb) field offshore of Newfoundland and Labrador. Production from this field starts producing in 2025 in the Reference Case, 2023 in the High Price Case and in 2031 in the Low Price Case. After the startup of this field, production declines to the end of the projection period in all cases.
Figure 5.5 - Eastern Canada Oil Production, Reference, High and Low Price Cases
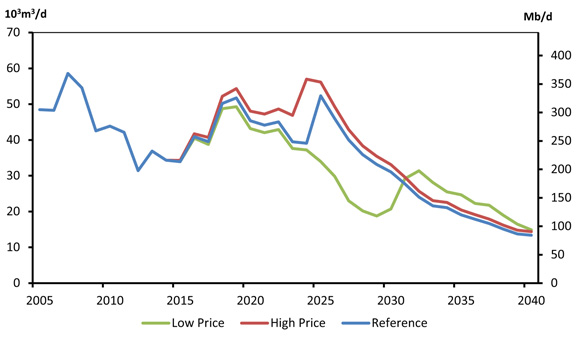
Total Canada Oil Production
- The differences in the oil production projections in the Reference, High and Low Price cases reflect the higher and lower oil and natural gas prices and the relative split between the capital expenditures for drilling of both oil and natural gas.
Figure 5.6 - Total Canadian Oil Production, Reference, High and Low Price Cases
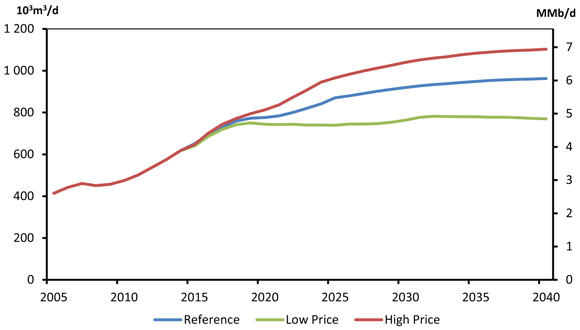
- As shown in Figure 5.6, the Reference Case projects that total oil production will reach 963 10³m³/d (6.1 MMb/d) by 2040, 56 per cent higher than 2014 levels. In the High Price Case production reaches 1 103 10³m³/d (6.9 MMb/d), 15 per cent higher than the Reference Case. In the Low Price Case production is 20 per cent lower than the Reference Case at 770 10³m³/d (4.9 MMb/d).
Supply and Demand Balance
- Net available oil supply is the amount of oil production that is available to the market after adjustments for processing losses, blending requirements for heavy oil and non-upgraded bitumen, and volumes of condensate diluents that are locally-recycled. All of the non-upgraded bitumen and most of the conventional heavy production that moves by pipeline must be blended with a light hydrocarbon, usually condensate, to reduce its viscosity and allow it to flow.
- Domestic disposition is the volume of Canadian crude oil feedstock required for refining. Domestic disposition is influenced by petroleum product demand and the volume of foreign crude oil processed in Canadian refineries. The oil refining sector in Canada relies on both domestic and imported crude to produce the RPPs that Canadians use. RPPs are also imported in some regions when it is economic.
- Canadian crude oil exports are the difference between net available oil supply and domestic disposition.
Figure 5.7 - Supply and Demand Balance, Light Crude Oil, Reference Case
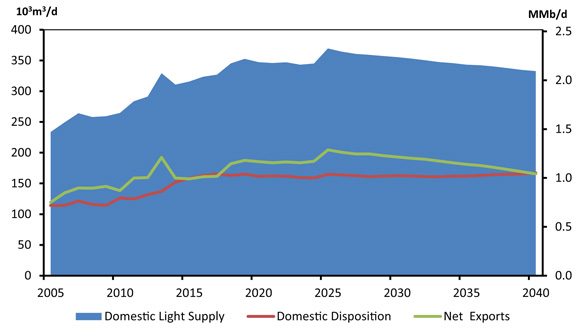
- In the Reference Case, light crude oil exports peak at 205 10³m³/d (1.3 MMb/d) in 2025 and gradually declines to 165 10³m³/d (1.0 MMb/d) in 2040, as shown in Figure 5.7. The decline after 2025 reflects lower production of light crude oil and relatively static domestic demand. As shown in Figure 5.8, heavy crude oil exports rise by 151 per cent from 2014 to 711 10³m³/d (4.5 MMb/d) by 2040, reflecting increases in blended bitumen production from Alberta’s oil sands.
Figure 5.8 - Supply and Demand Balance, Heavy Crude Oil, Reference Case
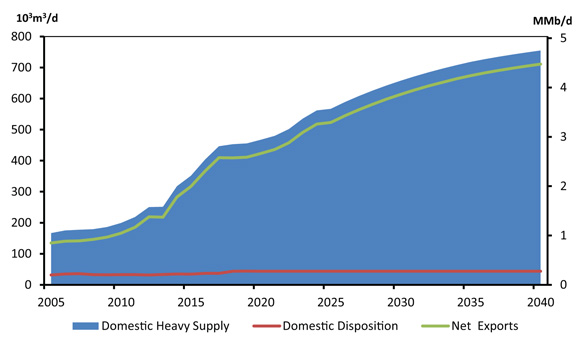
Key Uncertainties to the Outlook
- This analysis assumes that markets will be found for Canadian crude oil. Whether this assumption is correct is a major uncertainty in these projections. Continued rapid growth of tight oil production in the U.S., Canada’s primary oil export market, could reduce U.S. reliance on imported crude oil, including imports from Canada. While overseas markets could offer potential opportunities, Canadian producers face competition from around the globe. Chapter 10 discusses the uncertainties related to oil transportation infrastructure.
- The development of tight oil reservoirs is still in early stages in Canada. The extent to which these resources can be produced from is largely undetermined.
- Future crude oil prices are a key uncertainty in the projections. The three price cases in this analysis represent a reasonable range of outcomes, but do not capture all potential future price paths. In addition, the long-term price projections assume gradually increasing prices. It is possible that crude oil prices will be volatile, with possible price spikes in either direction.
- Future exchange rates present an uncertainty for Canadian oil producers. Oil exporters are paid in U.S. dollars, while most expenses are incurred in Canadian dollars. A volatile exchange rate would add further uncertainty in predicting economic returns for Canadian producers.
- The recent decrease in crude oil prices has led to significant reductions in operating costs, and drilling and development costs, for both oil sands and conventional oil producers. In a low price environment, competition for resources such as labour and materials is lower and producers often can obtain better terms for such resources. The extent to which lower costs can be sustained, and if and when cost escalation reappears, is a major uncertainty given the large number of projects completed each year.
- Rules and regulations regarding oil sands development continue to evolve and create uncertainty around the viability of future projects.
- Industry and governments in many jurisdictions are currently examining issues related to multi-stage hydraulic fracturing. These include the amount of fresh water used in the fracturing process, the protection of groundwater from fracturing fluids, and the chemical composition and safe disposal of fracturing fluids. Any future rules and regulations regarding these developments could affect the amount of tight oil production.
- In the last decade technological breakthroughs have significantly impacted the volumes of oil that can be produced. The inability to predict the occurrence and timing of technological breakthroughs is a key uncertainty.
Chapter 6. Natural Gas Outlook
Content
Natural Gas Resources
- Remaining marketable Canadian natural gas resources as of December 2014 were 30.8 1012m³ or 1 087 trillion cubic feet (Tcf) as shown in Table 6.1. This is slightly less than reported in EF 2013. Additional resources were added from the Canadian portion of the Bakken play, located in southeastern SaskatchewanFootnote 81. However, this increase was less than cumulative production in 2013 and 2014, leading to a small decline in remaining resources.
- Marketable tight natural gas resources in Canada are estimated to be 15.0 1012m³ (528 Tcf). This includes 12.7 1012m³ (447 Tcf) in the Montney play, located in northeastern B.C. and northwestern Alberta. For the purposes of this analysis, tight natural gas refers to production from low-permeability sandstone, siltstone, and carbonate reservoirs.Footnote g Tight natural gas reservoirs will typically not have sufficient pathways through the rock for natural gas to flow to the wellbore. Therefore, they require some form of stimulation to create pathways, such as hydraulic fracturing, horizontal drilling, or a combination thereof, to connect as many natural fractures as possible.
- The total Canadian shale resource estimate is 6.3 1012m³ (222 Tcf). Shale natural gas refers to natural gas produced from extremely low permeability rock composed of clay and microfossils. The Horn River Basin, a shale natural gas resource located in northeastern B.C., is estimated to contain 2.2 1012m³ (78 Tcf). Shale natural gas resources outside western Canada, such as the Utica Shale in Quebec and the Horton Bluff Shale in the Maritimes, were not included in this estimate as they are in the early stages of assessment.
Table 6.1 - Remaining Marketable Natural Gas Resources, as of December 31, 2014
| Natural Gas | WCSBNote a | West Coast | Northern Canada | Ontario and Quebec | East Coast | Canada |
|---|---|---|---|---|---|---|
| 109m³ | 24 218 | 482 | 3 286 | 226 | 2 573 | 30 785 |
| Tcf | 855 | 17 | 116 | 8 | 91 | 1 087 |
Canadian Natural Gas Production Outlook
Drilling Activity and Natural Gas Well Productivity
- In response to extremely cold weather in much of North America in late 2013 and early 2014, natural gas prices increased and remained elevated until mid-2014 as underground natural gas storage was refilled. This price increase encouraged more drilling activity and temporarily reversed the declining trend in the number of wells drilled.
- Drilling activity in the last few years has focused on deep tight and shale natural gas resources which have proven to be more economic than conventional resources. The cost to produce from these resources has declined due to technological advancements in horizontal drilling and multi-stage hydraulic fracturing. Some of these resource plays produce natural gas liquids (NGLs) along with natural gas, which can create additional revenue for producers. Development of shallow natural gas resources is largely on hold as they tend to lack NGLs and it is difficult to apply the same technologies that have reduced costs in the deeper resource plays. The focus on the deeper resources continues over the projection period.
- The increase in drilling of deep tight and shale natural gas wells, along with technological improvements in drilling practices, has increased the productivity of new wells in western Canada. As shown in Figure 6.1, average initial production (IP) ratesFootnote h have climbed over the last few years, from 16 10³m³/d (0.6 MMcf/d) of marketable natural gas in 2006 to 34 10³m³/d (1.2 MMcf/d) in 2014. In the early years of the projection, average IP rates continue to improve as producers target the Montney area, which has more productive wells. Beginning in 2022, average IP rates start to decline slowly and reach 39 10³m³/d (1.4 MMcf/d) by 2040.
Figure 6.1 - Natural Gas Wells Drilled, Reference, High Price and Low Price Cases, and Average WCSB Initial Production Rate, Reference Case
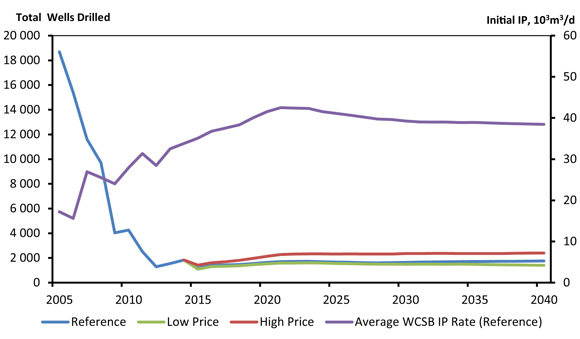
- Better natural gas producing prospects tend to be drilled earlier in the development cycle of a particular resource area. As activity shifts to less prolific areas of a basin over time, the productivity of new wells tend to be lower. Improvements in drilling and well completion technology can offset this effect, resulting in relatively stable productivity of new wells over the projection period. Therefore, individual IP rates are assumed to stay at current levels in most areas in western Canada over the projection period, including the Montney and shale gas plays.
- Capital expenditures and natural gas drilling activity is expected to drop in 2015 due to lower prices. The natural gas well count drops by 37 per cent from 2014, leading to slight production declines in 2016 and 2017. From 2018 onward, the number of natural gas wells drilled annually increases, driven by increased capital expenditures as natural gas prices rise. The number of natural gas wells will not reach the high levels witnessed during the 2005 to 2008 period. However, higher production rates from deep wells outpace the production declines from older wells leading to production increasing in Canada. The number of natural gas wells drilled each year rises from nearly 1 156 in 2014 to over 1 750 by 2040, including 610 Montney wells and nearly 60 Duvernay wells.
- This analysis assumes LNG exports start in 2019 at 14 106m³/d (0.5 Bcf/d) and increase by 14 106m³/d (0.5 Bcf/d) each year, reaching 71 106m³/d (2.5 Bcf/d) by 2023, after which they remain constant until the end of the projection period. This is an assumption rather than a projection. Exploration and development spending associated with LNG exports boost capital expenditures above what they would otherwise be. This leads to more natural gas wells and production in the WCSB. This LNG export assumption is the same for the Reference and High and Low Price cases. Chapter 11 further explores the relationship between LNG exports and natural gas production, as well as the uncertainty surrounding LNG exports from Canada.
- Higher natural gas prices in the High Price Case lead to greater capital expenditures, pushing the annual natural gas wells drilled to over 2 300 by 2040. The number of natural gas wells drilled per year in the Low Price Case increases to just over 1 600 in 2023 as additional production is brought on for LNG exports. After 2023, drilling activity in the Low Price Case slowly declines due to lower prices and capital expenditures, reaching 1 400 wells by 2040.
Natural Gas Production
- In the Reference Case, Canadian marketable natural gas production increases slightly from 416 106m³/d (14.7 Bcf/d) in 2014 to 437 106m³/d (15.4 Bcf/d) in 2018 as shown in Figure 6.2. Rising prices and LNG exports support higher drilling levels and production ramps up continuously from 2019 to 2023. After 2023, production growth slows and production is relatively stable thereafter, reaching 506 106m³/d (17.9 Bcf/d) by 2040.
Figure 6.2 - Natural Gas Production by Type, Reference Case
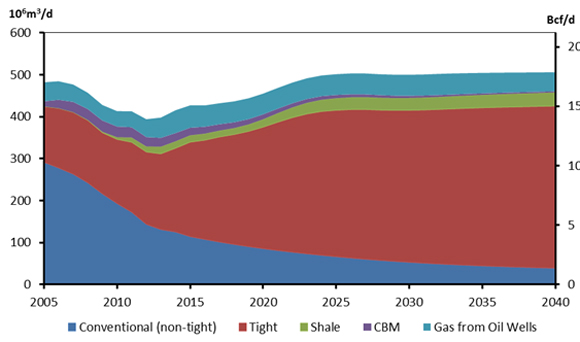
- Production increases continue in tight and shale natural gas, while non-tight conventional and coal bed methane (CBM) production continue to decline. Prior to 2009, conventional natural gas, not including tight natural gas, made up half or more of Canada’s annual production. With activity focusing on deep tight and shale resources in the projections, conventional natural gas accounts for only eight per cent of production by 2040, with tight natural gas making up 76 per cent and shale natural gas contributing six per cent of total production. Figure 6.3 shows key producing regions in the WCSB.
Figure 6.3 - Key Producing Regions in the Western Canada Sedimentary Basin

- In the Reference Case, natural gas production from the Montney formation in B.C. increases from 62 106m³/d (2.2 Bcf/d) in 2014 to 199 106m³/d (7.0 Bcf/d) in 2040. In Alberta, Montney production grows from 23 106m³/d (0.8 Bcf/d) in 2014 to 73 106m³/d (2.6 Bcf/d) in 2040.
- The Alberta Deep Basin region, which runs along Alberta’s foothills, produces large amounts of tight natural gas, and this continues over the projection period. NGLs in the natural gas stream, and the region’s proximity to existing natural gas processing and transportation infrastructure, make this an attractive resource. Marketable natural gas production grows steadily from 71 106m³/d (2.5 Bcf/d) in 2014 to 103 106m³/d (3.6 Bcf/d) by 2040 in the Reference Case, as production from new wells more than offsets production declines from older wells.
- Marketable Horn River shale gas production in the Reference Case is relatively flat over the projection period, increasing slightly from 14 106m³/d (0.5 Bcf/d) in 2014 to 19 106m³/d (0.7 Bcf/d) in 2040. Drilling activity in the Horn River Basin has been low over the last few years in response to declining natural gas prices and the absence of NGLs in the natural gas stream.
- The Cordova Embayment and Liard Basin shale plays in northeastern B.C. are in the early stages of development, but are included in the projection. In the Reference Case, marketable natural gas production is 0.3 106m³/d (12 MMcf/d) from Cordova and 0.9 106m³/d (32 MMcf/d) from the Liard Basin by 2040.
- Alberta’s Duvernay shale resource has been increasingly developed over the past few years. Condensate production from the Duvernay wells, which is used to dilute bitumen for pipeline transport, contributes significantly to producers’ revenues. In the Reference Case, by 2040 marketable natural gas production from the Duvernay is 11.8 106m³/d (417 MMcf/d), up from 1.8 106m³/d (65 MMcf/d) in 2014.
- CBM production declines over the projection period from 20 106m³/d (694 MMcf/d) in 2014 to 3.0 106m³/d (106 MMcf/d) in 2040, as producers pursue more economic resources.
- Production of natural gas from oil wells, or solution gasFootnote i, follows the oil production projections. Production is relatively stable until 2030 when it begins to decline slowly toward the end of the projection period. While light oil production is expected to increase at a faster pace after 2023, the resulting additional natural gas production is not enough to offset solution gas declines from older oil wells. Solution gas production decreases slightly from 54 106m³/d (1.9 Bcf/d) in 2014 to 46 106m³/d (1.6 Bcf/d) by 2040 in the Reference Case.
- Nova Scotia offshore natural gas production decreases over the projection period. The Deep Panuke project began producing marketable natural gas in the second half of 2013. In early 2015 a higher proportion of water was being produced along with natural gas and as of May 2015, production was shut down. The operator plans to begin production again in the winter months when natural gas prices are usually higher. Deep Panuke production declines steadily from 5.6 106m³/d (199 MMcf/d) in 2014, with production only occurring in the winter months of each year. Production from the SOEP continues to decline as well, falling from 3.5 106m³/d (123 MMcf/d) in 2014. Both of these projects are likely to be shut-in well before 2040 but timing of this is uncertain.
- New Brunswick onshore natural gas production tapers off over the projection. Shale natural gas exists in New Brunswick but no production from this resource is included in this projection. In Newfoundland and Labrador, natural gas is currently being produced along with oil from offshore oil wells and then re-injected into the reservoir. The prospect of bringing this natural gas onshore to market is currently speculative and is not included in this analysis.
- Marketable natural gas production in Ontario continues to decline from 296 10³m³/d (10 MMcf/d) in 2014 to 61 10³m³/d (2 MMcf/d) in 2040. Shale natural gas potential exists in Quebec. However, insufficient data is available and no marketable natural gas production is included in the projection.
- Production declines continue in the NWT and Yukon, from 310 10³m³/d (11 MMcf/d) in 2014 to 8 10³m³/d (0.3 MMcf/d) in 2040. Shale natural gas potential exists in the NWT and Yukon where the shales of the Horn River Basin and the Liard Basin stretch north of the 60th parallel. The shale natural gas resources in these areas are in the earliest stages of industry assessment and have not been included in the projections.
- Production profiles from all areas outside of the WCSB continue to decline over the projection period. Operations in these areas will likely terminate before 2040 once production revenues no longer cover operating expenses. This includes production in northern Canada, Ontario, New Brunswick and offshore Nova Scotia.
- As shown in Figure 6.4, Canadian marketable natural gas production in the High Price Case averages 665 106m³/d (23.5 Bcf/d) in 2040. Higher prices lead to higher production levels than in the Reference Case. Production from new wells offset older well production declines and additional drilling and production for LNG exports accelerates production growth from 2019 to 2023.
Figure 6.4 - Total Canadian Marketable Natural Gas Production, Reference, High and Low Price Cases
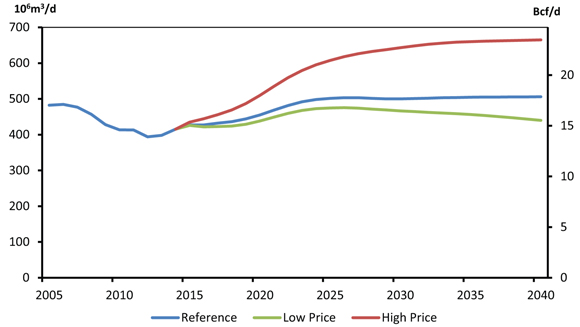
- Canadian production in the Low Price Case increases from 2017 to 2026 in large part due to LNG exports. This is followed by production declines as prices are too low to encourage enough investment in new production and offset declining production from older wells. Marketable production increases to 475 106m³/d (16.8 Bcf/d) by 2026 and then declines to 440 106m³/d (15.5 Bcf/d) in 2040.
Supply and Demand Balance
- Canadian natural gas exports, all of which are currently made to the U.S., have been declining since 2007. Natural gas imports into Canada from the U.S. had been increasing as shale natural gas produced in the Northeast U.S. entered the Ontario market. Imports of natural gas have declined since peaking in 2011 and were 59 106m³/d (2.1 Bcf/d) in 2014. This represents about two-thirds of total Ontario natural gas consumption.
- Net exports of natural gas are the difference between Canadian marketable natural gas production and demandFootnote j. Canadian net exports have decreased since 2007, as shown in Figure 6.5. In the Reference Case, net exports of natural gas continue to decline until 2019 when they begin increasing with the start-up of LNG exports. After production growth associated with LNG exports subsides in 2023, total net exports decrease to 104 106m³/d (3.7 Bcf/d) in 2040.
Figure 6.5 - Supply and Demand Balance, Natural Gas, Reference Case
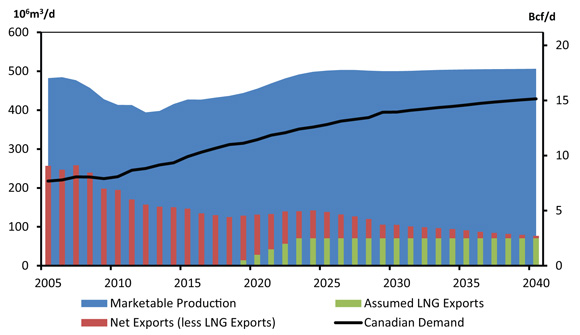
- In the High Price Case, net exports are 262 106m³/d (9.3 Bcf/d) in 2040, as shown in Figure 6.6. Higher production levels result in higher natural gas net exports.
- Production in the Low Price Case is lower than in the Reference Case, leading to declining net exports after 2023, which reach 37 106m³/d (1.3 Bcf/d) in 2040.
Figure 6.6 - Canadian Net Exports of Natural Gas, Reference, High and Low Price Cases
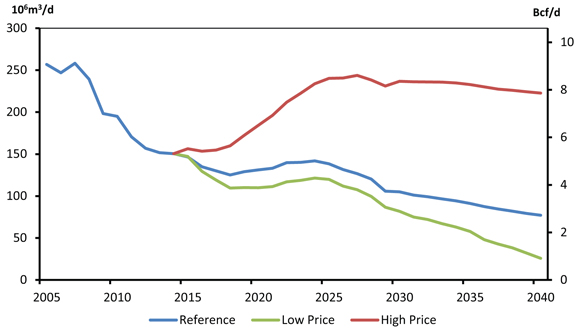
Key Uncertainties to the Outlook
- Future natural gas prices are a key uncertainty in the projections. The three price cases in this analysis represent a reasonable range of potential outcomes but may not capture future price volatility in the market. Natural gas price changes affect producer revenues and the amount of capital reinvested into the industry. Many producers produce both oil and natural gas, so oil price changes can affect total revenues and spending as well.
- Natural gas producers targeting NGLs in the U.S. and Canada have increased NGL supply. Prices for NGLs are usually closely linked to crude oil prices but recently this relationship has weakened due to NGL supply growth outpacing demand, resulting in lower prices for some NGLs. Future NGL prices are an uncertainty for the natural gas projections.
- The timing and volume of LNG exports from Canada are key uncertainties given the impact that it could have on exploration, production, and infrastructure development. Uncertainty related to LNG exports is explored further in two sensitivity cases in Chapter 11.
- Potential labour, service, or equipment shortages and corresponding cost escalation could impact the pace of natural gas drilling, especially over the next decade. The possible ramp-up of activity to increase production for LNG exports, and an increase in tight oil activity and production due to an increase in crude oil prices, could lead to increasing demand for labour, services and equipment.
- The growth of U.S. shale natural gas and solution gas outpaced declines from other natural gas resources. This has decreased prices since 2009 and enabled U.S. natural gas production to reach record levels in 2014. Future growth of U.S. shale natural gas production will continue to affect North American natural gas prices. If the U.S. starts to export significant amounts of LNG, it would support North American prices.
- Industry, government, and various groups in many jurisdictions continue to monitor aspects of multi-stage hydraulic fracturing. These include the amount of fresh water used in the fracturing process, the risks to ground water, and the chemical composition and safe disposal of fracturing fluids. Changing rules and regulations in these areas could affect the pace and level of drilling activity.
- Average well production rates could be higher or lower than this analysis assumes. Similarly, the long term decline rates of wells, especially in emerging basins, may be different than this analysis assumes. Another uncertainty is the development of additional natural gas resources, such as Canadian shale natural gas plays outside of the WCSB.
- This analysis assumes that there will be sufficient infrastructure to move Canadian natural gas to domestic and export markets and that there will be enough demand in export markets for Canadian natural gas. If shortfalls in infrastructure or market demand were to occur, actual produced volumes may be lower than these projections.
Chapter 7. Natural Gas Liquids Outlook
- Raw natural gas recovered at a wellhead is comprised primarily of methane, but often contains other hydrocarbons and some contaminants. These other hydrocarbons, NGLs, consist of ethane, propane, butanes and pentanes plus.
- NGLs are an important component of the Canadian energy mix. Ethane is an essential feedstock for the Canadian petrochemical industry. Propane is used for space heating in the residential and commercial sectors, and is exported in significant quantities to the U.S. Butanes have various petrochemical applications and are used to produce refined petroleum products. Butanes can also be used as a blending component, or diluent, to decrease the viscosity of heavy oil and bitumen to enable pipeline transport. The majority of pentanes plus is also used as a blending component for heavy oil and bitumen.
- In Canada, the majority of NGLs are produced at natural gas processing plants. The remainder is a by-product of oil refining or bitumen upgrading. Hundreds of field plants located in the natural gas producing areas of Alberta and B.C. account for the majority of propane, butanes, and pentanes plus production. Some ethane production comes from deep-cut field plants, which are located in gas fields and have the capability to extract ethane. However, the majority of ethane is extracted at straddle plants. Straddle plants are large natural gas processing facilities located on major natural gas pipelines close to petrochemical facilities or at key collection points where natural gas exits a supply region in Alberta and B.C. Access to high volumes of natural gas enables straddle plants to take advantage of economies of scale and overcome the high capital investment required for ethane extraction. Figure 7.1 shows the location of the straddle plants located in Alberta.
Figure 7.1 - Straddle Plants in Alberta
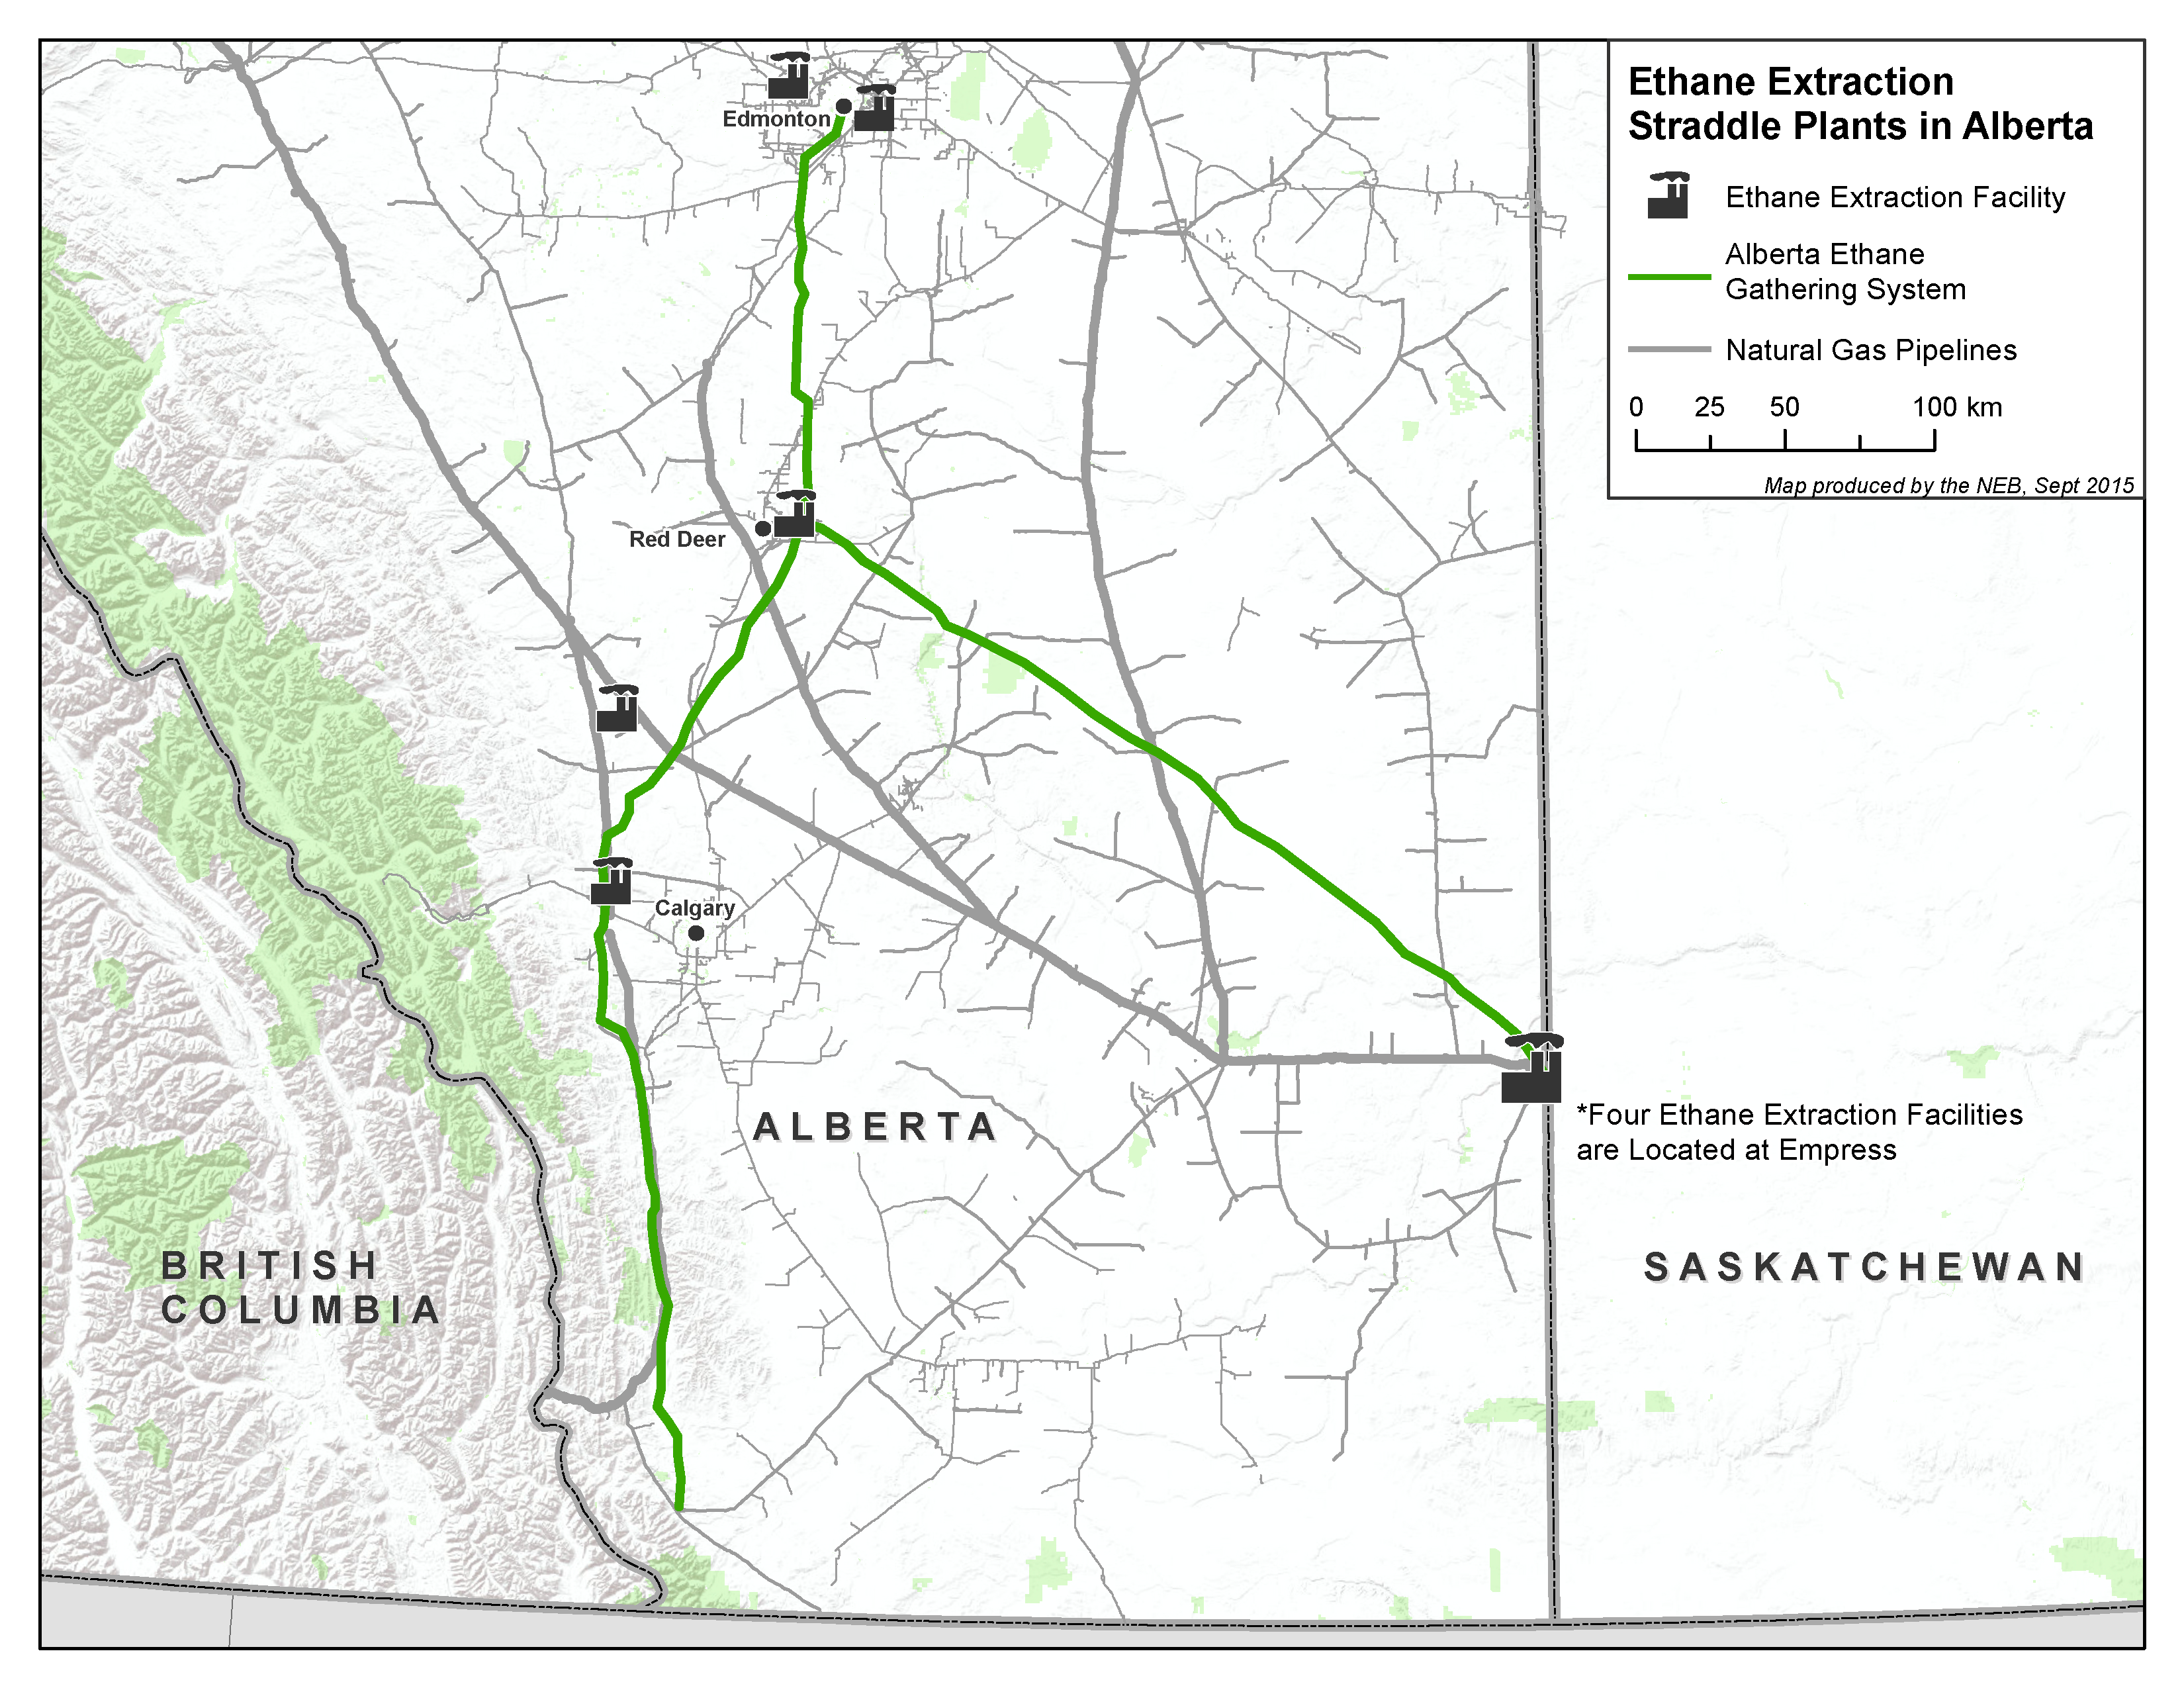
- As shown in Figure 7.2, total Canadian NGL production in the Reference Case remains largely flat after 2021. Ethane production declines at an average annual rate of 0.5 per cent from 2014 to 2040. Combined: propane, butanes and pentanes plus production increase at an annual average rate of 0.7 per cent per year.
Figure 7.2 - Natural Gas Liquids Production, Reference Case
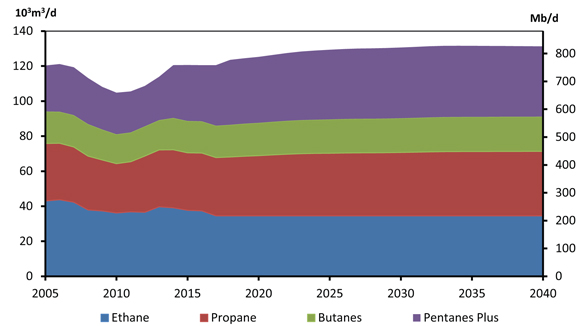
Ethane
- Ethane production from natural gas processing and straddle plants in Canada declines over the long term in the Reference Case. This is due to higher natural gas consumption in Alberta and B.C., coupled with LNG exports off the West Coast of B.C., reducing flows of western Canadian natural gas through Alberta’s straddle plants. Off-gas production of ethane, which is produced in the oil sands upgrading process, increases slightly. Overall, the result is a reduction in total ethane production from 39 10³m³/d (246 Mb/d) in 2014 to 35 10³m³/d (217 Mb/d) in 2040.
- Natural gas resource development focusing on NGL-rich natural gas, especially in the Montney, increases ethane availability in Western Canada. However, without additional ethane extraction facilities located near these emerging producing regions to process natural gas destined for Alberta and B.C. markets or LNG export facilities, the ethane will remain in the natural gas stream. If this ethane were captured, assuming a recent historical recovery rate of 50 per cent, ethane production from natural gas plants could increase to 62 10³m³/d (389 Mb/d) in 2040.
- The Vantage pipeline entered service in 2014, importing ethane from the Bakken region in North Dakota, and transporting small amounts from Saskatchewan. This provides additional feedstock for Alberta’s petrochemical sector.
- In Ontario, the NOVA Chemicals petrochemical facility was reconfigured in 2014 to be able to use lighter NGL feedstock. As a result, Canada’s petrochemical capacity for ethane use increased from 41 10³m³/d (260 Mb/d) in 2013 to 55 10³m³/d (346 Mb/d) by 2018. In Alberta, the ethane capacity of petrochemical facilities only increases up to 45 10³m³/d (280 Mb/d) with some gradual minor de-bottlenecking.
- Figure 7.3 illustrates the total supply and demand balance for ethane in Canada over the projection period. Despite declining Canadian production, imports from the U.S. increase total ethane availability in Canada. Total Canadian petrochemical capacity to use ethane includes NOVA Chemical’s plant in Ontario and accounts for some de-bottlenecking of facilities in Alberta.
Figure 7.3 - Ethane Supply and Petrochemical Capacity, Reference Case
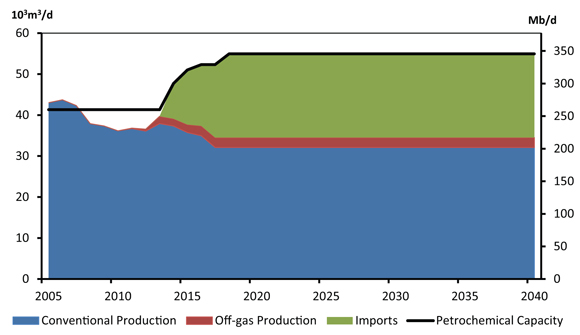
Propane
- In the Reference Case, propane supply gradually increases from 2014 levels over the projection period, reaching 37 10³m³/d (231 Mb/d) by 2040. Increasing liquids-rich natural gas activity in Alberta and B.C. contributes to growing propane production. Development of Montney natural gas results in B.C. natural gas plant propane production more than doubling from 2.5 10³m³/d (15.4 Mb/d) in 2014 to 5.7 10³m³/d (36 Mb/d) in 2040. Alberta natural gas plant propane production declines slightly, from 24 10³m³/d (148 Mb/d) in 2014 to 23 10³m³/d (144 Mb/d) in 2040.
Figure 7.4 - Supply and Demand Balance, Propane, Reference Case
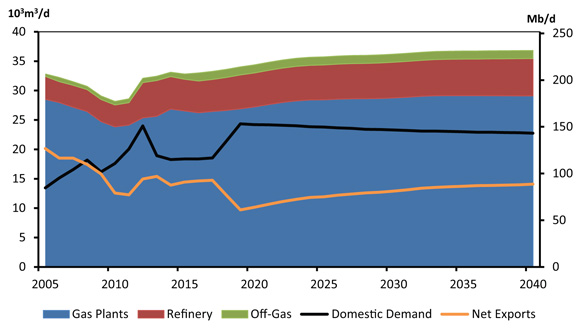
- Saskatchewan and Nova Scotia contributed only small volumes to Canadian propane production in 2014, 0.7 10³m³/d (4.2 Mb/d) and 0.3 10³m³/d (1.6 Mb/d), respectively. Production for both provinces declines steadily over the projection period.
- Refinery production of propane increases slightly from an estimated 5.5 10³m³/d (35 Mb/d) in 2014 to 6.3 10³m³/d (40 Mb/d) in 2040.
- As shown in Figure 7.4, domestic demand for propane increases in 2018, a result of the construction of a new petrochemical facility in Alberta that uses propane as a feedstock. After this expansion, demand decline gradually to 23 10³m³/d (143 Mb/d) in 2040, somewhat higher than 2014 levels.
Butanes
- Production of butanes in the Reference Case follows a similar production trend as propane, gradually increasing over the entire outlook period. Total natural gas plant butanes production grows from 15.5 10³m³/d (97 Mb/d) in 2014 to 16.2 10³m³/d (102 Mb/d) in 2040. Refinery production of butanes increases from 2.4 10³m³/d (15 Mb/d) in 2014 to 2.9 10³m³/d (18 Mb/d) by 2040, while off-gas production results in an additional 0.7 10³m³/d (4.2 Mb/d) of butanes supply by 2040, an increase from 0.4 10³m³/d (2.7 Mb/d) in 2014.
- Demand for butanes increases from 12 10³m³/d (76 Mb/d) in 2014 to 15 10³m³/d (96 Mb/d) in 2040 Butane use for refining and as a bitumen diluent grow over the projection period while petrochemical demand is relatively stable.
Pentanes Plus
- Total Canadian pentanes plus and condensate production from natural gas plants grows gradually over the long term, from 26 10³m³/d (162.4 Mb/d) in 2014 to 29 10³m³/d (185 Mb/d) in 2040, as shown in Figure 7.5. Total field, or wellhead, condensate production increases from 5.2 10³m³/d (33 Mb/d) to 6.1 10³m³/d (38 Mb/d) over the projection period. By 2018, the North West Redwater Partnership upgrader is expected to produce 4.5 10³m³/d (28 Mb/d) of diluent. Total Canadian production reaches 40 10³m³/d (252 Mb/d) in 2040 compared to 31 10³m³/d (195 Mb/d) in 2014.
- Diluent demand for pentanes plus and condensate in the Reference Case increases from 54 10³m³/d (339 Mb/d) in 2014 to approximately 180 10³m³/d (1 131 Mb/d) in 2040 due to growth of oil sands production in western Canada. Net implied imports of pentanes plus and condensate increase from 23 10³m³/d (144 Mb/d) in 2014 to 140 10³m³/d (879 Mb/d) in 2040. The reversal and repurposing of the Cochin Pipeline in 2014 has added an additional 15 10³m³/d (95 Mb/d) of capacity for importing condensate into western Canada.
Figure 7.5 - Supply and Demand Balance, Pentanes Plus, Reference Case
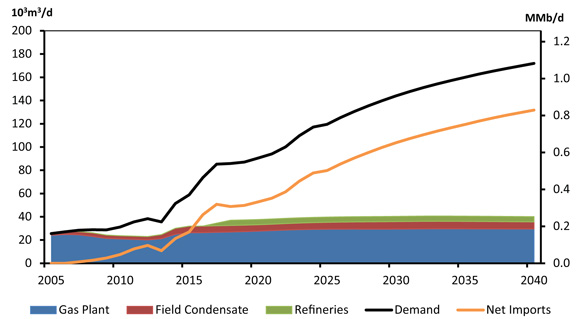
- In the High Price Case, higher natural gas production leads to higher liquids production with total NGL production increasing to 163 10³m³/d (1 025 Mb/d) in 2040 from 120 10³m³/d (758 Mb/d) in 2014. Ethane production falls slightly to 38 10³m³/d (237 Mb/d) in 2040, limited by the projected petrochemical demand capacity in Alberta. Propane and butanes production increases to 47 10³m³/d (298 Mb/d) and 22 10³m³/d (161 Mb/d), respectively. Pentanes plus and condensate production grows to 52 10³m³/d (329 Mb/d) and imports of diluent in 2040 grow to 143 10³m³/d (902 Mb/d).
- In the Low Price Case, declining natural gas production results in lower liquids production, with total NGL production declining to 110 10³m³/d (691 Mb/d) in 2040. Lower volumes of natural gas exported from Alberta, and thus lower volumes passing through the straddle plants, negatively impact ethane production, which falls to 28 10³m³/d (175 Mb/d) in 2040. Propane production declines slightly, at 0.2 per cent per year to 31 10³m³/d (198 Mb/d) in 2040 while butanes production remains flat, at 17 10³m³/d (107 Mb/d) in 2040. Pentanes plus production increases at 0.4 per cent per year to 33 10³m³/d (212 Mb/d) in 2040.
Key Uncertainties to the Outlook
- NGLs are a by-product of natural gas production, and NGL supply is sensitive to Canadian natural gas supply uncertainties. Since NGL content varies between geological formations, the mix of natural gas sources also has an impact on future NGL supply.
- North American NGL markets have changed considerably in recent years, with rapidly increasing natural gas production in the U.S. leading to increased NGL supply. As a result, the U.S. exported ethane to Canada for the first time in 25 years in 2013 and other NGL exports to Canada grew rapidly from 2012 to 2015. Further North American production growth could result in additional imports of ethane and contribute to higher growth in the Canadian petrochemical sector than outlined in these projections.
- Due to an oversupply of propane in western Canada, propane prices at the Edmonton trading hub fell to near zero during much of the summer of 2015. Future prices of propane and other NGLs will impact the economics of targeting liquids rich natural gas plays and represents an uncertainty for NGL production.
- The rate of oil sands production growth will affect the level of imports of condensate required for blending bitumen to enable pipeline transport. Prolonged low crude oil prices could result in the delay of new projects and expansions in the oil sands, thus reducing demand for diluent.
- Uncertainty regarding the timing and magnitude of West Coast LNG projects will affect western Canadian natural gas production, and thus NGL production. Furthermore, the level of processing of natural gas destined for LNG exports, and the heat content requirements of export markets, will also have an effect on NGL production, primarily ethane.
Chapter 8. Electricity Outlook
Content
Overview
- In 2014, installed electricity generation capacity in Canada reached 140 GW. Hydroelectricity remains the primary source of electric power, accounting for 55 per cent of total capacity. Natural gas, coal, and nuclear plants provide most of the remaining supply, while non-hydro renewables such as wind, solar, and biomass make up nine per cent of capacity.
- The electricity supply mix varies significantly among the provinces and the territories, reflecting the types of energy available, economic considerations, and policy choices. Quebec, B.C., Manitoba, Newfoundland and Labrador, and Yukon have significant hydroelectric resources which are used to supply most of their electricity needs. Saskatchewan and Alberta have historically relied on locally abundant coal resources but have been expanding their natural gas-fired fleet in recent years. Nuclear power plants represent approximately one-third of Ontario’s capacity, with natural gas and hydro providing much of the remaining power. The Maritime provinces rely on a combination of hydro, various fossil fuels, nuclear, and non-hydro renewable resources. Diesel-fueled plants account for most of the capacity in Nunavut and NWT.
- In 2014, Canadian electricity demand was 550 TW.h and accounted for 17 per cent of total Canadian end-use energy demand. In the Reference Case, electricity demand increases at an average annual rate of one per cent over the projection period.
- Total electricity generation capacity increases by an annual average of one per cent during the projection period, reaching 173 GW in 2040. Capacity is added to replace retiring units and meet growing demand. As existing facilities age, they need to be replaced for reliability, economic and/or environmental reasons. In addition, sufficient capacity needs to be constructed to meet growing demand and maintain adequate capacity beyond peak demand requirements.
- Figure 8.1 shows additions and retirements of generating capacity over the projection period. The majority of additions to capacity are natural gas, wind and hydro facilities, accounting for 84 per cent of the total 45 GW additions from 2014 to 2040. The remaining additions include 3.5 GW of solar, 1.8 GW of biomass/geothermal and 1.2 GW of coal, of which 1.3 GW is CCS. Retirements are primarily coal plant shutdowns and there are small reductions in nuclear and oil-fired generating capacity.
Figure 8.1 - Capacity Additions and Retirements by 2040, Reference Case
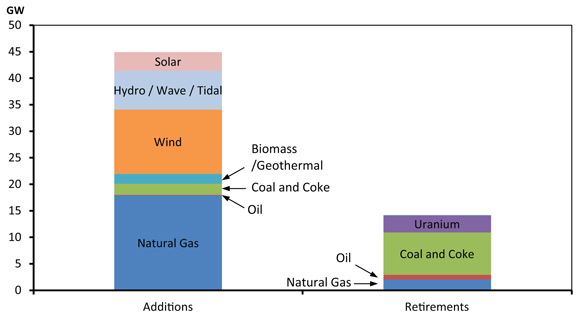
- The electricity fuel mix in Canada changes over the projection period. As shown in Figure 8.2, the share of natural gas and renewables increases while coal, oil, and uranium decrease due to retirements and lower growth compared to other types of generation. The share of nuclear power in the total capacity mix declines from ten to six per cent from 2014 to 2040, and the share of hydro decreases from 55 to 51 per cent. In contrast, the proportion of capacity from non-hydro renewables increases from nine per cent to 16 per cent.
Figure 8.2 - Capacity Mix by Primary Fuel, 2014 and 2040, Reference Case
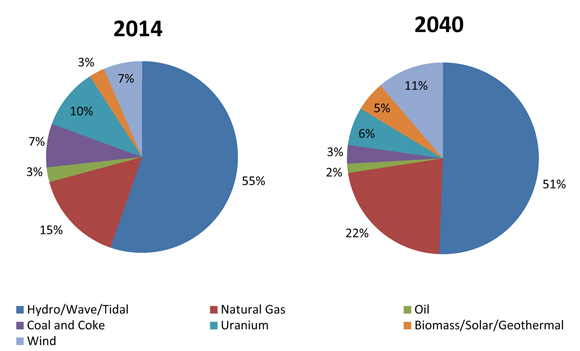
- The changes in the national fuel mix are driven by regional shifts. The capacity fuel mix in Alberta and Saskatchewan changes significantly as both provinces shift from coal to natural gas. B.C. increases its hydro capacity but natural gas-fired generation is also added to provide auxiliary power to LNG export facilities. Quebec and Manitoba build new hydroelectric facilities and expand wind capacity. Natural gas-fired plants and non-hydro renewable sources are added in Ontario and nuclear units are taken offline for refurbishment and restarted throughout the projection period. In the Atlantic provinces, oil-fired and coal-fired plants are gradually replaced with natural gas and non-hydro renewables, and hydro power coming from the Muskrat Falls project in Labrador.
- Total electricity generation grows at an average annual rate of one per cent per year over the projection period as shown in Figure 8.3. During this period, natural gas is the fastest growing fuel for generation, growing at an annual average rate of four per cent per year.
Figure 8.3 - Generation by Fuel, Reference Case
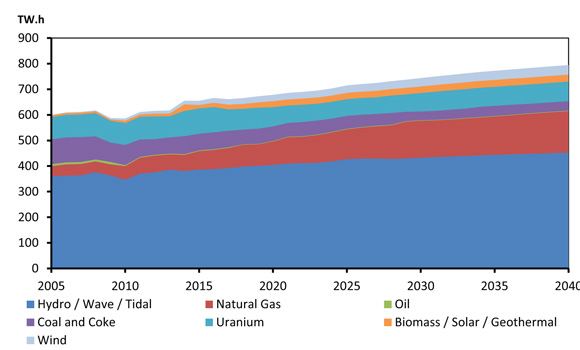
Outlook by Fuel
Hydro
- Hydroelectricity remains the dominant source of electricity supply in Canada over the projection period. Hydro power has numerous advantages including flexibility, relative affordability, lack of CO2 emissions, and cost-stability. With its capability to store water and to ramp up output when intermittent resources are unavailable, Canada’s hydro capacity also facilitates the development of other renewable resources such as wind and solar.
- Taking into account provincial utility plans, hydro-based capacity, including small hydro and run-of-river facilities, increases from 77 GW in 2014 to 87 GW in 2040. This capacity expansion reflects a number of large hydro projects currently under construction such as La Romaine in Quebec, Muskrat Falls in Labrador, and Keeyask in Manitoba as well as projects in the planning and development stages such as Site C in B.C., Petit Mécatina in Quebec, and Conawapa in Manitoba.
- As a result of hydro-based capacity expansions, annual hydroelectricity production increases from 381 TW.h in 2014 to 452 TW.h in 2040. Due to faster growth in other forms of generation, such as wind and natural gas-fired generation, the share of hydroelectricity generation declines from 59 per cent in 2014 to 57 per cent in 2040.
Non-hydro Renewables
- In addition to its vast hydroelectric potential, Canada has considerable non-hydro renewable resources including wind, biomass, solar, tidal, wave, and geothermal. In the last few years, policy incentives and declining costs have spurred significant growth in the use of these technologies. Between 2010 and 2014, non-hydro renewables were the fastest growing generation source in percentage terms, with an annual growth rate of 20 per cent. In 2014, Canada had close to 13 GW of wind, solar, and biomass installations, accounting for 9 per cent of total capacity. Power plants harnessing tidal, wave, and geothermal resources remain relatively uncommon but tidal facilities are planned in Nova Scotia. Most wind power capacity is installed in Ontario, Quebec, and Alberta; while the majority of solar capacity is in Ontario.
- Non-hydro renewable capacity grows by over 15 per cent per year until 2017, as shown in Figure 8.4. Annual growth rates taper off afterwards as several provinces approach their renewable energy targets.
Figure 8.4 - Non-hydro Renewable Capacity, Reference Case
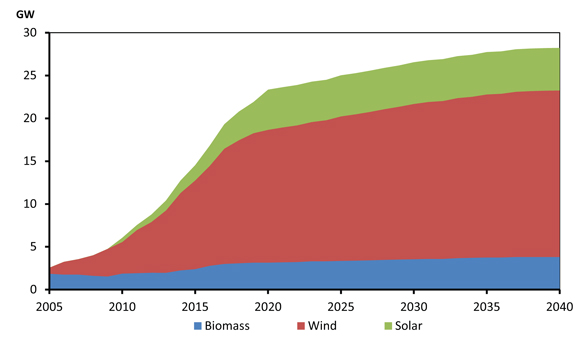
- Over the projection period, wind contributes the most to non-hydro renewable capacity growth. Total installed wind power capacity increases two-fold over the projection period, reaching 19 GW in 2040. The largest capacity additions occurring in Quebec, Ontario, Alberta and Saskatchewan. The share of wind generation increases from over two per cent of total electricity generation in 2014 to close to five per cent by 2040.
- Solar capacity grows from 1.4 GW, or one per cent of total capacity in 2014, to 4.9 GW, or close to three per cent of total capacity in 2040. Although solar capacity is expected to increase throughout Canada, the majority of additions occur in Ontario.
- Biomass grows from 2.2 GW in 2014 to 3.8 GW in 2040. Most new capacity is added in B.C., Ontario, Quebec and Alberta. In Ontario, two former coal-fired units were recently converted to biomass.
- Non-hydro renewables account for 16 per cent of capacity in 2040, but they generate approximately eight per cent of total electricity. This is because wind and solar facilities have lower capacity utilization factors than hydro, nuclear, or natural gas plants due to the intermittency of wind and sunshine.
Nuclear
- Nuclear energy accounted for 15 per cent of total electricity generation in Canada in 2014. Following the shut-down of the Gentilly facility in Quebec in 2012, Ontario and New Brunswick are the only provinces using nuclear power to generate electricity.
- Annual nuclear generation declines from 98 TW.h in 2014 to 77 TW.h in 2040. Through much of the projection period, nuclear generation is somewhat lower than current levels due to expected outages of several nuclear units scheduled for refurbishment.
- Nuclear power plays a significant role in Ontario where it accounted for 57 per cent of electricity generation in 2014. Over the projection period several nuclear plants will reach the end of their useful life and will have to be refurbished to continue operations. Refurbishments at the Bruce and Darlington plants start in 2017 and continue until 2031, with each unit taken offline for two to three years. The Pickering nuclear plant is expected to retire in 2021.
- No new nuclear units are anticipated to be built in any province during the projection period.
Coal-Fired
- A key feature of the electricity supply outlook is the declining role of coal used in power generation. This trend reflects various government and industry initiatives to reduce GHGs, including the complete phase-out of coal in power generation in Ontario, and stricter federal regulation of GHG emissions from coal-fired power plants.
- Under new federal regulations, Reduction of Carbon Dioxide Emissions from Coal-Fired Generation of Electricity Regulations (Reduction Regulations), coal plants are required to meet an annual average emissions-intensity standard of 420 tonnes of CO2 per GW.h during a calendar year. This performance standard applies to coal facilities commissioned after 1 July 2015 and units that have reached the end of their useful life. Temporary exemptions are available if units are designed, or can be retrofitted, to permit integration with CCS technology, provided certain implementation milestones are metFootnote 82. In 2014, the federal government and Nova Scotia signed an equivalency agreement where the provincial legislation regarding limits on greenhouse gas emissions, determined in tonnes of CO2, is considered equivalent to the corresponding provisions in the Canadian Environmental Protection Act and the Reduction Regulations, provided certain emissions limits are metFootnote 83.
- The first CCS-equipped coal-fired unit, with a capacity of 110 MW, started operating in 2014 at the Boundary Dam Power Station in Saskatchewan. Over the projection period, additional CCS facilities are built in Alberta and Saskatchewan, reaching nearly 1 300 MW of capacity in 2040. Much of the growth in CCS occurs after 2020, replacing retired coal units or as existing coal plant retrofits.
- In Ontario, all coal-fired power plants were retired as of 2014. Between 2015 and 2040, close to 5.6 GW of coal-fired capacity is expected to retire in Alberta, Saskatchewan, Manitoba and Nova Scotia. As a result, coal-fired generation declines from 70 TW.h in 2014 to 37 TW.h by 2040.
- By the end of the projection period, coal-fired generation remains in use only in Alberta, Saskatchewan, New Brunswick and Nova Scotia.
Natural Gas-Fired
- Several factors support a greater role for natural gas power generation in Canada, including low natural gas prices, lower GHG emissions compared to coal-fired power plants, and shorter construction times. In addition, natural gas generation benefits from lower upfront capital costs than coal-fired or nuclear power plants, the ability for capacity to be built in smaller increments to better match load growth, fast start-ups to meet load changes throughout the day, and a well-developed natural gas pipeline network in Canada.
- Total natural gas-fired capacity in Canada increases from 22 GW in 2014 to 38 GW by 2040, representing 40 per cent of all capacity additions over the projection period, excluding nuclear unit refurbishments. Natural gas-fired generation more than doubles over the projection period, rising from 63 TW.h in 2014 to 162 TW.h in 2040. The share of natural gas-fired generation increases from ten per cent in 2012 to 20 per cent in 2040.
- Natural gas-fired capacity increases in several provinces, with Alberta registering the largest increase due to the continued use of natural gas in cogeneration facilities for oil sands development and replacement of coal-fired units with natural gas-fired units.
Oil-Fired
- Oil-fired power plants accounted for 2.5 per cent of total Canadian installed capacity in 2014. These are used to generate electricity during peak demand periods or in areas where other generation options are not widely available, such as Yukon, NWT, and Nunavut.
- Total oil-fired capacity declines from 3.4 GW in 2014 to 2.7 GW in 2040. This reflects the retirements of aging units, which are being replaced by renewable power, natural gas or LNG-fired units when possible.
- Due to low utilization rate, oil-fired generation currently accounts for roughly half a per cent of total generation, and maintains a very small share over the projection period.
Net Exports and Interprovincial Transfers
- Canada is a net exporter of electricity. In 2014, Canada exported 59 TW.h of electricity, a six per cent decrease from 2013 when exports were at an all-time high. Provinces that export large amounts of electricity are usually those with predominantly hydro-based generation. Despite smaller export volumes in 2014, gross export revenue increased by 20 per cent. The majority of the revenue increase was recorded in the first quarter of 2014, which coincides with extremely cold weather and higher electricity prices in key electricity export markets in the U.S.
- In 2014, Canadian imports of electricity were 13 TW.h, their highest level since 2011. Net exports of electricity in 2014 were 46 TW.h.
- Over the projection period, Canadian exports will have to compete with growing renewable and natural gas-fired generation in the U.S. Net exports of electricity grow moderately over the projection period, reaching 48 TW.h in 2040 as shown in Figure 8.5.
Figure 8.5 - Net Exports of Electricity and Interprovincial Transfers, Reference Case
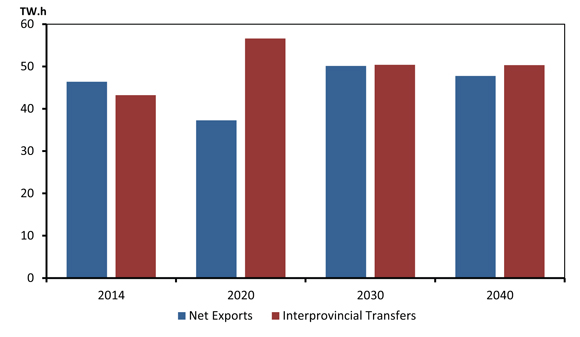
- Interprovincial electricity transfers grow over the projection period. In 2014 Ontario and Quebec signed a Memorandum of Understanding to exchange electricity capacityFootnote 84. Ontario will make 500 MW of electricity capacity available to Quebec in the winter, and Quebec will make 500 MW available to Ontario in the summer. In addition, the projections in EF 2016 assume that the Muskrat Falls hydro development in Labrador begins operating in 2018. Twenty per cent of the energy generated by Muskrat Falls will be reserved for Nova Scotia, and additional amounts will likely be available for transfers to Nova Scotia, the other Maritime provinces, or the U.S.
Key Uncertainties to the Outlook
- The U.S. power sector will undergo significant change over the projection period. In August 2015, the U.S. EPA released the final version of the CPP, which sets emissions reduction goals for 47 U.S. states. This proposal establishes state specific, rate-based goals for CO2 emissions from the power sector which aim to decrease GHGs from existing power plants by 32 per cent below 2005 levels by 2030. It also stipulates that states will be allowed to use Canadian imported power to meet their target goals; subject to some conditions. The impact of those rules on Canadian electricity exports represents a significant uncertainty for the electricity projections.
- In recent years solar PV has started to gain cost-competitiveness as costs for solar PV continue to declineFootnote 85. These improving economics are boosting solar investments. In 2014 Canada reached close to 1 400 MW of solar installed capacity, with the vast majority concentrated in Ontario. In 2014, Canada also added close to 1 700 MW of new wind capacity. New wind units are also improving with longer rotor diameter and tower height to increase potential power from each station. Further technological improvements, cost declines, and future policies could promote the development of non-hydro renewables beyond levels projected in this report.
- The northeastern U.S. is the largest recipient of Canadian electricity exports, receiving close to 35 TW.h, or almost 60 per cent of all exports. The majority of these exports are shared between the New England and New York markets. New England is highly dependent on natural gas-fired generation and with the region’s proximity to the Marcellus natural gas play, it could tap into this large and low cost natural gas resource. However, this has not materialized due to regional pipeline constraints which often result in natural gas price spikes in high demand winter months, making electricity imports from Canada attractive. If the region manages to overcome these pipeline constraints it could reduce its need for Canadian electricity exports.
- Large electricity projects are facing a wide range of uncertainties. Project costs, environmental regulations, government policies, and socioeconomic concerns will have implications for new and refurbished projects.
- Canadian renewable generation capacity grows over the projection period. However, the magnitude of the capacity growth does not have the same effect on generation due to low utilization rates from renewable units. Generation from solar and wind is dependent on weather conditions, and sudden changes in weather conditions can lead to disruptions in the availability of supply. Effective integration of these growing generation sources is becoming increasingly important.
- Storage technology could have a significant impact on electricity generation, transmission and distribution. Breakthroughs in reducing the cost of batteries could provide a more efficient platform for storing electricity during periods of low demand and dispatching the power during periods of high demand. Storage is also a key element in the implementation of decentralized systems where small-scale generation from renewables can be integrated into the power system without compromising reliability.
- Implementation of recent recommendations by Alberta’s climate advisory panel could accelerate the retirement of coal-fired generation facilities while boosting renewable growth. The recommendations include plans to retire all of Alberta’s coal-fired generating units by 2030 and replace the majority of the retiring coal units with renewables. These policy recommendations are not reflected in the projections in EF 2016.
Chapter 9. Coal Outlook
Content
- Coal is a large part of the global energy mix and represents about 29 per cent of global primary energy demandFootnote 86. Coal has met nearly half of the world’s energy demand growth over the past decade, almost all of which was attributable to rising demand from ChinaFootnote 87. Power generation accounts for two-thirds of coal consumption worldwide, with the remainder mainly used for steel manufacturing.
- Global coal prices have been declining since their 2011 peaks, mainly due to increased supply from the build-up in global production capacity that mostly occurred in AustraliaFootnote 88 as well as competition from shale gas as a fuel for the North American power market.
- Canada has about 6.6 billion tonnes of proven recoverable coal reserves, or 96 years of production at the current production rate. The great majority of Canadian coal resources are located in western Canada, but coal has also been produced in New Brunswick and Nova Scotia. In 2014, there were 19 operating coal mines in Canada, all in Western Canada.
- Total Canadian coal production in 2014 was 69 million tonnes; over 34.5 million tonnes of which is metallurgical grade coal, which is used for steel manufacturing.
- In Canada, thermal coal demand accounts for about 87 per cent of coal consumption in 2013, most of which is used for electric power generation. In the Reference Case, demand for thermal coal declines by an average of 2.4 per cent per year, or 18 million tonnes from 2014 to 2040. This decline more than offsets the increasing demand for coal in the industrial sector over the projection period.
- This declining demand for coal reflects retirements of coal-fired generation capacity and efficiency improvements from retrofits and new coal plants. Overall, Canadian demand for coal decreases from 42 million tonnes in 2013 to 26 million tonnes in 2040. In response to declining domestic demand, production of thermal coal in Canada falls from 38 million tonnes in 2014 to 19 million tonnes by 2040.
- Because recent low global prices are expected to persist due to oversupply, metallurgical coal production in Western Canada is expected to decline from 2014 to the early 2020s. Metallurgical coal production increases in the mid-2020s in response to higher global demand. Metallurgical coal production grows at of 0.5 per cent per year from 2023 to 2040.
- In the Reference Case, total Canadian coal production decreases from about 69 million tonnes in 2013 to 51 million tonnes in 2040, as shown in Figure 9.1. Combined with declining domestic demand, net exports of coal remain flat at 25 million tonnes in the Reference Case.
Figure 9.1 - Canadian Coal Production and Disposition, Reference Case

Key Uncertainties
- Coal-fired power generation represents the largest share of Canadian coal demand. As noted in Chapter 8, the Reduction Regulations require coal facilities commissioned after 1 July 2015 to meet emission standards but temporary exemptions are available if units are designed, or can be retrofitted, to permit integration with CCS technology, provided certain implementation milestones are met. More or less CCS-enabled coal plants than are included in the electricity projections would affect Canadian demand for coal.
- Global coal markets and price trends are a key uncertainty for Canadian coal exports. While many market observers expect coal prices to increase this decade, they currently remain near 10 year lows. If coal-importing countries shift further away from using coal, it is possible that prices would decrease further. However, faster growth in global coal demand for steel, olefin, and for electricity generation could lead to higher prices as well.
Chapter 10. Constrained Oil Pipeline Capacity Case
Content
Context
- Similar to previous editions of the Energy Futures Report, the Reference, High and Low Price cases in EF 2016 assume that energy infrastructure will be built as needed. This assumption holds true when energy infrastructure adequately responds to changes in supply and demand.
- In the case of crude oil, the ability of transportation infrastructure to keep pace with growing oil production is a key uncertainty. Recent events, such as the U.S. State Department’s determination that TransCanada’s Keystone XL project was not in the U.S. national interest, suggests that the assumption that oil pipeline infrastructure will be built as needed has not been accurate. It is uncertain if sufficient pipeline capacity will be in place to transport increasing western Canadian oil supply; leading many observers to question whether this assumption will hold in the future.
- Rapidly increasing tight oil supply in North America, combined with steadily increasing oil sands production, has created pipeline bottlenecks at key points in the North American pipeline system. These transport constraints, along with other factors such as refinery outages and geopolitical events, have led to periods in recent years where inland North American crude oil prices, such as WTI and Western Canadian Select (WCS), a Canadian heavy oil benchmark price, were traded at prices well below historical averages relative to Brent, a key global oil benchmark price.
- Figure 10.1 compares the average price differential between various North American crudes and Brent from 2007 to 2010 and 2011 to 2014. Since 2011, WTI and WCS prices have faced much higher discounts to Brent than they have previously. Prices for crude in locations that are linked to the international marketplace via access to coastal ports, such as Louisiana Light Sweet in the U.S. Gulf Coast, tracked international oil prices more closely. The Mayan crude price, a benchmark price for heavy oil produced in Mexico, is also included in Figure 10.1. Mayan Heavy represents crude with quality similar to WCS, but with greater access to international oil markets.
Figure 10.1 - Benchmark Oil Prices and Price Differentials (US$/barrel)
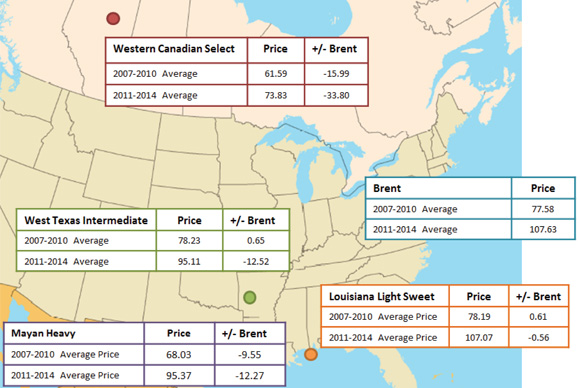
- Given expected growth in oil production from western Canada, there are proposals to increase pipeline export capacity for crude oil. However, these projects have proven controversial and there have been delays from the original planned in-service dates. There is considerable interest from various groups with concerns ranging from the safety of pipelines to their impact on the environment. Several proposed projects are either under regulatory assessment or have yet to meet the conditions of approval required to begin construction.
Proposed Export Pipelines and Alternatives
- Four pipelines have been proposed to deliver crude oil out of western Canada:
- Keystone XL: TransCanada’s Keystone XL project was a proposed 132 10³m³/d (830 Mb/d) pipeline from Hardisty, Alberta to Steele City, Nebraska with a Gulf Coast section from Cushing, Oklahoma to Houston and Port Arthur, TexasFootnote 89. The Gulf Coast section is in service. The Canadian portion of the pipeline was approved by the NEB in March 2010Footnote 90. In early November, the U.S. Department of State determined the project would not be in the U.S. national interest and did not approve TransCanada’s application for a Presidential Permit, which is required for pipelines that cross an international borderFootnote 91. The fate of Keystone XL is currently unclear.
- Northern Gateway: Enbridge’s Northern Gateway project proposes an 83 10³m³/d (525 Mb/d) oil pipeline from Edmonton, Alberta to Kitimat, B.C., and a 31 10³m³/d (193 Mb/d) condensate pipeline that runs in the opposite directionFootnote 92. The hearing process received considerable interest, with 218 intervenors and over 9 000 letters of comment. The project was recommended by the Joint Review Panel in December 2013 with 209 conditions that Enbridge must meet in order to build the pipeline and put the pipeline into serviceFootnote 93. Stakeholder opposition remains high, there are numerous court challenges and there are conditions that must be satisfied before construction can begin.
- Trans Mountain Expansion: Kinder Morgan’s proposal to expand the Trans Mountain pipeline would add an additional 94 10³m³/d (590 Mb/d) of capacity to the pipeline that already runs from Edmonton to Burnaby, B.C.Footnote 94 The proposal is currently being assessed by the NEB and the proceedings have received a great deal of public interest. Over 400 intervenors and 1 250 commenters are involved in the process.
- Energy East: TransCanada’s proposed Energy East project is a 175 10³m³/d (1 100 Mb/d) pipeline from Hardisty, Alberta to St. John, New BrunswickFootnote 95. It is also being assessed by the NEB.
- In addition to these four proposals, Enbridge has proposed a multi-faceted Mainline expansion project. The Enbridge Mainline starts in Edmonton, Alberta and delivers oil to interconnected pipelines and refineries in the U.S. Midwest and eastern Canada. The expansion project includes several de-bottlenecking initiatives on the U.S. portion of its system, including SeawayFootnote 96, Flanagan SouthFootnote 97, Line 61Footnote 98, the replacement of Line 6Footnote 99, and the Sandpiper projectFootnote 100. In Canada, Enbridge has recently increased capacity on its Line 67Footnote 101, also referred to as Alberta Clipper, and has applied to the NEB to replace its Line 3Footnote 102. Enbridge has approvals from Canadian authorities for the Alberta Clipper expansion, but the U.S. portion of the second phase of the project is under review by U.S. authorities.
- Figure 10.2 illustrates the current and recently proposed pipelines and their capacities. Recently proposed pipeline projects (Northern Gateway, Energy East, and Keystone XL) are reflected by dashed lines, while proposed capacity expansions for existing pipelines (Trans Mountain Expansion and the various Enbridge projects) are noted in the descriptions.
Figure 10.2 - Existing and Recently Proposed Crude Oil Pipelines

| Pipelines, Expansions or Modifications | Notes | |
|---|---|---|
| A | Keystone XL (TransCanada) | New pipeline, proposed - 132 10³m³/d (830 Mb/d), proposal denied by the U.S. State Department, November 2015 |
| B | Northern Gateway (Enbridge) | New pipeline, proposed - 83 10³m³/d (525 Mb/d) crude export pipeline, 31 10³m³/d (193 Mb/d) condensate import pipeline |
| C | Trans Mountain Expansion (Kinder Morgan) | Expansion, proposed - 94 Mb/d (590 Mb/d) |
| D | Energy East (TransCanada) | Natural gas pipeline conversion and new pipeline, proposed - 175 10³m³/d (1 100 Mb/d) |
| E | Alberta Clipper Expansion, Phase II (Enbridge) | Expansion, completed - capacity increase of 37 10³m³/d (230 Mb/d) |
| F | Line 3 Replacement (Enbridge) | Replacement, proposed - capacity recovery/increase of 59 10³m³/d (360 Mb/d) |
| G | Seaway (Enterprise and Enbridge) | Reversal and twinning of existing pipeline, completed - 135 10³m³/d (850 Mb/d) |
| H | Flanagan South (Enbridge) | New pipeline, completed - 93 10³m³/d (585 Mb/d) |
| I | Line 61 Upgrade Project (Enbridge) | Expansion, completed - capacity increase of 25 10³m³/d (160 Mb/d) |
| J | Line 6B Replacement (Enbridge) | Replacement, completed - capacity increase of 41 10³m³/d (260 Mb/d) |
| K | Sandpiper (Enbridge) | New pipeline, proposed - 36 10³m³/d (225 Mb/d) |
| Existing Western Canadian Export Pipelines | Enbridge Mainline (L), Keystone (M), Express (N), Rangeland/Milk River (O) |
- Crude-by-rail is another option for moving crude oil out of western Canada. Pipeline bottlenecks, infrastructure constraints, and the resulting wider price differentials have encouraged oil shippers to seek alternative means of transportation. This has led to an increase in the volume of crude transported by rail in both Canada and the U.S. The current estimated rail loading capacity for oil in western Canada is over 159 10³m³/d (1 MMb/d).
Constrained Case: Overview and Assumptions
- EF 2016 explores the uncertainty related to future oil transportation infrastructure by developing an additional sensitivity case: the Constrained Oil Pipeline Case (Constrained Case).
- It is important to note that the pipelines that are built, or not built, in the Constrained Case are assumptions and not the Board’s view on whether the pipelines will be approved pursuant to the NEB Act or will be built. These assumptions allow for analysis of other key outcomes, such as crude oil production, volumes of crude oil shipped by rail, and energy demand. The inclusion in this analysis of Enbridge’s Line 3 replacement, which is currently before the Board, is strictly a theoretical exercise and is in no way related to the regulatory proceedings before the Board and has no bearing on whether that application should be approved pursuant to the NEB Act.
- The Constrained Case explores the effect on Canada’s energy system if none of the following major proposed export pipelines are built: Keystone XL, Northern Gateway, Trans Mountain Expansion, and Energy East. This case assumes that the Enbridge Mainline expansions and crude-by-rail are the only options available to increase crude oil export capacity.
- The Constrained Case assumes that the planned expansions to Enbridge’s Mainline are completed, increasing Enbridge’s capacity to 460 10³m³/d (2.9 MMb/d) by 2019. Phase II of the Alberta Clipper expansions began in July 2015 and, for the purposes of this analysis, the capacity increase resulting from the Line 3 replacement is assumed to be in place in 2019.
- This analysis assumes that existing Canadian crude oil export pipelines are utilized at 85 to 90 per cent of their capacity over the projection period, based on respective historical utilization rates. If the assumed Enbridge expansions are completed, total pipeline capacity out of western Canada would be about 631 10³m³/d (4.0 MMb/d) for the 2019 to 2040 period.
- Beyond the Mainline expansion, the Constrained Case assumes that rail capacity can grow to meet the demand of oil exporters. This assumption appears to be realistic given that the current estimated rail loading capacity in western Canada is over 159 10³m³/d (1 MMb/d), roughly quadruple the peak crude-by-rail movements to date. Further, historical examples, such as those identified in the U.S. Department of State’s Keystone XL Draft Supplementary Environmental Impact StatementFootnote 103, suggest that the railroads will be able to expand their service capacity to meet growing crude-by-rail requirements. Although rail capacity can expand, it is a more expensive form of transportation which has implications for the prices oil producers receive net of transportation costs, as discussed in the next section.
- This analysis also includes a variety of assumptions regarding potential markets for Canadian crude oil. In general, it assumes that the U.S. Gulf Coast will be the primary market for growing heavy crude exports, and that light crude oil exports compete with Bakken oil supply in the Midwest and East Coast markets.
- Refineries in the U.S. Midwest, or PADD (Petroleum Administration for Defense Districts) II, receive the majority of the oil exported from Canada. These refineries’ capacity to consume heavy crude oil is already almost fully utilized. Some planned upgrades to U.S. Midwest refineries could increase heavy refining capacity, however the lower prices for light oil has led to some announced delays to refiners’ coking capacity projects. In Alberta, the North West Redwater Partnership upgrader project will add about eight 10³m³/d (50 Mb/d) of bitumen demand in 2018. The combined additional bitumen demand in Alberta and the U.S. Midwest by 2018 is less than the projected growth in Canadian heavy oil production over the same period. This suggests that additional oil production will need to find alternate markets, namely the U.S. Gulf Coast refineries in PADD III.
- Some heavy oil is currently exported to the U.S. East Coast, and the refineries on the U.S. West Coast also have significant heavy oil refining capacity at about 83 10³m³/d (520 Mb/d). This analysis assumes that increasing amounts of Canadian oil are exported by rail to the U.S. West Coast. However, the primary market for Canadian heavy oil throughout the projection period is the Gulf Coast.
- Refineries in the U.S. Gulf Coast consumed over 318 10³m³/d (2.0 MMb/d) of heavy crude oil in 2014, most of which was supplied by Venezuela and Mexico. Canadian crude oil exports to the U.S. Gulf Coast averaged over 52 10³m³/d (330 Mb/d) in the first quarter of 2015, an increase of over 32 10³m³/d (200 Mb/d) from the same period in 2014. This increase was the result of increased pipeline access to the region. Almost all of these exports to the Gulf Coast were heavy crude oil.
Results
- The assumptions of the Constrained Case have implications for Canada’s energy system. Reliance on a more costly form of transportation such as rail, as well as increased competition for market share and pipeline capacity, leads to lower prices received by Canadian producers, net of transportation costs. This leads investment, crude oil production, economic growth, energy use, and GHG emissions to grow more slowly than in the Reference Case. These impacts are summarized in Figure 10.3, and further details on each of these dynamics are provided below.
Figure 10.3 - Summary of the Impact of the Constrained Case on Canada’s Energy System
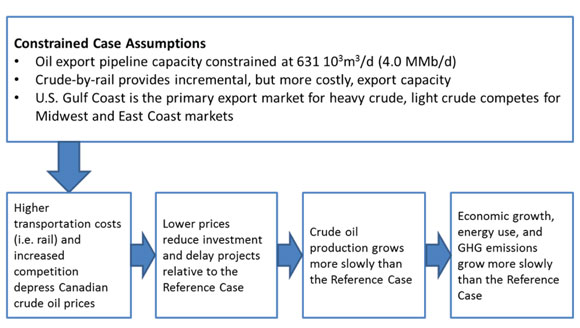
Canadian Crude Oil Net-Back Prices
- The Constrained Case assumptions underlie the net-back prices estimated to be received by Canadian oil producers. In the oil market, the market price is set by the price of the marginal or last barrel that is bought and sold. The net-back price for crude oil is usually determined by this price, minus transportation costs.
- For this analysis, the net-back price refers to benchmark Canadian crude oil prices: WCS, a heavy grade, and Mixed Sweet Blend (MSW), a light, sweet grade. Benchmark prices generally indicate the prices received by Canadian producers.
- The price projections for WTI and Brent in the Constrained Case are the same as in the Reference CaseFootnote k. However, Canadian net-back prices, WCS and MSW, are lower in the Constrained Case when export pipeline capacity is insufficient to transport supply.
- In the Reference Case, the WCS price is assumed to be approximately 82 per cent of the WTI price, which accounts for unconstrained transportation costs and the difference in quality between WCS and WTI. For the Constrained Case, in years when the pipeline capacity is insufficient to move oil supply, the WTI-WCS differential widens relative to the Reference Case by about US$10/bbl. This is the approximate extra cost that would be incurred to transport Canadian heavy crude to the U.S. Gulf Coast by rail instead of by pipeline.
- For light oil, the WTI-MSW price differential is US$5.50/bbl in the Reference Case. This is approximately the transportation cost to ship light crude oil from Edmonton to Cushing, Oklahoma
- In the Constrained Case, the WTI-MSW differential increases relative to the Reference Case by about another US$5/bbl, starting in 2021. The U.S. has an abundant supply of domestic light crude oil. In this analysis, when light oil transportation capacity is insufficient, MSW must decline to compete for market share with oil from the U.S. Bakken transported on the Enbridge pipeline system.
- Figure 10.4 illustrates the price projections used in the Constrained Case compared to the Reference Case oil price projections. In the Constrained Case WCS reaches US$60/bbl in 2025, six years later than in the Reference Case.
Figure 10.4 - Crude Oil Price Projections, Reference and Constrained Cases
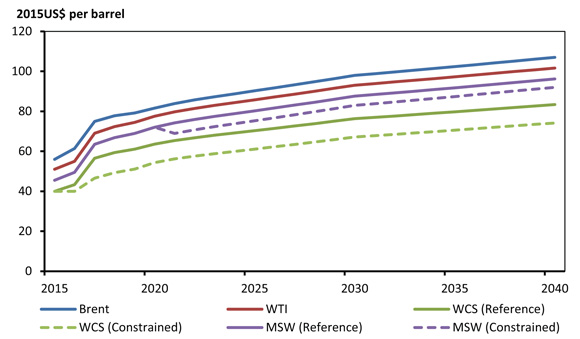
Capital Expenditures
- The lower WCS and MSW prices in the Constrained Case reduce oil-directed capital expenditure in western Canada. Delays to project start-up dates for some oil sands projects are also incorporated in the medium term. Over the projection period capital expenditures are reduced by 15 per cent in the conventional oil sector, and by nine per cent in the oil sands, as shown in Table 10.1.
Table 10.1 - Cumulative Oil-Directed Capital Expenditures in Western Canada, 2015 to 2040
| (Billions of 2014$) | Reference | Constrained | Difference |
|---|---|---|---|
| Conventional | 314 | 268 | -46 |
| Oil Sands | 655 | 595 | -60 |
| Total | 969 | 863 | -106 |
Crude Oil Production
- In the Constrained Case, Canadian crude oil production continues to grow. However, delayed projects and reduced investment over the projection period reduce total Canadian crude oil production in 2040 by about 80 10³m³/d (506 Mb/d), or eight per cent, compared to the Reference Case. About 84 per cent of the difference is due to reduced bitumen production, with the remainder attributed to lower conventional production.
- As shown in Figure 10.5, oil sands production is affected the most. This is because oil sands, and particularly in situ, represents the bulk of production growth over the projection period. Conventional oil production and total bitumen production are reduced by similar rates.
Figure 10.5 - Western Canadian Crude Oil Production, Reference and Constrained Cases
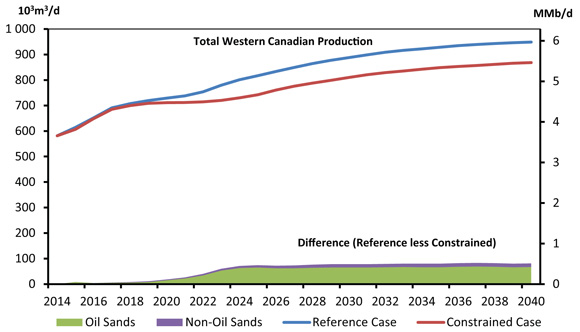
- Figure 10.6 shows the difference in percentage between in the Constrained Case compared to the Reference Case for various types of western Canadian oil production.
Figure 10.6 - Percentage Difference in Western Canadian Oil Production, Constrained Case Compared to the Reference Case
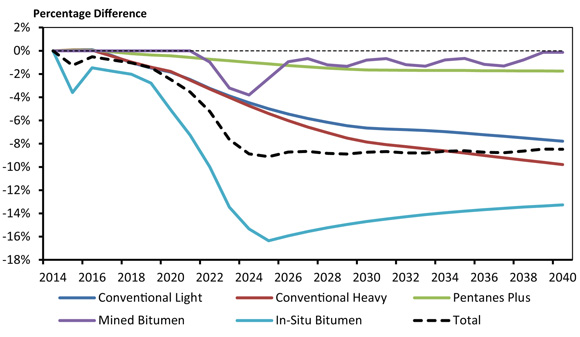
Net Available Oil Supply for Export, Oil Export Capacity and the Need for Rail
- The oil exports in the Constrained Case are based on projected crude oil production, need for diluent, and domestic refinery consumption. If heavy oil and bitumen are moved by rail, the need for diluent for blending is less than for oil transported by pipeline. Thus, the total diluent required for blending varies with the proportion of rail versus pipeline. Domestic refinery consumption of crude oil is the same as in the Reference Case.
- Figure 10.7 compares the oil exports to the total capacity of oil export pipelines. This suggests that there will be a need for rail to transport growing western Canadian oil supply. By 2040, WCSB oil supply grows to over 800 10³m³/d (5.0 MMb/d), and the corresponding requirement for rail would be about 198 10³m³/d (1.2 MMb/d).
Figure 10.7 - Canadian Oil Export Pipeline Capacity and Oil Exports
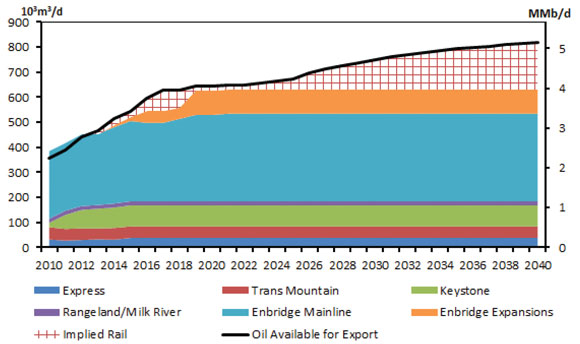
- Production of condensates in western Canada in 2040 is slightly lower in the Constrained Case than in the Reference Case. In both cases, there is greater demand for condensates than there is domestic production. Due to less oil production and more crude-by-rail transportation, the need for imported condensates in 2040 is reduced from about 127 10³m³/d (800 Mb/d) in the Reference Case to about 104 10³m³/d (654 Mb/d) in the Constrained Case.
Energy Consumption
- The changes to production projections in the Constrained Case impacts the amount of energy used for crude oil production, processing and transportation. The growth rate of oil production and investment affects the broader economy, which in turn also affects energy use, especially in Alberta.
- In the Constrained Case, energy use in oil sands, including upgrading, is 2 185 PJ by 2040, eight per cent lower than in the Reference Case. In the conventional sector, energy use is 175 PJ by 2040 or six per cent lower than in the Reference Case.
- In terms of the effect on economic growth and energy use in Canada, the largest impact is in Alberta, with real GDP in 2040 1.7 per cent lower compared to the Reference Case.
- Figure 10.8 shows the range of total energy use in Canada in the Reference and Constrained cases. Total energy use in the Reference Case reaches 16 233 PJ by 2040. In the Constrained Case, energy use grows slightly slower, reaching 15 887 PJ by 2040.
Figure 10.8 - Total Canadian Energy Demand, Reference and Constrained Case
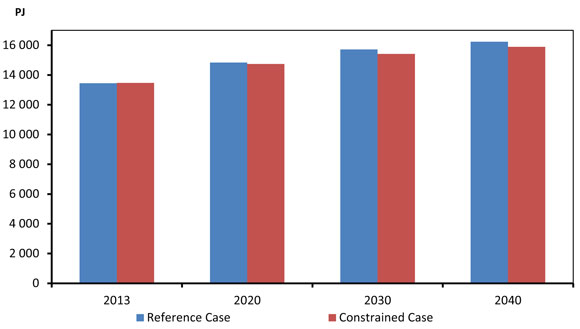
- This analysis does not consider the global implications of the Constrained Case. In this case, the amount of crude oil available to the global economy from Canada would be lower compared to the Reference Case. However, some analysis suggests that lower Canadian oil production results in a global price for crude oil that is slightly higher than if Canadian production was higherFootnote 104. This analysis suggests that a marginal increase in price would encourage additional production from other regions of the world that would not have been produced otherwise.
Key Uncertainties
- While the use of rail to export crude oil in the Constrained Case is not far above the estimated capacity of existing crude loading terminals in western Canada, it is roughly quadruple the peak crude-by-rail movements in Canada to date. Considerable growth in the rail industry’s services would be needed to accommodate these projected volumes. Potential issues include railway and terminal bottlenecks, tanker car shortages, and competition with other commodities for transportation services. Expansion of rail capacity to meet these volumes is uncertain.
- When determining net-back prices, the Constrained Case maintains the key assumption that markets will continue to exist for Canadian energy exports. The net-back prices used in the case are based on expected demand in U.S. refining markets and the cost to transport oil from the WCSB to those markets. The growth of competing sources of oil and the pricing strategies of other producers will affect the ability of Canadian oil to reach markets in the U.S. and abroad. If U.S. demand for Canadian blended bitumen at the projected prices is less than the supply increase in the Constrained Case, Canadian heavy oil would be more highly discounted. The higher discounts could either entice more U.S. refineries to purchase Canadian crude, or could result in costly shipments to alternative markets. Higher price discounts and lower net-backs would decrease total crude oil production.
- Many analysts expect that Canadian heavy crude oil will continue to gain market share in the U.S. Gulf Coast, displacing heavy crude oil currently supplied by Mexico, Venezuela, and Saudi Arabia. However, several refineries in the region are either partially or wholly owned by the national oil companies from these countries. Going forward, the degree to which Canada will capture market share is uncertain.
Chapter 11. Liquefied Natural Gas Export Cases
Context
- As noted earlier, LNG is natural gas that is cooled to -162°C, at which point it becomes a liquid. In its liquid form, it is much more energy-dense, making it economic to ship in specially designed vessels and vehicles.
- LNG has been traded globally since the mid-1960s. Since then, the volume of global LNG trade has increased steadily to an estimated 241 million tonnes per annum (MMtpa) in 2014Footnote 105. In gaseous form, this is approximately equivalent to 911 106m³/d (32 Bcf/d), nearly 10 per cent of annual global natural gas consumption.
- In BP’s Energy Outlook 2035, LNG trade is forecast to grow at an average rate of 4.3 per cent per yearFootnote 106, more than doubling from current levels to reach nearly 2.6 109m³/d (80 Bcf/d) by 2035. BP expects the largest market for LNG demand growth to be the Asia Pacific region, which was the largest importer of LNG in 2014Footnote 107.
- Several natural gas producing nations have a significant interest in increasing LNG export capability. Numerous projects are currently under construction in Australia, Russia, and MalaysiaFootnote 108.
- In the U.S., several LNG export projects have received regulatory approval and are moving ahead with constructionFootnote 109. Cheniere Energy’s Sabine Pass facility is the closest to completion and the company expects to begin producing LNG by the end of 2015Footnote 110. Several other export projects are under construction and will add to U.S. LNG export capacity over the next five years. In AEO 2015, the U.S. EIA forecasts net LNG exports to reach 255 106m³/d (9.0 Bcf/d) by 2030Footnote 111.
- There is also considerable interest in exporting LNG from Canada and several export facilities have been proposed. As of early October 2015, the NEB has approved 23 applications for long-term LNG export licences, and another seven applications are before the Board. The cumulative total volume of the granted licences is 358.4 MMtpa, a gaseous equivalent of 1 277 106m³/d (45 Bcf/d)Footnote 112. This volume is more the total amount of LNG currently traded globally. As noted in a recent decision issued by the NEB on an export application, it is unlikely that all LNG export licences issued by the Board will be used or used to their full allowanceFootnote 113.
- The majority of the proposed Canadian projects plan to export LNG from the B.C. Coast. The source of natural gas feedstock for these projects would be western Canadian natural gas supplies. There are also current proposals to export LNG from Nova Scotia, New Brunswick, and QuebecFootnote 114. Natural gas for these projects could be sourced from western Canada, the U.S. Northeast and possibly from East Coast offshore production.
- While several projects are actively working towards exporting LNG from Canada, as of September 2015 no proponents have proceeded beyond the approval stage and have begun construction.
- The Pacific Northwest LNG Project is a proposed LNG export facility located near Prince Rupert, B.C.Footnote 115 and announced a positive conditional final investment decision in June 2015Footnote 116. These conditions include approval of a project development agreement with the Government of B.C. and a positive regulatory decision on the project’s environmental assessment by the federal government. The project has an export licence from the NEB for 19.7 MMtpa of LNG, or approximately 78 106m³/d (2.74 Bcf/d) in gaseous formFootnote 117.
- There is considerable uncertainty regarding how much LNG will be exported from Canada. The numerous projects currently under construction around the world could provide sufficient capacity to meet global LNG demand for many years to come, leaving limited room for Canada in the market. However, Canada’s advantageous location relative to the Asian market, and its abundant natural gas supplies could make it a competitive player in the global LNG market.
- Other uncertainties that could impact Canada’s future LNG export volumes include North American and global natural gas prices, crude oil prices, the pace of global LNG demand growth, and the ability of LNG proponents to address environmental and social concerns.
High LNG and No LNG Cases: Overview and Assumptions
- Given the level of uncertainty related to Canadian LNG exports, EF 2016 explores the implications of higher and lower LNG exports from the B.C. Coast with two sensitivity cases: the High LNG and No LNG cases.
- The LNG cases vary the assumed LNG export volumes in the Reference Case to assess the effect on the Canadian energy system. The Reference Case assumes LNG exports from the B.C. Coast start in 2019 and increase by 14 106m³/d (0.5 Bcf/d) per year to reach 71 106m³/d (2.5 Bcf/d) by 2023. The High LNG Case increases LNG exports at a faster pace than in the Reference Case, reaching 113 106m³/d (4.0 Bcf/d) by 2022 and then slowly increasing to 170 106m³/d (6.0 Bcf/d) by 2030. The No LNG Case assumes that no LNG exports occur over the projection period. Figure 11.1 illustrates the assumed LNG export volumes in the Reference, High LNG and No LNG cases.
Figure 11.1 - Assumed LNG Export Volumes, Reference, High and No LNG Cases
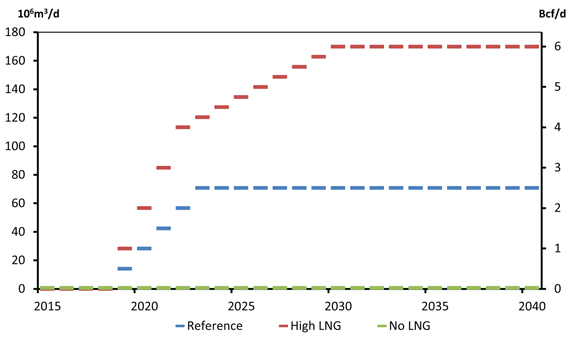
- The volumes of LNG exports are assumptions and do not represent the Board’s view on future LNG exports. This assumption enables the analysis of other key outcomes, such as natural gas production, energy demand and macroeconomic projections.
- None of the LNG volumes assumed in the Reference and High LNG cases include LNG exports from the Maritimes or Quebec.
- The LNG export volumes in the Reference and High LNG cases are not associated with any specific proposed LNG project. Instead, generic LNG facilities were developed for use in this analysis with common characteristics of existing well-defined projects.
- Several proponents of well-defined LNG export proposals on the B.C. Coast own significant natural gas assets in western Canada. Most of the well-advanced projects plan to source the majority of their natural gas feedstock from their own natural gas reserves, or corporate reserves. These project proponents will directly increase or decrease drilling activity and production in response to higher or lower LNG export volumes.
- While the majority of natural gas feedstock would be sourced from proponents’ upstream assets, some feedstock would be purchased from the domestic natural gas market. Most proposed LNG projects are structured to allow access to major natural gas pipeline networks in western Canada. This access enables LNG proponents to buy natural gas when needed. In addition, several smaller LNG export facilities have been proposed that do not intend to produce their own natural gas. These facilities plan to purchase their natural gas feedstock directly from domestic markets.
- The generic LNG facilities assumed in the Reference and High LNG cases are supplied by roughly 85 per cent natural gas produced from corporate reserves. The remaining natural gas is sourced from domestic market purchases.
- Broader impacts that may be implied from the LNG volume assumptions are excluded from consideration in this analysis. For example, the High LNG Case could imply that demand for energy in Asia is higher, possibly due to stronger economic growth in that region. This higher economic growth could increase the demand, and prices, for other exported Canadian goods in that region, which would also affect the Canadian economy and energy system.
Results
Natural Gas Production
- Altering assumed LNG export volumes has substantial impact on the natural gas production projections. As shown in Figure 11.2, natural gas production in the Reference Case reaches 506 106m³/d (18 Bcf/d) in 2040, 614 106m³/d (22 Bcf/d) in the High LNG Case, and 437 106m³/d (15 Bcf/d) in the No LNG Case.
Figure 11.2 - Total Natural Gas Production, Reference, High and No LNG Cases
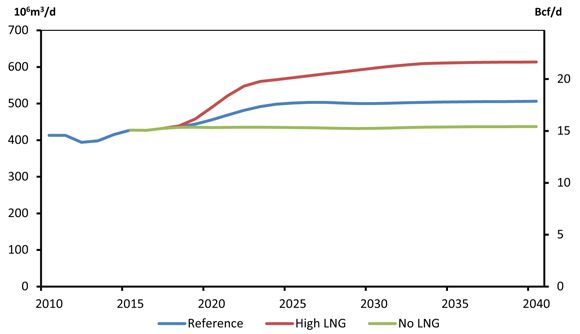
- The corporate reserves of LNG proponents are largely located in emerging tight and shale natural gas producing regions, many of which are located in B.C. Several proposals, including Pacific Northwest LNG, have plans to source their natural gas feedstock from the Montney, which is located primarily in Northeast B.C. and extends into Alberta. A recent assessment found that the marketable ultimate potential of natural gas in the Montney was 12 719 109m³ (449 Tcf)Footnote 118.
- Approximately 93 per cent of natural gas produced from corporate reserves in the Reference Case is produced in the Montney by the end of the projection period. LNG proponents are also considering producing in other regions in B.C., including the Horn River Basin, Liard Basin, and Cordova Embayment. The remaining seven per cent is sourced from these shale natural gas plays. Figure 11.3 shows production from the Montney, both the B.C. and Alberta portions, and combined production from the Horn River, Liard and Cordova plays.
Figure 11.3 - Natural Gas Production by Producing Region, Reference, High and No LNG Cases
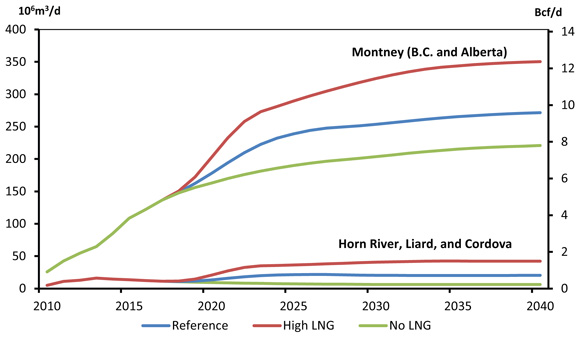
Energy Consumption
- LNG export facilities require considerable amounts of energy, especially for cooling natural gas. In addition, increases in production resulting from LNG exports affects the amount of energy used for natural gas drilling, processing, and transportation by pipeline. Also, the pace of development of LNG affects the broader economy, which in turn affects energy use, especially in B.C.
- In this analysis, the liquefaction process is largely powered by a portion of the facilities’ natural gas supply. Auxiliary power requirements, such as for lighting and non-cooling equipment, are met by grid-purchased electricity. Energy consumption by LNG facilities in the Reference Case in 2040 is 53 PJ of natural gas and six PJ of electricity, or about three per cent of B.C.’s total end-use demand. In the High LNG Case, LNG facilities use 130 PJ of natural gas and 15 PJ of electricity by 2040. There is no liquefaction demand in the No LNG Case.
- To help meet the additional electricity requirements for LNG facilities, two 100 MW natural gas-fired combined cycle units come online in 2019 and 2021 in the Reference Case. In the High LNG Case, two 200 MW natural gas-fired combined cycle units come online in 2019 and 2021. In the No LNG Case, this capacity is not added.
- The energy used for natural gas drilling and processing varies significantly between the cases. Energy use in B.C.’s natural gas production and pipeline sectors in the High LNG Case is 410 PJ, or 40 per cent higher than in the Reference Case, and 220 PJ in the No LNG Case, or 25 per cent lower than in the Reference Case by 2040.
- The level of LNG exports affect the wider economy, especially in B.C., and differences in economic growth affects energy use in other sectors. In the High LNG Case, Real GDP in B.C. in 2040 is 4.5 per cent higher than the Reference Case. In the No LNG Case it is 3.3 per cent lower than the Reference Case in 2040.
- Figure 11.4 shows the range of total energy use in B.C. in the Reference and the LNG cases. Total energy use in B.C. in the Reference Case grows by 1.0 per cent per year from 2014 to 2040, reaching 1 669 PJ by 2040. In the High LNG Case, energy use grows by 1.4 per cent per year over the projection period and by 0.6 per cent in the No LNG Case. Total demand by 2040 in the High LNG Case is 1 894 PJ and 1 507 PJ in the No LNG Case.
Figure 11.4 - Primary Energy Demand in B.C., Reference, High and No LNG Cases
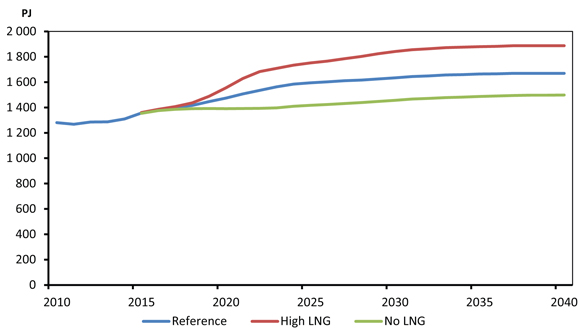
- The effect on Alberta energy demand is much smaller than in B.C., as the production impacts are less significant and the economic effect of investments in LNG facilities is specific to B.C. Total demand in Alberta in the High LNG Case is 6 197 PJ in 2040, compared to 6 139 PJ in the Reference Case, and 6 117 PJ in the No LNG Case.
- The overall effect of the LNG cases on total Canadian demand relative to the Reference Case is modest. In 2040, Canadian primary demand in the High LNG and No LNG cases is within one per cent of the Reference Case.
Key Uncertainties
- The timing of LNG exports will likely differ from the expansion of export volumes in the Reference and High LNG Case. Some market observers have suggested that Canada is more likely to start exporting LNG in the 2030s as LNG producers in countries like the U.S., Russia, and Australia are well positioned to meet global demand until then. Changing the start dates of LNG exports would shift the production and economic effects of LNG to earlier or later in the projection period.
- The total volume of LNG exports in the High LNG Case could be higher than this analysis assumes because future global demand for LNG is uncertain. Higher LNG export demand would further increase natural gas production.
- These sensitivities do not consider the effect of potential LNG exports from the U.S. Pacific Northwest. The NEB has approved long-term export licences to ship natural gas by pipeline to two proposed projects located in Oregon. It is unclear if Canadian natural gas would be the primary feedstock for these projects, as they could also access natural gas sources in the U.S. Exports of LNG from the Pacific Northwest would increase demand in a market relatively close to western Canadian production and would likely increase Canadian natural gas production. The magnitude of this increase depends on factors such as pipeline infrastructure and comparative supply costs of Canadian and nearby U.S. production.
- This analysis does not consider LNG exports from Quebec or the Maritimes. Five applications to export LNG from the East Coast have been submitted to the NEB and as of September 2015, four of these applications have been approved by the Board. These projects could encourage higher eastward flows of natural gas from western Canada, additional imports of natural gas from the U.S. Northeast, or additional natural gas production in the Maritimes.
- The LNG assumptions in EF 2016 do not predict which facilities among existing LNG export proposals are built, but instead assumes exports from generic facilities. If the facilities that are eventually built differ significantly from those in this report, the effect on the energy system could be quite different than shown in these sensitivities.
Chapter 12. Greenhouse Gas Emissions Outlook
Content
Energy Consumption and GHG Emissions
- Given the prevalence of fossil fuels in the Canadian and global energy mix, energy use and GHG emissions are directly related. The majority of GHGs emitted in Canada result from the combustion of fossil fuels. Fossil fuels include crude oil, natural gas, coal, and refined petroleum products such as gasoline and diesel. They provide the vast majority of energy used to heat homes and businesses, transport goods and people, and power industrial equipment. Emissions from the combustion of fossil fuels, including those used for the production of energy, accounted for 81 per cent of Canadian GHG emissions in 2013Footnote 119. The remaining emissions are from non-energy sources such as agricultural and industrial processes, and waste handling.
- Environment and Climate Change Canada publishes Canada’s official GHG projections in its Canada’s Emission Trends reportFootnote 120 and also in Canada’s Biennial Report to the United Nations Framework Convention on Climate ChangeFootnote 121 (UNFCCC). Much like the analysis in EF 2016, the Environment and Climate Change Canada projections include policies and programs that were in place at the time of analysis.
- Between 2005 and 2013, Canada’s total GHGs dropped by three per cent, or 23 Megatonnes (MT), as shown in Figure 12.1. During this period, GHGs from electricity generation dropped by 30 per cent. This decline can be attributed to a reduction in traditional coal-fired generation and a growing, diverse supply of renewable generation. Increased oil production led to growth in GHGs from the oil and gas sector despite improved efficiency in oil production techniquesFootnote 122. There is also a noticeable decline in other industrial emissions, partly due to declining activity caused by the 2008-2009 global economic downturn.
Figure 12.1 - Canadian Emissions by Sector, 2005 and 2013
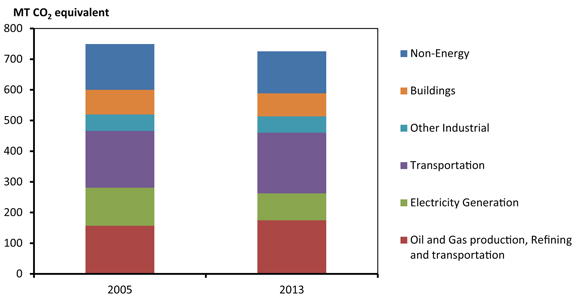
Source: Source: Environment and Climate Change CanadaFootnote 123
- The amount of GHGs emitted by the various services which fossil fuels provide depends on how efficiently the fuel is used, and the emission content of the fuel. Not all fossil fuels produce the same amount of GHG emissions when they are converted to energy. The amount of GHG emissions produced depends on the carbon content of the fuelFootnote 124. Natural gas for example, emits slightly more than half the CO2 emitted by coal to produce the same amount of energy, as shown in Figure 12.2.
Figure 12.2 - Estimated Emission Intensities for Various Energy Sources
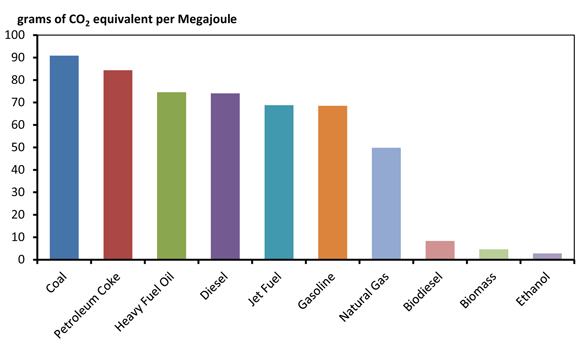
Source: Source: Environment and Climate Change CanadaFootnote 125
Fossil Fuel Use Outlook
- The Reference Case projection for total fossil fuel energy consumption is shown in Figure 12.3. From 2014 to 2040, the use of fossil fuels increases by 22 per cent, an average of 0.8 per cent per year. Natural gas leads this growth, led by increasing demand in the oil and natural gas production sector, and for electricity generation. Consumption of RPPs and NGLs grow modestly over the projection period, increasing at an average of 0.1 per cent per year. The use of coal declines over the projection, driven by the replacement of retired coal units with less emission-intensive forms of generation as discussed in Chapter 8. Further, some of the coal demand that remains is related to CCS units, where the vast majority of emissions are sequesteredFootnote l.
Figure 12.3 - Total Demand for Fossil Fuels, Reference Case
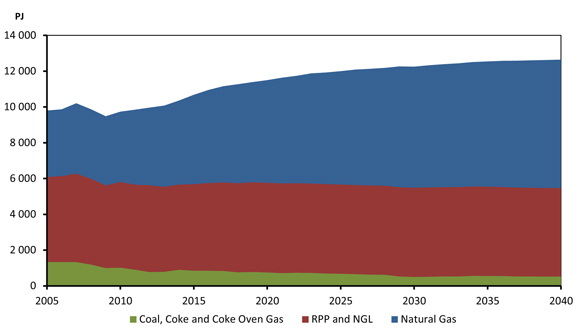
- As different fossil fuels emit different amounts of GHGs, the relative shares of various fuels influence the GHG emissions resulting from fossil fuel consumption. Faster demand growth in lower GHG intensity natural gas and declining coal consumption results in declining average GHG emissions per unit of fossil fuel energy consumed. The estimated weighted-average emission intensity (grams of CO2 equivalent per MJ) declines by approximately six per cent over the projection period, as shown in Figure 12.4.
Figure 12.4 - Estimated Weighted-Average Fossil Fuel Emission Intensity, Reference Case
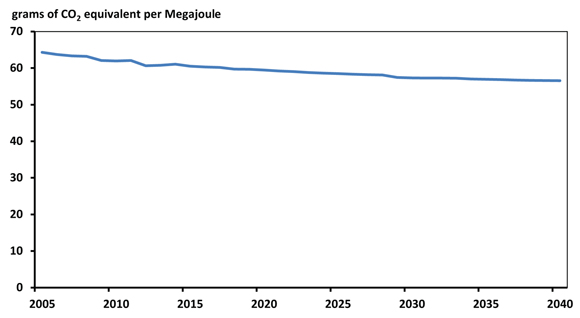
- The rate of growth of fossil fuel consumption outpaces the decline in GHG intensity of Canada’s fossil fuel consumption mix. This implies increasing GHG emissions, which is a result consistent with Environment and Climate Change Canada’s most recent GHG emission projections.
- The sensitivity cases included in EF 2016 show increasing hydrocarbon energy use in each of the cases. Similar to overall energy use trends, fossil fuel use grows faster than the Reference Case in the High Price and High LNG Cases, and slower in the Low Price, Constrained, and No LNG cases, as shown in Figure 12.5. The long-term impacts of the alternative cases on fossil fuel use are modest. In 2040, fossil fuel use in the High Price Case is 3.2 per cent higher than the Reference Case. In the Low Price Case it is 3.5 per cent lower than the Reference Case. The impact of the other cases on fossil fuel use falls within this range.
Figure 12.5 - Total Fossil Fuel Demand, All Cases
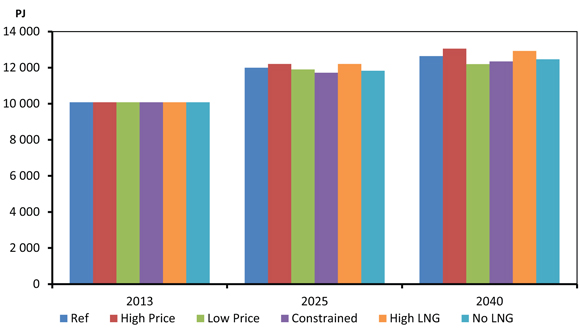
Current Climate Policy Context
- The fossil fuel demand projections in EF 2016 only include policies and programs that are law at the time of analysis. In recent months there have been several notable developments that provide considerable uncertainty to these projections, largely relating to the recent climate conference in Paris.
- The 21st Conference of the Parties to the United Nations Framework Convention on Climate Change (COP 21) was held in France from November 30th to December 11th 2015. This Convention was established at the 1992 Earth Summit in Rio De Janeiro, Brazil, where countries agreed to work cooperatively to address climate change.
- The outcome of the Paris Conference was the Paris Agreement, and a set of decisions on its implementation which are applicable to all countries. The Agreement’s main aim is to keep a global temperature rise this century well below two degrees Celsius and to drive efforts to limit the increase to 1.5 degrees Celsius above pre-industrial levels. The agreement also includes commitments to set emission reduction targets and review them every five years, to provide financial support to developing countries’ transition to low-carbon economies, and to strengthen countries’ abilities to adapt to ongoing climate change.
- In the lead-up to Paris, several provinces announced new climate policies, strategies, reviews, targets, and plans. Following COP 21, the Federal government and the provinces and territories will collaborate on future climate initiatives and revised GHG emission targetsFootnote 126.
- In the spring of 2015, the Alberta government convened an advisory panel to review the province’s climate policies and provide advice on a new set of policies. In November, the panel released a broad suite of policy recommendations. Implementing an economy-wide price for GHG emissions was central to the panel’s recommendationsFootnote 127. The plan proposed replacing Alberta’s existing carbon pricing mechanism and broadening it to include end-use GHG emissions, which result from the combustion of transportation and heating fuels such as gasoline and natural gas. The panel recommended that the price start at $20 per tonne of GHG emissions in 2017 and increase to $30 per tonne by 2018. The $30 per tonne price translates to seven cents per litre of gasoline and $1.68/GJ for natural gas.
- The panel also proposed additional policies including: phasing out coal-fired power generation by 2030, supporting increased renewable power generation, and a methane reduction plan for the oil and gas sector. The panel estimated the combined impact of its policy recommendations to be a 50 MT reduction in 2030 compared to the current emission trajectory. The panel’s proposals are only recommendations; the Alberta government will take them into account when developing policies and regulations. In addition to the panel’s recommendations, the Alberta government also announced a cap on oil sands emissions of 100 MT, with some provisions for cogeneration and new upgrading capacityFootnote 128. The details on how the 100 MT limit will be implemented have yet to be announced.
- In early December, the premiers of Ontario, Quebec, and Manitoba signed a memorandum of understanding to facilitate the linking of future GHG cap and trade systems in Manitoba and Ontario with the existing system in QuebecFootnote 129. The Quebec system is also linked with California under the Western Climate Initiative. The co-operation between these provinces will also extend to initiatives beyond carbon pricing, such as measurement, adaptation, public awareness, and intergovernmental cooperation. Currently, Manitoba has a $10 per tonne emissions tax on coal and petroleum cokeFootnote 130. B.C., Alberta, Manitoba, Ontario, and Quebec having some form of carbon pricing means that half the provinces will have a price on emissions, covering 90 per cent of Canada’s population and over 80 per cent of its GHG emissions. In late 2015, Ontario also released Ontario’s Climate Change StrategyFootnote 131.
- In April 2015, B.C. announced the formation of a Climate Leadership Team to provide recommendations to build upon B.C.’s existing Climate Action Plan. The Climate Leadership Team released their report in late October 2015. The report provides 32 recommendations, including the development of several new strategies, and increasing B.C.’s existing $30 per tonne carbon tax by $10 per year, annually, starting in 2018. For context, Figure 12.6 shows the current implications of B.C.’s $30 per tonne carbon tax for select fuels.
Figure 12.6 - Implied Tax Rates by Fuel of B.C.’s $30 per tonne CO2 equivalent Emission Tax
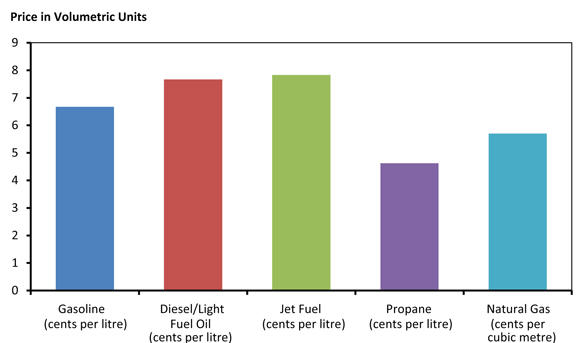
Source: Source: British Columbia Ministry of FinanceFootnote 132
- In late November, the Government of Saskatchewan and SaskPower announced a target to increase the province’s share of renewable electricity generation capacity to 50 per centFootnote 133. This is expected to be led by increases in wind power, along with other renewables such as hydro, solar, biomass and geothermal.
Key Uncertainties
- Many of the details in recently announced provincial policies have not been finalized and are awaiting legislation; currently the state of Canada’s future climate policy is uncertain. Given the strong relationship between emissions and energy, the final outcomes of these announcements will have direct implications for future Canadian energy demand and supply.
- Beyond the recently announced policies, it is likely that climate policy will remain an important issue going forward. The UNFCC recently released a reportFootnote 134summarizing the aggregate effect of the emission reduction commitments made by countries prior to the Paris Conference. The report indicates that global GHG emissions resulting from those commitments are expected to remain higher in 2030 compared to 2010 levels. This is not consistent with the Paris Accord’s commitment to keep warming to two degrees Celsius, or its aspirational goal of limiting it to 1.5 degrees Celsius. This suggests climate policy will continue to be a central issue in global energy demand and supply for the foreseeable future.
Content
List of Figures
| Figure ES.1 | Overview of Cases in EF 2015 |
| Figure ES.2 | Energy Production in Canada, on an Energy Equivalent Basis, Reference Case |
| Figure ES.3 | EF 2015 Crude Oil and Natural Gas Price Assumptions |
| Figure ES.4 | Total Oil Production, Reference, High Price, Low Price and Constrained Cases |
| Figure ES.5 | Total Natural Gas Production, Reference, Price, and LNG Cases |
| Figure ES.6 | Canadian Energy Use, All Cases |
| Figure 1.1 | EF 2016 Sensitivity Cases |
| Figure 2.1 | Global Crude Oil Prices |
| Figure 2.2 | Canadian Natural Gas Exports by U.S. Market |
| Figure 2.3 | Estimated New Production per Drilling Rig, Bakken and Marcellus Production Regions |
| Figure 2.4 | Aggregate Production-weighted SORs for In Situ Oil Sands Projects |
| Figure 2.5 | Wholesale Diesel and Natural Gas Prices |
| Figure 2.6 | Global Installed Photovoltaic Capacity |
| Figure 2.7 | End-Use Electricity Costs, Yukon, NWT, Nunavut, Quebec B.C., Alberta and Ontario |
| Figure 2.8 | Pipeline Infrastructure in Nova Scotia, New Brunswick, and New England Natural Gas Market |
| Figure 3.1 | Brent Crude Oil Price, Reference, High and Low Price Cases |
| Figure 3.2 | Henry Hub Natural Gas Price at Louisiana, Reference, High and Low Price Cases |
| Figure 3.3 | Annual GDP Growth, Reference Case |
| Figure 4.1 | Historical and Projected Growth in End-Use Energy Demand by Sector, Reference Case |
| Figure 4.2 | End-Use Demand by Sector, Reference Case |
| Figure 4.3 | Industrial Energy Demand by Fuel, Reference Case |
| Figure 4.4 | Oil and Natural Gas Sector and Other Industrial Energy Demand, Reference, High and Low Price Cases |
| Figure 4.5 | Transportation Energy Demand by Travel Type, Reference Case |
| Figure 4.6 | Transportation Energy Fuel Share of Demand, Reference Case |
| Figure 4.7 | Share of Fuel in Primary Energy Demand, Reference Case |
| Figure 4.8 | Primary Natural Gas Demand, Reference Case |
| Figure 5.1 | Total Canadian Crude Oil and Equivalent Production, Reference Case |
| Figure 5.2 | Oil Sands Production, Reference Case |
| Figure 5.3 | Purchased Natural Gas for Oil Sands Extraction and Upgrading, Reference Case |
| Figure 5.4 | WCSB Conventional Oil Production, Reference Case |
| Figure 5.5 | Eastern Canada Oil Production, Reference, High and Low Price Cases |
| Figure 5.6 | Total Canadian Oil Production, Reference, High and Low Price Cases |
| Figure 5.7 | Supply and Demand Balance, Light Crude Oil, Reference Case |
| Figure 5.8 | Supply and Demand Balance, Heavy Crude Oil, Reference Case |
| Figure 6.1 | Natural Gas Wells Drilled, Reference, High Price and Low Price Cases, and Average WCSB Initial Production Rate, Reference Case |
| Figure 6.2 | Natural Gas Production by Type, Reference Case |
| Figure 6.3 | Key Producing Regions in the Western Canada Sedimentary Basin |
| Figure 6.4 | Total Canadian Marketable Natural Gas Production, Reference, High and Low Price Cases |
| Figure 6.5 | Supply and Demand Balance, Natural Gas, Reference Case |
| Figure 6.6 | Canadian Net Exports of Natural Gas, Reference, High and Low Price Cases |
| Figure 7.1 | Straddle Plants in Alberta |
| Figure 7.2 | Natural Gas Liquids Production, Reference Case |
| Figure 7.3 | Ethane Supply and Petrochemical Capacity, Reference Case |
| Figure 7.4 | Supply and Demand Balance, Propane, Reference Case |
| Figure 7.5 | Supply and Demand Balance, Pentanes Plus, Reference Case |
| Figure 8.1 | Capacity Additions and Retirements by 2040, Reference Case |
| Figure 8.2 | Capacity Additions and Retirements by 2040, Reference Case |
| Figure 8.3 | Generation by Fuel, Reference Case |
| Figure 8.4 | Non-hydro Renewable Capacity, Reference Case |
| Figure 8.5 | Net Exports of Electricity and Interprovincial Transfers, Reference Case |
| Figure 9.1 | Canadian Coal Production and Disposition, Reference Case |
| Figure 10.1 | Benchmark Oil Prices and Price Differentials (US$/barrel) |
| Figure 10.2 | Existing and Proposed Crude Oil Pipelines |
| Figure 10.3 | Summary of the Impact of the Constrained Case on Canada’s Energy System |
| Figure 10.4 | Crude Oil Price Projections, Reference and Constrained Cases |
| Figure 10.5 | Western Canadian Crude Oil Production, Reference and Constrained Cases |
| Figure 10.6 | Percentage Difference in Western Canadian Oil Production, Constrained Case Compared to the Reference Case |
| Figure 10.7 | Canadian Oil Export Pipeline Capacity and Oil Exports |
| Figure 10.8 | Total Canadian Energy Demand, Reference and Constrained Case |
| Figure 11.1 | Assumed LNG Export Volumes, Reference, High and No LNG Cases |
| Figure 11.2 | Total Natural Gas Production, Reference, High and No LNG Cases |
| Figure 11.3 | Natural Gas Production by Producing Region, Reference, High and No LNG Cases |
| Figure 11.4 | Primary Energy Demand in B.C., Reference, High and No LNG Cases |
| Figure 12.1 | Canadian Emissions by Sector, 2005 and 2013 |
| Figure 12.2 | Estimated Emission Intensities for Various Energy Sources |
| Figure 12.3 | Total Demand for Fossil Fuels, Reference Case |
| Figure 12.4 | Estimated Weighted-Average Fossil Fuel Emission Intensity, Reference Case |
| Figure 12.5 | Total Fossil Fuel Demand, All Cases |
| Figure 12.6 | Implied Tax Rates by Fuel of B.C.’s $30 per tonne CO2 equivalent Emission Tax |
List of Tables
| Table 2.1 | Canadian and Global Production of Select Energy Commodities |
| Table 2.2 | Canadian Exports of Crude Oil, Electricity and Natural Gas in 2014 |
| Table 5.1 | Remaining Ultimate Potential and Established Crude Oil Reserves, as of December 31, 2014 |
| Table 5.2 | Estimated Initial Capital Expenditure and Threshold Prices for New Oil Sands Project |
| Table 6.1 | Remaining Marketable Natural Gas Resources, as of December 31, 2014 |
| Table 10.1 | Cumulative Oil-Directed Capital Expenditures in Western Canada, 2015 to 2040 |
List of Acronyms and Abbreviations
| AEO 2015 | Annual Energy Outlook 2015 |
| B.C. | British Columbia |
| CBM | coal bed methane |
| CCS | carbon capture and storage |
| CO2 | carbon dioxide |
| COGOA | Canada Oil and Gas Operations Act |
| COP 21 | The 21st Conference of the Parties to the United Nations Framework Convention on Climate Change |
| CPP | Clean Power Plan |
| CPRA | Canada Petroleum Resources Act |
| CSS | cyclic steam stimulation |
| EF 2013 | Canada’s Energy Future 2013: Energy Supply and Demand Projections to 2035 |
| EF 2016 | Canada’s Energy Future 2016: Energy Supply and Demand Projections to 2040 |
| EIA | U.S. Energy Information Administration |
| EPA | U.S. Environmental Protection Agency |
| FIT | feed-in-tariff |
| GDP | Gross Domestic Product |
| GHG | greenhouse gases |
| IP | initial production |
| IPCC | The Intergovernmental Panel on Climate Change |
| LNG | liquefied natural gas |
| M&NP | Maritimes & Northeast Pipeline |
| MSW | Maritimes & Northeast Pipeline |
| NEB | National Energy Board |
| NGL | natural gas liquid |
| NGV | natural gas vehicle |
| NWT | Northwest Territories |
| OGOA | North West Territories’ Oil and Gas Operations Act |
| OPEC | Organization of Petroleum Exporting Countries |
| PADD | Petroleum Administration for Defense Districts |
| PRA | Petroleum Resources Act |
| PV | photovoltaic |
| RPP | refined petroleum product |
| SAGD | steam assisted gravity drainage |
| SOEP | Sable Offshore Energy Project |
| SOR | steam oil ratio |
| UNFCCC | United Nations Framework Convention on Climate Change |
| WCI | Western Climate Initiative |
| WCS | Western Canadian Select |
| WCSB | Western Canada Sedimentary Basin |
| WTI | West Texas Intermediate |
List of Units
| 10³ | thousand |
| 106 | million |
| 109 | billion |
| 1012 | trillion |
| m³ | cubic metres |
| bbl | barrel |
| Mb | thousand barrels |
| MMb | million barrels |
| MMcf | million cubic feet |
| Bcf | billion cubic feet |
| Tcf | trillion cubic feet |
| /d | per day |
| C$ | Canadian dollars |
| US$ | U.S. dollars |
| MT | megatonnes of CO2 equivalent |
| GJ | gigajoule |
| PJ | petajoule |
| MMBtu | million British thermal units |
| MW | megawatt |
| GW | gigawatt |
| kW.h | kilowatt-hour |
| GW.h | gigawatt-hour |
| TW.h | terrawatt-hour |
| °C | Celcius |
| MMtpa | million tonnes per annum |
Glossary
| Atlantic Basin | Refers to countries that reside beside or within the Atlantic Ocean and related waters. |
| Biodiesel | A diesel fuel substitute manufactured from vegetable oil or recycled cooking oil. |
| Biomass | Organic material such as wood, crop waste, municipal solid waste, hog fuel or pulping liquor, processed for energy production. |
| Bitumen or crude bitumen | A highly viscous mixture of mainly hydrocarbons which are heavier than pentanes. In its natural state, it is not usually recoverable at a commercial rate through a well because it is too thick to flow. |
| Brent | A key global crude oil benchmark price. It is a light sweet grade that is extracted from the North Sea. |
| Capacity (Electricity) | The maximum amount of power that a device can generate, use or transfer, usually expressed in megawatts. |
| Carbon capture and storage (CCS) or carbon capture and sequestration | A method of capturing (and storing) CO2, such that it is not released into the atmosphere, hence reducing GHG emissions. Carbon dioxide is compressed into a transportable form, moved by pipeline or tanker, and stored in some medium, such as a deep geological formation. |
| CO2 flooding | CO2 flooding is a process of enhanced oil recovery, in which CO2, in a liquid form, is injected into oil-bearing reservoirs in an effort to increase the amount of oil that can be extracted. |
| Coalbed methane (CBM) | An unconventional form of natural gas that is trapped within the matrix of coal seams. Coalbed methane is distinct from typical sandstone or other conventional gas reservoir, as the methane is stored within the coal by a process called adsorption. |
| Cogeneration | Production of electricity and another form of useful thermal energy, such as heat or steam, from the same energy source. Either the byproduct heat from industrial processes can be used to power an electrical generator or surplus heat from an electric generator can be used for industrial purposes. |
| Conventional crude oil | Crude oil, which at a particular point in time, can be technically and economically produced through a well using normal production practices and without altering the natural viscous state of the oil. |
| Conventional natural gas | Natural gas that is found in the reservoir and produced through a wellbore with known technology and where the drive for production is provided by expansion of the gas or by pressure from an underlying aquifer. |
| Crude oil | A mixture of hydrocarbons of different molecular weights that exists in the liquid phase in underground reservoirs and remains liquid at atmospheric pressure and temperature. Crude oil may contain small amounts of sulphur and other non-hydrocarbons, but does not include liquids obtained from the processing of natural gas. |
| Cyclic steam stimulation (CSS) | A repeatable, thermal in situ recovery technique involving steam injection followed by oil production from wells injected with steam. Steam injection increases oil mobility and allows heated bitumen to flow into a well. |
| Deep-Cut facilities | A gas plant next to or within gas field plants or gas pipelines that can extract ethane and other natural gas liquids using turbo-expander or absorption technologies. |
| Diluent | Any lighter hydrocarbon, usually pentanes plus, added to heavy crude oil or bitumen in order to facilitate its transport in crude oil pipelines. |
| Energy efficiency | Technologies and measures that reduce the amount of energy and/or fuel required for the same work. |
| Energy intensity | The amount of energy used per unit of activity. Two common forms of energy intensity are energy use per capita and energy use per unit of GDP. |
| Enhanced oil recovery | The extraction of additional crude oil from reservoirs through a production process other than natural depletion. Includes both secondary and tertiary recovery processes such as pressure maintenance, cycling, water flooding, thermal methods, chemical flooding, and the use of miscible and immiscible displacement fluids. |
| Feedstock | Natural gas or other hydrocarbons used as an essential component of a process for the production of a product. |
| Fossil fuel | Hydrocarbon-based fuel sources such as coal, natural gas, natural gas liquids and crude oil. |
| Generation (electricity) | The process of producing electric energy by transforming other forms of energy. Also, the amount of energy produced. |
| Geothermal energy | The use of geothermal heat to generate electricity. Also used to describe ground-source heating and cooling (also known as geoexchange or ground-source heat pump). |
| Greenhouse gas (GHG) | A gas such as carbon dioxide, methane or nitrogen oxide, which actively contribute to the atmospheric greenhouse effect. Greenhouse gases also include gases generated through industrial processes such as hydroflurocarbons, perflurocarbons and sulphur hexafluoride. |
| Grid-Parity (electricity) | When the cost of a particular electricity technology is at or below the variable, per kWh portion of retail electricity prices. |
| Gross Domestic Product (GDP) | GDP is a measure of economic activity within a country. It is the market value of all goods and services in a year within Canada’s borders. |
| Heat content (natural gas) | A measure of the amount of energy per unit of volume of the natural gas stream. Natural gas produced from oil and gas wells primarily consists of methane but can also contain natural gas liquids (NGLs) like ethane, propane, and butane. Because NGLs burn hotter than methane on a per volume basis, gas that is "rich" in NGLs has higher heat content than "lean" gas. |
| Heavy crude oil | Generally, a crude oil that has a density greater than 900 kg/m³, or an API gravity below 25. |
| Henry Hub (price) | Henry Hub is the pricing point for natural gas futures traded on the New York Mercantile Exchange. The hub is a point on the natural gas pipeline owned by Sabine Pipe Line and located in Louisiana. |
| Hydroelectric generation | A form of renewable energy wherein electricity is produced from hydropower. |
| In situ recovery | The recovery of bitumen through the use of wellbores, generally in areas where depth of burial precludes surface-mining operations. |
| Initial production rate (IP rate) | The highest average monthly production rate over the first three months of production for an oil or gas well. |
| Light crude oil | Generally, crude oil having a density less than 900 kg/m³, or an API gravity above 25. Also a collective term used to refer to conventional light crude oil, upgraded heavy crude oil and pentanes plus. |
| Liquefied natural gas (LNG) | Liquefied natural gas is natural gas in its liquid form. Natural gas is liquefied by cooling to minus 162 degrees Celsius (minus 260 degrees Fahrenheit), and the process reduces the volume of gas by more than 600 times, allowing for efficient transport via LNG tanker or trucks. |
| Marketable natural gas | The volume of gas that can be sold to the market after allowing for removal of impurities and after accounting for any volumes used to fuel surface facilities. As used in this report for undiscovered volumes, it is determined by applying the average surface loss from existing pools in that formation to the recoverable volumes of undiscovered pools of the same formation. |
| Mining, extraction, and upgrading plant | A combined mining and upgrading operation where oil sands are mined from open pits. The bitumen is then separated from the sand and upgraded by a refining process. |
| Metallurgical coal | Anthracite or high-grade bituminous coal primarily used in the steelmaking industry. |
| Mixed Sweet Blend (MSW) | A light, sweet grade of crude oil, typically priced at Edmonton, Alberta. |
| Multi-stage hydraulic fracturing | A technique in which fluids are injected underground, in multiple stages, to create or expand existing fractures in the rock, allowing oil or gas to flow out of the formation, or to flow at a faster rate. |
| Natural gas liquids (NGLs) | Those hydrocarbon components recovered from natural gas as liquids. These liquids include, but are not limited to, ethane, propane, butanes and pentanes plus. |
| Net exports | For the purposes of this analysis, total production of a commodity less domestic demand for that commodity is equal to net exports. |
| Net-back Price | A measure of the value of crude oil received by producers, usually determined by the market price less transportation costs. For this analysis, the net-back price refers to benchmark Canadian crude oil prices such as MSW and WCS. |
| Olefins | Unnaturally occurring hydrocarbons that form part of the basic components of the petrochemical industry. Olefins are typically produced at crude oil refineries or by steam cracking NGLs at petrochemical facilities. Examples of olefins include ethylene, propylene, butylene and isobutylene. |
| Oil sands | Sand and other rock material that contains bitumen. Each particle of oil sand is coated with a layer of water and a thin film of bitumen. |
| Oil sands off-gas | A mixture of hydrogen and light hydrocarbon gases produced when bitumen is upgraded to produce synthetic crude oil. |
| Peak demand | The maximum load consumed or produced in a stated period of time. |
| Photovoltaic Solar | Technology that converts electromagnetic waves radiated by the sun into electricity by means of solar PV cells. |
| Primary energy demand | The total requirement for all uses of energy, including energy used by the final consumer, intermediate uses of energy in transforming one energy form to another, and energy used by suppliers in providing energy to the market. |
| Real or constant dollar | When price levels that are held constant at a base year, eliminating the effect of inflation. |
| Refined petroleum product | A wide range of products derived from crude oil through the refining process such as gasoline, diesel, heating oil, and jet fuel, among others. |
| Reliability (electricity) | The degree of performance of any element of an electricity system, which results in electricity being delivered to customers within acceptable standards and in the amount desired. Reliability can be measured by frequency, duration or magnitude of adverse effects on electricity supply. |
| Reserves | Reserves are estimated remaining marketable quantities of oil and natural gas and related substances anticipated to be recoverable from known accumulations, as of a given date, based on: analysis of drilling, geological, geophysical, and engineering data; the use of established technology; and specified economic conditions, which are generally accepted as being reasonable, and shall be disclosed. |
| Reserves - Proven | Proved reserves are those reserves that can be estimated with a high degree of certainty to be recoverable. It is likely that the actual remaining quantities recovered will exceed the estimated proved reserves. |
| Resources (Oil and Natural Gas) | As used in this report, resources refer to the remaining total volume of recoverable oil and natural gas that is thought to exist. Resources include deposits not economic to extract at current oil and gas prices, but may become economic as prices rise. Resources also include an undiscovered component, which may have been bypassed in current wells or have yet to be found. Resources can also include an additional amount of oil and gas that may be recovered as technology improves beyond current capabilities. |
| Resources - Marketable | The volume of in-place oil or natural gas that is recoverable under foreseeable economic and technological conditions and in a condition ready to be used by the market. |
| Resources - Ultimate Potential | An estimate of all the resources that may become recoverable or marketable, having regard for the geological prospects and anticipated technology. |
| Shale gas | A form of unconventional gas that is trapped within shale, a sedimentary rock originally deposited as clay or silt and characterised by extremely low permeability. The majority of the gas exists as free gas or adsorbed gas though some gas can also be found in a dissolved state within the organic material. |
| Solar energy | Includes active and passive solar heat collection systems and photovoltaics. |
| Solution gas | Natural gas produced along with oil from oil wells. |
| Steam assisted gravity drainage (SAGD) | SAGD is a steam stimulation technique using pairs of horizontal wells in which the bitumen drains, by gravity, into the producing wellbore, after it has been heated by the steam. In contrast to cyclic steam stimulation, steam injection and oil production are continuous and simultaneous. |
| Straddle plant | A reprocessing plant located on a gas pipeline. It extracts natural gas liquids from previously processed gas. |
| Supply cost | All costs associated with resource exploitation measured as an average cost per unit of production over the project life. It includes capital costs associated with exploration, development, and production as well as operating costs, taxes, royalties and producer rate of return. |
| Synthetic crude oil | Synthetic crude oil is a mixture of hydrocarbons generally similar to light sweet crude oil, derived by upgrading crude bitumen or heavy crude oil. |
| Thermal coal | Lignite, sub-bituminous or lower-grade bituminous coal primarily used for power generation or heating purposes. |
| Tight gas | A form of conventional natural gas that is held in the pore space of a rock that has a lower permeability or ability to flow than usual for that type of rock. |
| Tight oil | Oil produced from organic-rich shales or from low permeability sandstone, siltstone, limestone or dolostone reservoirs. Tight oil reservoirs typically require the combination of horizontal drilling and multi-stage hydraulic fracturing to establish sufficient fluid flow to achieve economic rates of recovery. |
| Unconventional crude oil | Crude oil that is not classified as conventional crude oil (e.g., bitumen). |
| Unconventional natural gas | Natural gas that is contained in a non-traditional reservoir rock that requires significant additional stimulus to allow gas flow. It may be that the gas is held by the matrix material such as coal, ice, or shale; or where the reservoir has an unusually low amount of porosity and permeability. In this report unconventional gas is divided into coalbed methane, shale gas and gas hydrates. |
| Upgrading (bitumen) | The process of converting bitumen or heavy crude oil into a higher quality crude oil either by the removal of carbon (coking) or the addition of hydrogen (hydroprocessing). |
| Wave / Tidal power | Also known as tidal energy, tidal or wave power makes use of the rise and fall in sea levels, or tidal flow, to create hydropower. |
| West Texas Intermediate (WTI) | West Texas Intermediate (WTI) A key North American benchmark crude oil price. It is a light sweet grade of crude oil, priced at Cushing Oklahoma. |
| Western Canada Sedimentary Basin (WCSB) | The Western Canada Sedimentary Basin (WCSB) is an ancient sedimentary basin 1.4 million square kilometres in size that formed over southwest Manitoba, southern Saskatchewan, almost all of Alberta, eastern and northeastern British Columbia, and the southern Yukon and Northwest Territories. |
| Western Canadian Select (WCS) | Western Canadian Select (WCS) A heavy crude oil blend, priced at Hardisty, Alberta. |
- Date modified: