ARCHIVED – Fact Sheet - Canada’s Energy Future 2016: Energy Supply and Demand Projections to 2040 - Greenhouse Gas Emission Highlights
This page has been archived on the Web
Information identified as archived is provided for reference, research or recordkeeping purposes. It is not subject to the Government of Canada Web Standards and has not been altered or updated since it was archived. Please contact us to request a format other than those available.
Canada’s Energy Future 2016: Energy Supply and Demand Projections to 2040 provides projections of Canadian energy supply and demand to the year 2040. Canada’s Energy Future 2016 includes a baseline projection, the Reference Case, based on the current macroeconomic outlook, energy price projections, and government policies and programs that were law or near-law at the time the report was prepared. EF 2016 includes additional projections that vary assumptions on energy prices, energy markets, and infrastructure. For detailed information on Greenhouse Gases, see Chapter 12 of the full report.
The majority of GHGs emitted in Canada are related to fossil fuel consumption
- Given the prevalence of fossil fuels in the Canadian and global energy mix, energy use and GHG emissions are directly related. The majority of GHGs emitted in Canada result from the combustion of fossil fuels. Fossil fuels include crude oil, natural gas, coal, and refined petroleum products such as gasoline and diesel. They provide the vast majority of energy used to heat homes and businesses, transport goods and people, and power industrial equipment. Emissions from the combustion of fossil fuels, including those used for the production of energy, accounted for 81 per cent of Canadian GHG emissions in 2013. The remaining emissions are from non-energy sources such as agricultural and industrial processes, and waste handling.
- Environment Canada publishes Canada’s official GHG projections in its Canada’s Emission Trends report and also in Canada’s Biennial Report to the United Nations Framework Convention on Climate Change. Much like the analysis in EF 2016, the Emission Trends projections include policies and programs that were in place at the time of analysis.
- Given the policy and technology assumptions of this analysis, fossil fuels remain the primary source of energy in Canada over the projection period. This increase in fossil fuel consumption implies that GHG emissions will increase over the projection period, consistent with the most recent GHG emission projections from Environment Canada.
- From 2014 to 2040, the use of fossil fuels increases by 22 per cent, an average of 0.8 per cent per year.
- As different fossil fuels emit different amounts of GHGs, the relative shares of various fuels influence the GHG emissions resulting from fossil fuel consumption. Faster demand growth in lower GHG intensity natural gas and declining coal consumption results in declining average GHG emissions per unit of fossil fuel energy consumed. The estimated weighted-average emission intensity (grams of CO2 equivalent per MJ) declines by approximately six per cent over the projection period.
Fossil fuel use grows in all EF 2016 projections, implying increasing GHG emissions
- The rate of growth of fossil fuel consumption outpaces the decline in GHG intensity of Canada’s fossil fuel consumption mix. This implies increasing GHG emissions, which is a result consistent with Environment Canada’s most recent GHG emission projections.
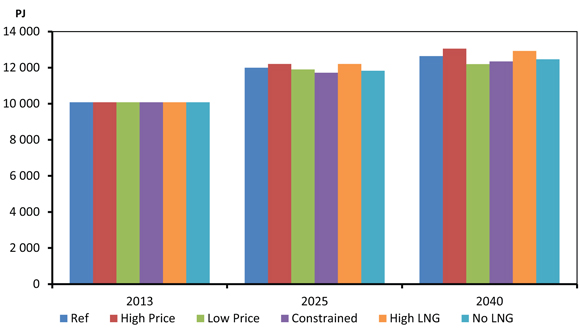
- The sensitivity cases included in EF 2016 show increasing hydrocarbon energy use in each of the cases. Similar to overall energy use trends, fossil fuel use grows faster than the Reference Case in the High Price and High LNG Cases, and slower in the Low Price, Constrained, and No LNG cases. The long-term impacts of the alternative cases on fossil fuel use are modest. In 2040, fossil fuel use in the High Price Case is 3.2 per cent higher than the Reference Case. In the Low Price Case it is 3.5 per cent lower than the Reference Case. The impact of the other cases of fossil fuel use falls within this range.
- The fossil fuel demand projections in EF 2016 only include policies and programs that are law at the time of analysis. In recent months there have been several notable developments that provide considerable uncertainty to these projections, largely relating to the recent climate conference in Paris.
Total Fossil Fuel Demand, All Cases
- Date modified: