ARCHIVED – National Energy Board – Employment Equity Report 2018–2019
This page has been archived on the Web
Information identified as archived is provided for reference, research or recordkeeping purposes. It is not subject to the Government of Canada Web Standards and has not been altered or updated since it was archived. Please contact us to request a format other than those available.
Employment Equity Report 2018–2019 [PDF 1155 KB]
ISSN 1929-2511

Table of Contents
2.0 Employment Equity Initiatives
- 2.1 Women
- 2.2 Aboriginal Peoples
- 2.3 Visible Minorities
- 2.4 Persons with Disabilities
- 2.5 Other Initiatives
4.0 Analysis of Total Employee Population
5.0 Analysis by Employment Equity Occupational Groups
- 5.1 Senior Managers
- 5.2 Middle Managers
- 5.3 Professionals
- 5.4 Semi-Professionals & Technicians
- 5.5 Supervisors
- 5.6 Administrative & Senior Clerical
- 5.7 Skilled Crafts & Trades
- 5.8 Clerical Personnel
- 5.9 Semi-Skilled Workers
- 5.10 Summary
6.0 Analysis of the Numbers of Employee Hires, Promotions and Regrettable Departures
7.0 Conclusion and Recommendations
List of Tables
- TABLE 1: Comparison of Total Employee Population with Availability Data (as of March 31, 2019)
- TABLE 2: Comparison of Employee Population with Availability Data by Employment Equity Groups and by Occupational Groups as of March 31, 2019
- TABLE 3: Comparison of Employee Hires with Availability Data by Employment Equity Groups and by Occupational Groups – April 1, 2018 to March 31, 2019
- TABLE 4: Employee Promotions by Employment Equity Groups and by Occupational Groups – April 1, 2018 to March 31, 2019
- TABLE 5: Employee Departures by Employment Equity Groups and by Occupational Groups – April 1, 2018 to March 31, 2019
- TABLE 6: Workforce Availability – Women (as of March 31, 2019)
- TABLE 7: Workforce Availability – Aboriginal Peoples (as of March 31, 2019)
- TABLE 8: Workforce Availability – Visible Minorities (as of March 31, 2019)
- TABLE 9: Workforce Availability – Persons with Disabilities (as of March 31, 2019)
- CHART 1: Employment Equity Representation: Women – 2014 to 2018
- CHART 2: Employment Equity Representation: Aboriginal Peoples – 2014 to 2018
- CHART 3: Employment Equity Representation: Visible Minorities – 2019 to 2018
- CHART 4: Employment Equity Representation: Persons with Disabilities – 2014 to 2018
1.0 Introduction
The Canada Energy Regulator (CER) is committed to providing an inclusive workplace and to ensuring legislative requirements of the Public Service Employment Act and the Employment Equity Act are adhered to accordingly.
Employment Equity targets the following designated groups when determining adherence to or gaps in a workforce: [1] Women, [2] Aboriginal Peoples, [3] Visible Minorities and [4] Persons with Disabilities.
CER’s annual Employment Equity report provides an analysis of the results achieved during the reporting period 1 April 2018 to 31 March 2019. The report provides a workforce description of the employees at the CER as of 31 March 2019 (note 1Footnote 1), which includes an analysis of internal representation in comparison to labour market availability.1.1 The Organization
The CER works to keep energy moving safely across the country. We review energy development projects and share energy information, all while enforcing some of the strictest safety and environmental standards in the world. The CER was created under the Canadian Energy Regulator Act. Note that this legislation was not in effect during the reporting period. It was assented to in June 2019. This legislation includes:
A modern governance structure
- A governance structure with an independent Commission to adjudicate projects, headed by a Lead Commissioner.
- A Board of Directors, led by a Chair to provide strategic oversight.
- A Chief Executive Officer, separate from the Chair, accountable for leading the organization and delivering results.
Timely and predictable decisions
- Specific administrative and technical decisions are made by CER expert staff relying on a streamlined process using Designated Officers.
- Small and medium-size projects are reviewed by the CER and go through a full impact assessment within 10 and 15 months respectively.
- Large projects go through an integrated review process led by the Impact Assessment Agency of Canada with CER technical support.
Strengthened safety and environmental protection
- Independent of project size, the CER enforces conditions and inspects facilities to protect people and the environment.
- The legislative framework strengthens the CER’s ability to ensure safety and environmental protection.
- The CER is the lifecycle regulator for offshore renewable energy facilities, such as offshore wind turbines and tidal facilities, located in marine areas under federal jurisdiction.
More inclusive public participation
- The CER has a mandate emphasizing inclusive public participation and transparency.
Greater Indigenous participation
- The legislation recognizes Indigenous rights and confirms the Government’s duty to consult, including a requirement to assess impacts on these rights and consider lndigenous knowledge in decision making.
- At least one member of the Board of Directors and one Commissioner must be Indigenous.
- An Indigenous Advisory Committee, with membership representing First Nations, Inuit, and Metis interests, will enhance Indigenous involvement in energy projects.
1.2 Data Analysis
Data analysis was performed utilizing data from the 2016 Census Employment and Social Development Canada (ESDC) report to compare overall representation of all groups except Persons with Disabilities, where the workforce availability data was at the national level.
Notes regarding data analysis:
- In some prior years the CER used national data for all groups; utilizing Calgary data provides a more relevant comparison for the CER as the vast majority of our employees are resident in Calgary. Due to lack of Calgary-specific data for Persons with Disabilities, analysis of workforce availability utilizes the 2016 Participation and Activity Limitation Survey which is based on national statistics.
- As per census data available, the workforce population is considered to be those aged 15 years and older.
- Treasury Board Secretariat has confirmed the use of 2016 census data for this year’s report.
2.0 Employment Equity Initiatives
The CER recognizes that we must embrace and represent diversity to enable us to achieve service excellence through our employees. The CER is committed to strengthening and continuously improving its diversity representation as it is integral to supporting a balanced internal population that truly reflects Canadian diversity. Given the CER’s unique role with respect to Canada’s energy industry, one of our challenges is to attract and retain qualified candidates, given that the energy market in Canada is heavily concentrated in Calgary, and is highly competitive from a compensation point of view.
2.1 Women
As this report will highlight, women are well represented at the CER across all employment equity occupational groups, from Clerical Personnel, to Middle Management and to Senior Management. One of the CER’s initiatives supporting women is the “Women in Leadership” Community of Practice. It promotes the CER as an open and supportive workplace dedicated to providing a safe space for dialogue, building leadership opportunities for women, and the continual improvement of gender diversity via special events, training, and group discussions.
2.2 Aboriginal Peoples
The CER continues to refine its Indigenous Engagement Program. Indigenous awareness at the CER is used to promote understanding of and respect for Indigenous Peoples’ diverse cultures, unique perspectives and contributions made to complement Canada’s rich past, present and future.
In response to the CER’s growing need for engagement with Indigenous Peoples and knowledge of their cultures, the Indigenous Awareness Week committee continues to sponsor events all year long.
In partnership with other federal departments and industry in Calgary, the CER promotes and encourages employees to participate in meetings and celebrations respecting Indigenous Peoples, as well as commemorative events and awareness training.
An example of a commemorative event in 2018-19 was CER’s promotion of Orange Shirt Day. Approximately 100 employees wore an orange garment to work to show their support for Orange Shirt Day. The day is a legacy of the St. Joseph Mission Residential School (1891-1981) Commemoration Project and Reunion events that took place in Williams Lake, BC, Canada, in May 2013, to commemorate the residential school experience, to witness and honour the healing journey of the survivors and their families, and to commit to the ongoing process of reconciliation.
An example of training was the Kairos Blanket exercise, offered twice in 2018-19: once to all employees (25 attended), and once to HR staff (9 attended). The KAIROS Blanket Exercises were interactive learning experiences that taught about the impacts of colonialism on Canada's Indigenous populations over the past 500 years. Blanket Exercise participants took on the roles of Indigenous Peoples in Canada. Standing on blankets that represent the land, they walked through pre-contact, treaty-making, colonization and resistance.
The CER actively seeks to hire Indigenous employees through targeted staffing actions. In 2018/19, we hired an Indigenous candidate in a Management role from our staffing action 19-ENR-EA-0085. A second Indigenous candidate was also hired from this same candidate pool.
2.3 Visible Minorities
There were several initiatives in 2018/19 aligned with the CER’s strategy for elimination of racial discrimination, such as (a) the promotion of International Day for Elimination of Racial Discrimination, which included an open session between one of our Executive Vice Presidents and employees across the organization to discuss and document potential actions to help eliminate racial discrimination in the workplace, and (b) the work undertaken by the CER’s Employment Equity and Diversity Committee – EEDC. This committee is widely represented, comprised of union (PIPSC) and excluded employees, and includes committee members from each of the four Employment Equity groups. It is responsible for monitoring the progress of an Employment Equity & Diversity Plan, for making recommendations to enhance the plan, and for leading various initiatives throughout the year.
EEDC continued to offer lunch and learn opportunities for employees to hear about the diverse experiences of other employees who volunteered to participate as presenters. Discussions included such topics as cultural differences, mental and physical health awareness, diverse backgrounds, languages, and lifestyles. The sessions were well attended in 2018/19, and feedback from presenters and participants continued to be extremely positive.
2.4 Persons with Disabilities
In 2018/19 the CER focused on promoting an inclusive, healthy and productive work environment. This included work schedule adjustments to provide variable start and stop times, and modified work weeks where circumstances warrant. Ergonomic assessments of individual work stations were provided across the organization. Additionally, the CER ensured workplace accommodation was offered to employees as required, up to the point of no undue hardship.
The Duty to Accommodate policy, procedures and guidelines were reviewed in 2018/19, as part of an annual review process. The intent is to ensure that there is clear direction provided to support an inclusive, barrier-free, and non-discriminatory workplace. Duty to Accommodate training has been facilitated in collaboration with the Union and Human Resources and is a mandatory course for leaders.
2.5 Other Initiatives
- Consultations with employee representatives on employment equity initiatives took place within the mandate of the CER’s Union-Management Consultation Committee (UMCC).
- An online orientation course that includes an Employment Equity component continues to be offered.
- Telework Agreements are available as an option for consideration to encourage employment equity groups to seek out the CER as their employer of choice.
- The services of a third party Ombudsperson Office is routinely promoted to to all employees as one avenue to discuss their concerns and provide an opportunity to receive personal coaching on difficult issues.
- Each year, the CER awards an individual or team who has continuously enhanced employment equity and diversity through behavior, actions or achievements. In FY 18/19, one of our Indigenous employees won this award for her work as an Engagement Specialist, and her initiative in keeping CER staff well informed on a large variety of Indigenous affairs issues and resources.
- Kouzes and Posner leadership training was introduced in 2017-18 and 122 employees completed the training in that fiscal year. It is required training for Management and offered to all employees at all levels. Among the objectives of this training are to treat everyone with dignity and respect, and to enable all employees to grow in their jobs and careers through learning new skills and developing themselves. In 2018-19, an additional 179 employees completed the training; in total representing approximately 60% of the CER’s workforce.
3.0 Workforce Analysis
3.1 Data Availability
It is noted that Landed Immigrants are included in the statistical data, however external systemic barriers for hiring may skew the results for government departments and agencies, such as the CER, that are regulated by the Public Service Employment Act (PSEA) and the Security of Information Act. Under the provisions of the PSEA, departments are required to provide Canadian Citizens with a preference for employment opportunities. However, external systemic barriers may exist in regard to hiring Landed Immigrants. These include the inability to expedite security clearances from many Landed Immigrants’ countries, and the candidates’ requirement to go through a lengthy process to ensure their foreign educational documentation is officially verified to Canadian standards. These barriers hinder our ability to hire Landed Immigrants, many of whom we have found to be excellent candidates for hard to find technical skill sets such as specialty engineers.
It is further noted that the census data from which workforce availability is derived includes those 15 years of age and older. It is doubtful whether all Canadian Citizens over the age of 14 are actively seeking employment; nevertheless the CER recognizes that the census data is the available and common measuring stick across the federal government for workforce availability.
3.2 Employee Population
The workforce analysis was conducted on the total employee population with the exception of individuals who work less than 12.5 hours/week. In addition, the following persons were not included in the CER workforce analysis:
- Governor-in-Council appointments: Chair/CEO, Vice-Chair, and Board Members (former appointees to the CER’s predecessor, the National Energy Board);
- Persons who are at the CER on Interchange from other Federal Government departments/agencies and private industry;
- Persons who worked for a period less than thirteen weeks;
- Students;
- Casuals; and
- Contractors.
3.3 Self-Identification
CER is onboarded to MyGCHR 9.1, one of the Government of Canada’s standardized Human Resources (HR) management systems in use by many Federal Departments and Agencies. It is a consolidated automated information system for all HR administrative transactions, including self-service for employees and managers.
Since the arrival of MyGCHR at the CER in March 2016, employees have had the option to self-identify when they log in to the system for the first time. Only those employees who voluntarily identify as Aboriginal People, Visible Minorities or Persons with Disabilities are captured as members of designated groups for the purpose of conducting the workforce analysis. Women were also included but identified using the gender information provided by employees via their hiring documents which are entered into MyGCHR by Human Resources.
3.4 Analysis
An analysis of representation levels of designated groups within the CER was conducted and conclusions appear before each table. It is important to note that, due to our relatively small workforce, a change of one or two individuals within a designated group can change percentages significantly.
4.0 Analysis of Total Employee Population
Employment equity representation is determined by comparing the representation within an occupational category with its workforce availability. To ensure confidentiality for employment equity groups this report will not indicate any numbers where representation is three (3) or less, with the exception of Women. Please note that tables include the number of men to ensure data is accurate.
An analysis of the total employee population was conducted; the results by gender and designated group members are shown in Table 1. Note that the numbers across the rows in Table 1 will exceed the total employee population, because there will be men and women who are represented in more than one category in the row.
Table 1 shows that as of 31 March 2019, the total employee population was 504 employees, made up of 471 full-time and 33 part-time employees. Men comprised 35.3% of the total population, while Women represented 64.7%, a marginal increase from last year as shown in Chart 1: Employment Equity Representation: Women – 2014 to 2019.
Table 1 also shows the percentage of representation by designated groups compared with the labour market availability data. From these comparisons, it can be seen that Women and Aboriginal People are represented at a higher rate at the CER than the overall labour market, and Visible Minorities and Persons with Disabilities show lower than availability.
Note that the comparisons throughout this report are percentage point differentials. For example, if CER representation in a group is 40% and workforce availability is 20%, then the comparison is that the CER is 20% (20 percentage points) higher than availability.
Specifically, the CER workforce analysis shows these results:
Women: Exceeds workforce availability in this group by 14.4%.
Aboriginal Peoples: Exceeds workforce availability in this group by 2.3%.
Visible Minorities: Falls short of workforce availability in this group by -10.2%.
Persons with Disabilities: Falls short of workforce availability in this group by -4.5%.
TABLE 1: Comparison of Total Employee Population with Availability Data
(as of March 31, 2019)
| Number of Employees | Men | Women | Aboriginal Peoples | Visible Minorities | Persons with Disabilities** | |
|---|---|---|---|---|---|---|
| Full-Time | 471 | 172 | 299 | 22 | 58 | 20 |
| Part-Time | 33 | 6 | 27 | * | * | * |
| Total | 504 | 178 | 326 | * | * | * |
| CER Representation | 35.3% | 64.7% | 5.0% | 12.1% | 4.3% | |
| 2016 Census Availability Data* | 49.7% | 50.3% | 2.7% | 22.3% | 8.8% | |
| Variance (over and under-represented) |
-14.4% | 14.4% | 2.3% | -10.2% | -4.5% | |
Note: the groups above will not add up to the total # of employees as an employee may belong to more than one group. |
||||||
5.0 Analysis by Employment Equity Occupational Groups
Table 2 shows the breakdown into employment equity occupational groups of the total employee population by gender and designated groups. For each occupational group, the representation by gender and designated group members is given in whole numbers, as well as a proportion of the total number of employees (the first percentage figure at the bottom of each cell). The Calgary labour market availability data is the percentage figure that follows. Where representation is three or fewer (with exception of women), for confidentiality purposes, (*) is used to denote that data exists but is not reported. Data collected for Persons with Disabilities combines the Senior Managers and Middle Managers categories and (**) is used to denote that the data is combined.
5.1 Senior Managers
Table 2 shows that as of 31 March 2019, there were 14 senior managers employed at the CER. Eight (8) were women, which at 57.1%, is higher than the overall Calgary labour market availability of 27.6%. There was no representation of Aboriginal Peoples in this group.
The occupational groups of Senior Managers and Middle Managers were combined for Persons with Disabilities. The CER’s representation of 7.1% was higher than the overall national labour market availability data of 4.3%.
5.2 Middle Managers
The number of middle managers (31) decreased slightly over the previous year (34). Women increased from 35.3% to 45.2%, and Visible Minorities increased slightly from 8.8% to 9.7%. There was no representation of Aboriginal Peoples.
5.3 Professionals
The Professionals group is comprised of financial officers, engineers, economists, environmental specialists, human resources advisors, communications advisors, information systems specialists, translators and lawyers. In this occupational group, Women were well represented (60.7% vs 45.1% availability), as were Aboriginal Peoples (3.6% vs 2.4% availability). Visible Minorities were under represented (10.8% vs 22.1% availability), as were Persons with Disabilities (3.9% vs 8.9% availability).
5.4 Semi-Professionals & Technicians
The semi-professionals and technicians occupational group includes engineering inspectors, library technicians, information technology service analysts and graphic designers. Women are well represented in this group (59% vs 38.8%), as were Persons with Disabilities (7.7% vs 7.6%). Aboriginal Peoples and Visible Minorities were both under represented.
5.5 Supervisors
There were four (4) employees in this occupational group and 100% were Women. Visible Minorities were 3 or fewer therefore numbers are not shown.
5.6 Administrative & Senior Clerical
Women made up the majority of the CER’s complement in the Administrative & Senior Clerical occupational group, which includes business unit administrators, human resources assistants, and assistants to board members and other senior level administrative staff. Women were well represented (88.2% vs 81.1%), as were Visible Minorities (23.5% vs 20.9%). Aboriginal Peoples were 3 or fewer therefore numbers are not shown.
5.7 Skilled Crafts & Trades
There was only one (1) employee in this category and all equity groups were under-represented.
5.8 Clerical Personnel
This category includes records, mail clerks and general administrative assistants. Most employment equity groups were well represented in this category; women (81.0 % vs 70.7%) and Aboriginal Peoples (13.8% vs 3.1%). Persons with Disabilities were almost at par with availability (8.6% vs 9.3%), however Visible Minorities were under-represented (17.2% vs 30.6%).
5.9 Semi-Skilled Workers
There are only two (2) employees within this occupational group, none of whom have self-identified.
5.10 Summary
An analysis of occupational groups from an employment equity perspective highlights opportunities for increasing representation in under-represented occupational groups, and maintaining or improving in occupational groups that are well represented already.
Women exceeded availability by 14.4%. They were highly represented in all occupational groups, except for Skilled Crafts and Semi-Skilled Workers, noting that the CER only has three (3) staff in those two groups. The top occupational groups for Women were Professionals (185 or 56.8%), Clerical Personnel (47 or 14.4%) and Administrative and Senior Clerical (45 or 13.8%).
Aboriginal Peoples exceeded availability by 2.4%. The top occupational groups for Aboriginal Peoples were Professionals, Semi-Professionals & Technicians, Administrative & Senior Clerical, and Clerical Personnel. Opportunities for improvement were noted in the Senior Management and Middle Management groups.
Visible Minorities fell short of workforce availability by -10.2%. They were less that availability in all occupational groups except for Administrative & Senior Clerical. It is noted that there was a significant increase in the number of Visible Minorities available in the workforce compared to the prior census data used in last year’s report. This indicates that a more vigorous focus for this employment equity group is warranted.
Persons with Disabilities also saw an increased availability for this report compared to prior census data. At the CER, Persons with Disabilities fell short of workforce availability by -5.4%. While they exceeded availability in the Senior Managers group and were on par with availability in the Semi-Professionals & Technicians and Clerical Personnel, they were less than available workforce in all other occupational groups. Additional focus on this employment equity group is indicated.
TABLE 2: Comparison of Employee Population with Availability Data by Employment Equity Groups and by Occupational Groups
(as of March 31, 2019)
| Employment Equity Occupational Group |
Total | Men | Women | Aboriginal Peoples | Visible Minorities | Persons With DisabilitiesTable Note ** |
|---|---|---|---|---|---|---|
| 01: Senior Managers | 14 | 6 | 8 | 0 | Table Note * | Table Note * |
| CER% : Census% | 42.9% : 72.4% | 57.1% : 27.6% | 0% : 3.2% | Table Note *% : 11.5% | Table Note *% : 5% | |
| 02: Middle Managers | 31 | 17 | 14 | 0 | Table Note * | Table Note * |
| CER% : Census% | 54.8% : 60.6% | 45.2% : 39.4% | 0% : 2.7% | 9.6%: 17.6% | 3.2% : 5% | |
| 03: Professionals | 305 | 120 | 185 | 11 | 33 | 12 |
| CER% : Census% | 39.3% : 54.9% | 60.7% : 45.1% | 3.6% : 2.4% | 10.8% :22.1% | 3.9% : 8.9% | |
| 04: Semi-Profess. & Technicians | 39 | 16 | 23 | Table Note * | Table Note * | Table Note * |
| CER% : Census% | 41% : 61.2% | 59% : 38.8% | 7.7% : 3.4% | Table Note *% : 19.2% | *%: 7.6% | |
| 05: Supervisors | 4 | 0 | 4 | 0 | Table Note * | 0 |
| CER% : Census% | 0% : 46.2% | 100% : 53.8% | 0% : 3.1% | Table Note *% : 36.7% | 0% : 27.5% | |
| 07: Administrative & Senior Clerical | 51 | 6 | 45 | * | 12 | 0 |
| CER% : Census% | 11.8% : 18.9% | 88.2% : 81.1% | 5.9% : 2.9% | 23.5% : 20.9% | 0% : 10% | |
| 09: Skilled Crafts and Trade Workers | 1 | * | 0 | 0 | 0 | 0 |
| CER% : Census% | 100% : 93.2% | 0% : 6.8% | 0% : 3.8% | 0% : 24.3% | 0% : 7.8% | |
| 10: Clerical Personnel | 58 | 11 | 47 | 8 | 10 | 5 |
| CER% : Census% | 19% : 29.3% | 81% : 70.7% | 13.8% : 3.1% | 17.2% : 30.6% | 8.6% : 9.3% | |
| 12: Semi-Skilled Manual Workers | 1 | 1 | 0 | 0 | 0 | 0 |
| CER% : Census% | 100% : 85.6% | 0% : 14.4% | 0% : 3.0% | 0% : 40.1% | 0% : 10% | |
| Totals | 504 | 178 | 326 | 25 | 61 | 22 |
|
Note: Occupational Groups will not add up to the totals as employees may belong to more than one designated groups. Note: The #s which precede the Employment Equity Occupational Groups in column 1 are non-sequential numeric codes. |
||||||
6.0 Analysis of the Numbers of Employee Hires, Promotions and Regrettable Departures
Tables 3, 4 and 5 summarize new employee hires, promotions and departure activity between April 1st, 2018 and March 31st, 2019.
6.1 Employee Hires
Table 3 reports 22 employees were hired. Of those, 11 (50%) were women. Although there were Visible Minorities and Persons with Disabilities hired, their numbers are three (3) or less in each category and therefore not disclosed.
6.2 Employee Promotions
Table 4 shows that 40 employees were promoted during this period, approximately 17% fewer than last year. Like last year, the majority of promotions (75%) were Women, and eight (20%) were Visible Minorities. No Aboriginal Peoples were promoted.
6.3 Employee Departures
Table 5 shows that of the 17 employees who left the CER during this period, eight (47%) were Women. The departure of Visible Minorities was three (3) or less, hence not specified. As in past reports, these departures primarily occurred among the Professional occupational group.
6.4 Summary
Analysis of hires, promotions and departures suggests that Women continue to account for the greatest staff movements into, within, and out of the CER. This makes sense since Women accounted for almost 65% of the CER’s workforce in 2018/19, as per Table 1.
7.0 Conclusion and Recommendations
The CER’s overall workforce exceeds representation in two employment equity groups: Women and Aboriginal Peoples. There is an under-representation within Visible Minorities and Persons with Disabilities.
The CER is committed to ensuring our internal selection processes are barrier-free and do not restrict participation of any Canadian citizen, in addition to supporting the development of all our employees.
As one avenue for improving our representation in the various groups, the CER promotes diversity within the workforce to take into consideration employment equity needs in staffing actions. Job postings ensuring the following statement is included: “The CER is committed to having a skilled and diversified workforce representative of the population we serve. In support of our strategy to achieve our employment equity goals, selection may be limited to candidates self-identifying as belonging to one of the following employment equity groups: women, aboriginal persons, visible minorities and persons with disability.” The Public Service Commission template for posting job opportunities also promotes employment equity and encourages candidates to indicate voluntarily on their application if they are a member of one of the four groups.
In order to increase the CER’s numbers in under-represented employee equity groups and within specific occupational groups, targeted staffing where gaps currently exist is recommended. Plans are already underway this fiscal year to create an Indigenous and a Visible Minorities inventory for entry level positions. Targeted opportunities for upward mobility should also be provided via succession planning, leadership development, formal learning and access to internal developmental opportunities. Consideration should also be given to targeted recruitment campaigns at job fairs, universities, on-line venues and social media.
TABLE 3: Comparison of Employee Hires with Availability Data by Employment Equity Groups and by Occupational Groups
– April 1, 2018 to March 31, 2019
| Employment Equity Occupational Group | Total | Men | Women | Aboriginal Peoples | Visible Minorities | Persons With DisabilitiesTable Note ** |
|---|---|---|---|---|---|---|
| 01: Senior Managers | 0 | 0 | 0 | 0 | 0 | 0 |
| CER% : Census% | 0% : 72.4% | 0% : 27.6% | 0% : 1.7% | 0% : 10.4% | 0% : 4.3% | |
| 02: Middle Managers | 1 | 0 | 1 | 0 | 0 | 0 |
| CER% : Census% | 0% : 60.6% | 100% : 39.4% | 0% : 1.7% | 0% : 19.1% | 0% : 4.3% | |
| 03: Professionals | 17 | 11 | 6 | 0 | Table Note * | Table Note * |
| CER% : Census% | 64.7% : 54.9% | 35.3% : 45.1% | 0 % : 1.4% | Table Note *% :24.8% | Table Note *% : 3.8% | |
| 04: Semi-Professionals & Technicians | 1 | 0 | 1 | 0 | 0 | 0 |
| CER% : Census% | 0% : 41.7% | 100% : 58.3% | 0% : 2.6% | 0% : 23.2% | 0%: 4.6% | |
| 07: Administrative & Senior Clerical | 3 | 0 | 3 | 0 | Table Note * | 0 |
| CER% : Census% | 0% : 18.9% | 100% : 81.1% | 0% : 2.6% | Table Note *% : 16.5% | 0% : 3.4% | |
| 10: Clerical Personnel | 0 | 0 | 0 | 0 | 0 | 0 |
| CER% : Census% | 0% : 29.3% | 0% : 70.7% | 0% : 3.0% | 0% : 24.3% | 0% : 7.0% | |
| Totals | 22 | 11 | 11 | 0 | Table Note * | Table Note * |
|
Note: Occupational Groups will not add up to the totals as employees may belong to more than one designated groups. Note: The #s which precede the Employment Equity Occupational Groups in column 1 are non-sequential numeric codes. | ||||||
TABLE 4: Employee Promotions by Employment Equity Groups and by Occupational Groups
– 1 April 2018 to 31 March 2019
| Employment Equity Occupational Group | Total | Men | Women | Aboriginal Peoples | Visible Minorities | Persons with Disabilities |
|---|---|---|---|---|---|---|
| 01: Senior Managers | 2 | 1 | 1 | 0 | 0 | Table Note * |
| 02: Middle Managers | 1 | 0 | 1 | 0 | 0 | 0 |
| 03: Professionals | 36 | 10 | 26 | 0 | 8 | 0 |
| 04: Semi-Professionals & Technicians | 1 | 0 | 1 | 0 | 0 | 0 |
| 05: Supervisors | 0 | 0 | 0 | 0 | 0 | 0 |
| 07: Administrative & Senior Clerical Personnel | 1 | 0 | 1 | 0 | 0 | 0 |
| 10: Clerical Personnel | 0 | 0 | 0 | 0 | 0 | 0 |
| Total | 40 | 10 | 30 | 0 | 8 | Table Note * |
|
Note: Occupational Groups will not add up to the totals as employees may belong to more than one designated groups. Note: The #s which precede the Employment Equity Occupational Groups in column 1 are non-sequential numeric codes. |
||||||
TABLE 5: Employee Departures by Employment Equity Groups and by Occupational Groups
– April 1, 2018 to March 31, 2019
| Employment Equity Occupational Group | Total | Men | Women | Aboriginal Peoples | Visible Minorities | Persons with Disabilities |
|---|---|---|---|---|---|---|
| 01: Senior Managers | 1 | 1 | 0 | 0 | 0 | 0 |
| 02: Middle Managers | 1 | 1 | 0 | 0 | 0 | 0 |
| 03: Professionals | 9 | 4 | 5 | 0 | Table Note * | 0 |
| 04: Semi-Professionals &Technicians | 0 | 0 | 0 | 0 | 0 | 0 |
| 05: Supervisors | 0 | 0 | 0 | 0 | 0 | 0 |
| 07: Administrative & Senior Clerical Personnel | 3 | 2 | 1 | Table Note * | 0 | 0 |
| 10: Clerical Personnel | 3 | 0 | 3 | 0 | 0 | 0 |
| Total | 17 | 8 | 9 | Table Note * | Table Note * | 0 |
|
Note: Occupational Groups will not add up to the totals as employees may belong to more than one designated groups. Note: The #s which precede the Employment Equity Occupational Groups in column 1 are non-sequential numeric codes. |
||||||
TABLE 6: Workforce Availability – Women
(as of March 31, 2019)
| Employment Equity Occupational Group | All Employees | Representation | Availability | Gap | ||
|---|---|---|---|---|---|---|
| # | # | % | % | # | # | |
| 01: Senior Managers | 14 | 8 | 57.1% | 27.6% | 4 | +4 |
| 02: Middle Managers | 31 | 14 | 45.2% | 39.4% | 12 | +2 |
| 03: Professionals | 305 | 185 | 60.7% | 45.1% | 138 | +47 |
| 04: Semi-Professionals & Technicians | 39 | 23 | 59% | 38.8% | 15 | +8 |
| 05: Supervisors | 4 | 4 | 100% | 53.8% | * | * |
| 07: Administrative & Senior Clerical Personnel | 51 | 45 | 88.2% | 81.1% | 41 | +4 |
| 09: Skilled Crafts & Trades Workers | 1 | 0 | 0% | 6.8% | 0 | 0 |
| 10: Clerical Personnel | 58 | 47 | 81% | 70.7% | 41 | +6 |
| 12: Semi-Skilled Worker | 1 | 0 | 0% | 14.4% | 0 | 0 |
| Total | 504 | 326 | 64.7% | 50.3% | 253 | +73 |
Note: The #s which precede the Employment Equity Occupational Groups in column 1 are non-sequential numeric codes. |
||||||
TABLE 7: Workforce Availability – Aboriginal Peoples
(as of March 31, 2019)
| Employment Equity Occupational Group | All Employees | Representation | Availability | Gap | ||
|---|---|---|---|---|---|---|
| # | # | % | % | # | # | |
| 01: Senior Managers | 14 | 0 | 0% | 3.2% | 0 | 0 |
| 02: Middle Managers | 31 | 0 | 0% | 2.7% | Table Note * | Table Note * |
| 03: Professionals | 305 | 11 | 3.6% | 2.4% | 7 | +4 |
| 04: Semi-Professionals & Technicians | 39 | 3 | 7.7% | 3.4% | Table Note * | Table Note * |
| 05: Supervisors | 4 | 0 | 0.0% | 3.1% | 0 | 0 |
| 07: Administrative & Senior Clerical Personnel | 51 | Table Note * | 5.9% | 2.9% | Table Note * | Table Note * |
| 09: Skilled Crafts & Trades Workers | 1 | 0 | 0% | 3.8% | 0 | 0 |
| 10: Clerical Personnel | 58 | 8 | 13.8% | 3.1% | Table Note * | Table Note * |
| 12: Semi-Skilled Worker | 1 | 0 | 0% | 3.0% | 0 | 0 |
| Total | 504 | Table Note * | 5% | 2.7% | 12 | Table Note * |
|
Note: The #s which precede the Employment Equity Occupational Groups in column 1 are non-sequential numeric codes. |
||||||
TABLE 8: Workforce Availability – Visible Minorities
(as of March 31, 2019)
| Employment Equity Occupational Group | All Employees | Representation | Availability | Gap | ||
|---|---|---|---|---|---|---|
| # | # | % | % | # | # | |
| 01: Senior Managers | 14 | Table Note * | 7.1% | 11.5% | Table Note * | Table Note * |
| 02: Middle Managers | 31 | Table Note * | 9.7% | 17.6% | 5 | Table Note * |
| 03: Professionals | 305 | 33 | 10.8% | 22.1% | 67 | -34 |
| 04: Semi-Professionals & Technicians | 39 | Table Note * | 2.6% | 19.2% | 7 | Table Note * |
| 05: Supervisors | 4 | Table Note * | 25% | 36.7% | Table Note * | Table Note * |
| 07: Administrative & Senior Clerical Personnel | 51 | 12 | 23.5% | 20.9% | 11 | +1 |
| 09: Skilled Crafts & Trades Workers | 1 | 0 | 0% | 24.3% | 0 | 0 |
| 10: Clerical Personnel | 58 | 10 | 17.2% | 30.6% | 18 | -18 |
| 12: Semi-Skilled Worker | 1 | 0 | 0% | 40.1% | 0 | 0 |
| Total | 504 | 61 | 12.1% | 22.3% | 111 | -50 |
|
Note: The #s which precede the Employment Equity Occupational Groups in column 1 are non-sequential numeric codes. |
||||||
TABLE 9: Workforce Availability – Persons with Disabilities
(as of March 31, 2019)
| Employment Equity Occupational Group | All Employees | Representation | Availability | Gap | ||
|---|---|---|---|---|---|---|
| # | # | % | % | # | # | |
| 01/02: ManagersTable Note ** | 45 | Table Note * | 4.4% | 5.0% | Table Note * | Table Note * |
| 03: Professionals | 305 | 12 | 3.9% | 8.9% | 27 | -15 |
| 04: Semi-Professionals & Technicians | 39 | Table Note * | 7.7% | 7.6% | Table Note * | Table Note * |
| 05: Supervisors | 4 | 0 | 0% | 27.5% | Table Note * | Table Note * |
| 06: Administrative & Senior Clerical Personnel | 51 | 0 | 0% | 10% | 5 | -5 |
| 07: Skilled Crafts & Trades Workers | 1 | 0 | 0% | 7.8% | 0 | 0 |
| 08: Clerical Personnel | 58 | 5 | 8.6% | 9.3% | 5 | 0 |
| 09: Semi-Skilled Worker | 1 | 0 | 0% | 10.3% | 0 | 0 |
| Total | 504 | 22 | 4.3% | 8.8% | 43 | -21 |
|
Note: The #s which precede the Employment Equity Occupational Groups in column 1 are non-sequential numeric codes. |
||||||
CHART 1: Employment Equity Representation: Women – 2014 to 2019
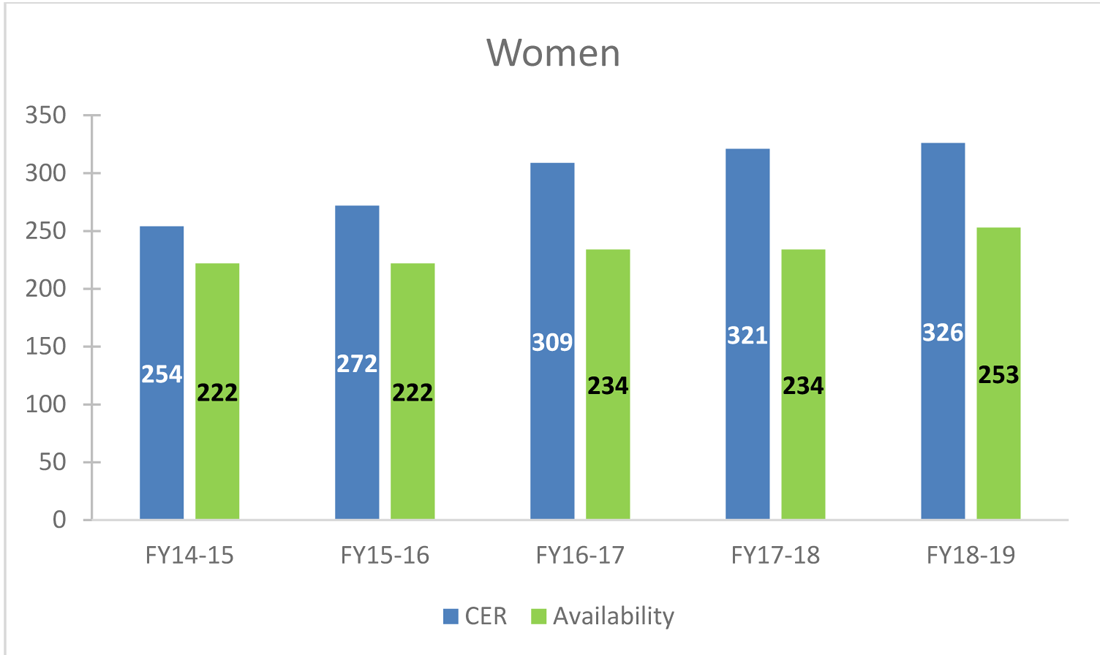
Graphic description
This bar chart compares the National Energy Board's (NEB's) number of Women employees to Canada's workforce availability of Women for the fiscal years 2014/15, 2015/16, 2016/17, 2017/18 and 2018/19
2014/15 NEB: 254
2014/15 Canada: 222
2015/16 NEB: 272
2015/16 Canada: 222
2016/17 NEB: 309
2016/17 Canada: 234
2017/18 NEB: 321
2017/18 Canada: 234
2018/19 NEB: 326
2018/19 Canada: 253
CHART 2: Employment Equity Representation: Aboriginal Peoples – 2014 to 2019
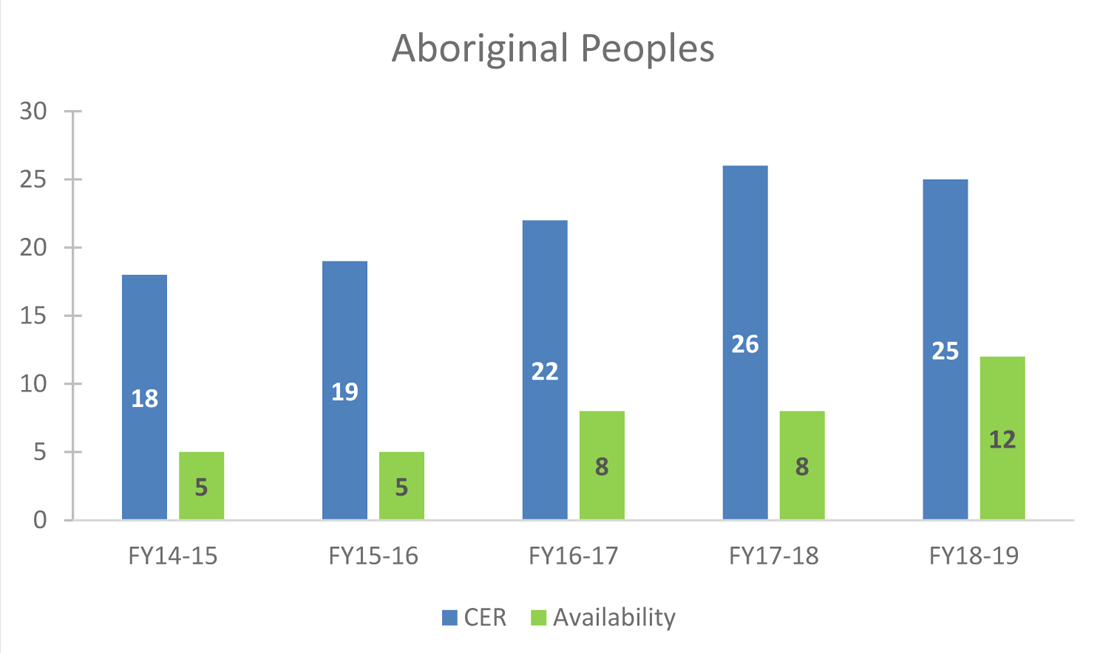
Graphic description
This bar chart compares the National Energy Board's (NEB's) number of Aboriginal employees to Canada's workforce availability of Aboriginals for the fiscal years 2014/15, 2015/16, 2016/17, 2017/18 and 2018/19.
2014/15 NEB: 18
2014/15 Canada: 5
2015/16 NEB: 19
2015/16 Canada: 5
2016/17 NEB: 22
2016/17 Canada: 8
2017/18 NEB: 26
2017/18 Canada: 8
2018/19 NEB: 25
2018/19 Canada: 12
CHART 3: Employment Equity Representation: Visible Minorities – 2014 to 2019
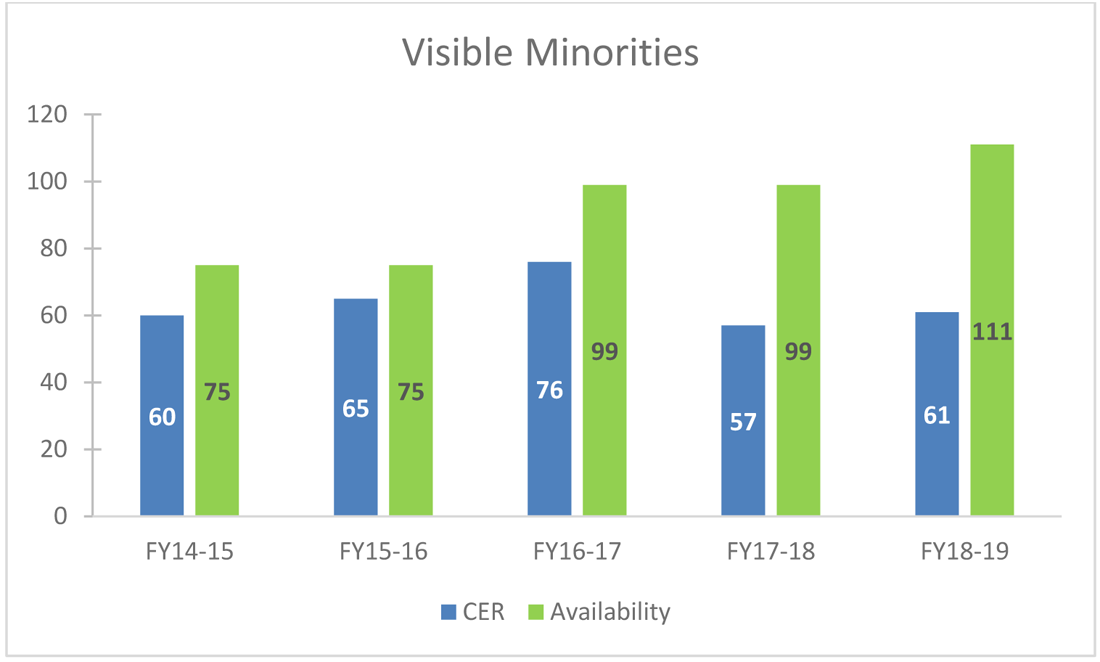
Graphic description
This bar chart compares the National Energy Board's (NEB's) number of Visible Minority employees to Canada's workforce availability of Visible Minorities for the fiscal years 2014/15, 2015/16, 2016/17, 2017/18 and 2018/19.
2014/15 NEB: 60
2014/15 Canada: 75
2015/16 NEB: 65
2015/16 Canada: 75
2016/17 NEB: 76
2016/17 Canada: 99
2017/18 NEB: 57
2017/18 Canada: 99
2018/19 NEB: 61
2018/19 Canada: 111
CHART 4: Employment Equity Representation: Persons with Disabilities – 2014 to 2019
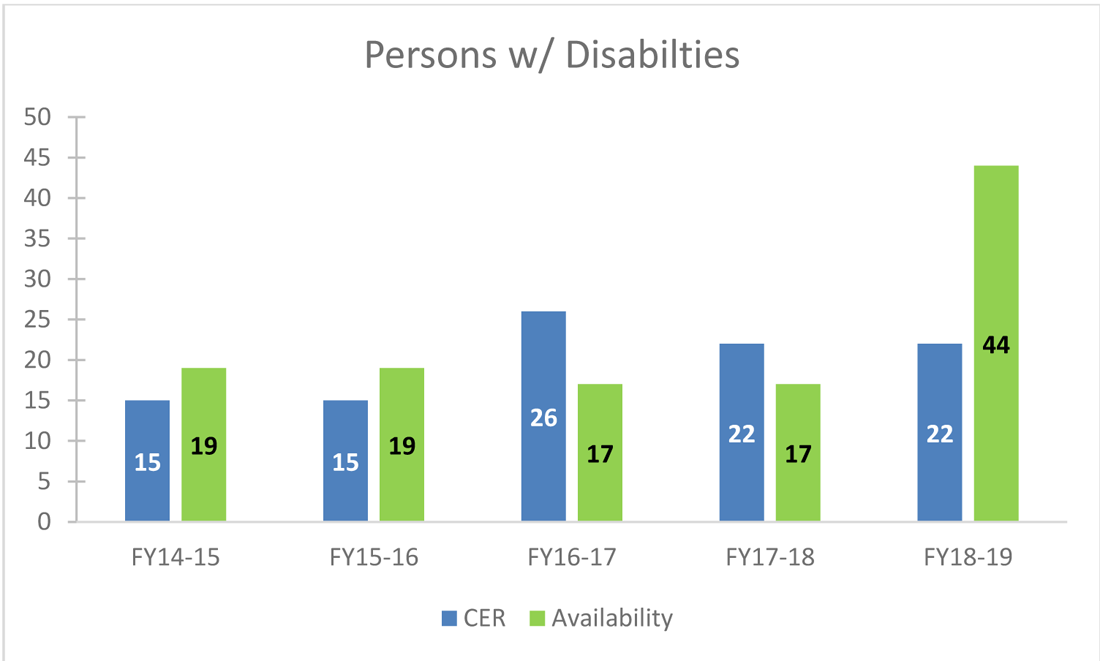
Graphic description
This bar chart compares the National Energy Board's (NEB's) number of Persons with Disabilities employees to Canada's workforce availability of Persons with Disabilities for the fiscal years 2014/15, 2015/16, 2016/17, 2017/18 and 2018/19.
2014/15 NEB: 15
2014/15 Canada: 19
2015/16 NEB: 15
2015/16 Canada: 19
2016/17 NEB: 26
2016/17 Canada: 17
2017/18 NEB: 22
2017/18 Canada: 17
2018/19 NEB: 22
2018/19 Canada: 44
- Date modified: