ARCHIVED – Canada Energy Regulator – 2019–20 Departmental Results Report – Analysis of trends in spending and human resources
This page has been archived on the Web
Information identified as archived is provided for reference, research or recordkeeping purposes. It is not subject to the Government of Canada Web Standards and has not been altered or updated since it was archived. Please contact us to request a format other than those available.
Actual expenditures
Departmental spending trend graph
The following graph presents planned (voted and statutory spending) over time.
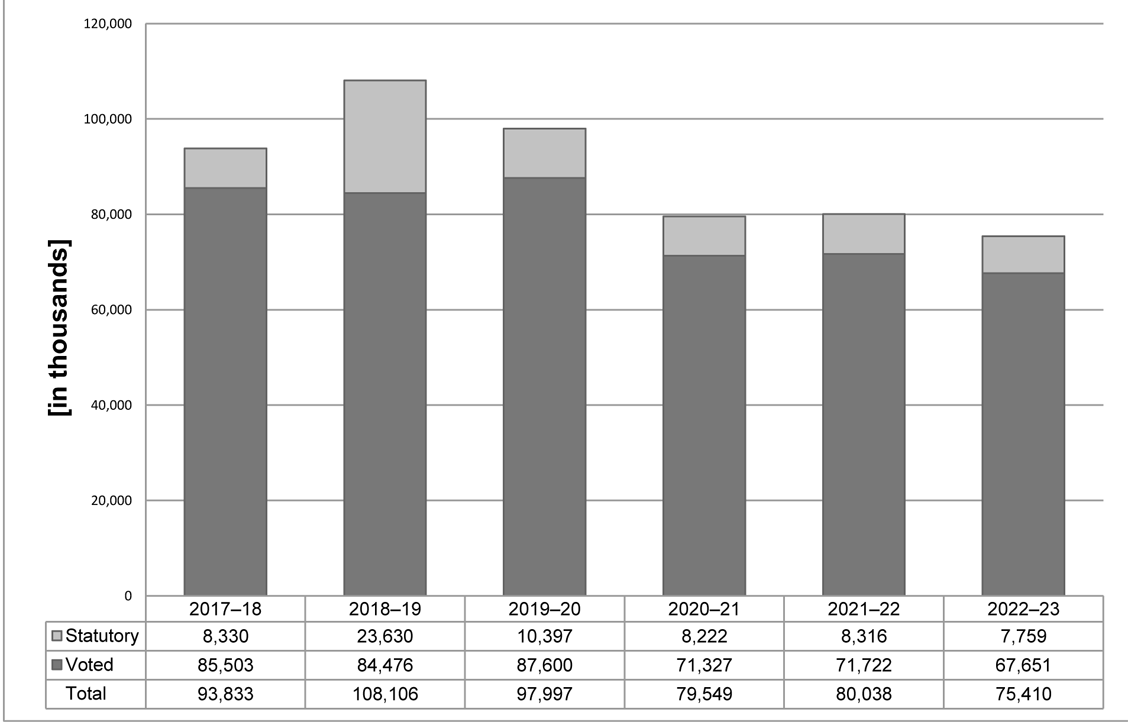
Graphic description
Departmental Spending 2017–18 to 2022–23
This bar chart shows the Canada Energy Regulator’s six-year (voted and statutory) spending trend.
2017–18 Statutory (in thousands): 8,330
2017–18 Voted (in thousands): 85,503
2017–18 Total (in thousands): 93,833
2018–19 Statutory (in thousands): 23,630
2018–19 Voted (in thousands): 84,476
2018–19 Total (in thousands): 108,106
2019–20 Statutory (in thousands): 10,397
2019–20 Voted (in thousands): 87,600
2019–20 Total (in thousands): 97,997
2020–21 Statutory (in thousands): 8,222
2020–21 Voted (in thousands): 71,327
2020–21 Total (in thousands): 79,549
2021–22 Statutory (in thousands): 8,316
2021–22 Voted (in thousands): 71,722
2021–22 Total (in thousand)s: 80,038
2022–23 Statutory (in thousands): 7,759
2022–23 Voted (in thousands): 67,651
2022–23 Total (in thousands): 75,410
The CER and its predecessor, the NEB, are funded through Parliamentary appropriations with approximately 99% of its costs recovered by the Government of Canada from the industry that the CER, and formerly the NEB, regulates. All collections from cost recovery invoices are deposited to the account the Receiver General for Canada and credited to the Consolidated Revenue Fund.
Pipeline and power line companies that hold authorizations under the Canadian Energy Regulator Act are subject to cost recovery. Applications before the CER for new facilities are not subject to cost recovery until the facility is placed into service, unless the company does not have any prior facilities regulated by the CER in which case a one-time levy is assessed following the authorization of construction.
Cost recovery is carried out on a calendar year basis.
Budgetary performance summary for Core Responsibilities and Internal ServicesTable Note a (dollars)
| Core responsibilities and Internal Services | 2019–20 Main Estimates |
2019–20 Planned spending |
2020–21 Planned spending |
2021–22 Planned spending |
2019–20 Total authorities available for use |
2019–20 Actual spending (authorities used) |
2018–19 Actual spending (authorities used) |
2017–18 Actual spending (authorities used) |
|---|---|---|---|---|---|---|---|---|
| Energy Adjudication | 22,763,624 | 21,168,557 | 19,870,310 | 20,094,039 | 28,634,190 | 21,550,144 | 23,372,250 | 24,293,849 |
| Safety and Environment Oversight | 22,231,657 | 29,865,211 | 17,875,000 | 18,449,404 | 27,450,097 | 24,588,408 | 22,648,545 | 23,004,346 |
| Energy Information | 9,388,697 | 6,031,164 | 4,459,939 | 4,554,897 | 9,990,519 | 9,235,424 | 9,554,137 | 10,444,458 |
| Engagement | 5,088,269 | 9,549,898 | 7,898,891 | 7,843,943 | 6,875,335 | 7,611,046 | 5,811,773 | 4,898,235 |
| Budget Implementation – unallocated authorities | 3,670,000Table Note b | – | – | – | – | – | – | – |
| Subtotal | 63,142,247 | 66,614,830 | 50,104,140 | 50,942,283 | 72,950,141 | 62,985,022 | 61,386,705 | 62,640,888 |
| Internal Services | 32,212,504 | 25,069,921 | 29,445,190 | 29,096,036 | 37,023, 195 | 35,011,968 | 32,009,262 | 31,192,102 |
| Internal Services – GIC Remission Levy |
– | – | – | – | – | – | 14,710,000 | – |
| Total | 95,354,751 | 91,684,751 | 79,549,330 | 80,038,319 | 109,973,336 | 97,996,990 | 108,105,967 | 93,832,990 |
Variance between 2017–18 Actual spending and 2018–19 Actual spending
The NEB 2018–19 actual spending is $14.27 million higher than the 2017–18 actual spending primarily due to Governor in Council’s remission of levy to Northern Gateway Pipelines Limited Partnership that occurred in 2018–19.
Variance between 2018–19 Actual spending and 2019–20 Actual spending
A decrease of $10.11 million from 2018–19 actual spending to 2019–20 actual spending is primarily due to:
- a decrease of $14.71 million related to a levy remission to Northern Gateway Pipelines Limited Partnership;
- a decrease of $4.51 million related to TMX Project reconsideration;
- a net decrease of $2.03 million related to compensation adjustments made to terms and conditions of service or employment of the federal public administration;
- an increase of $2.35 million related to Budget 2019 CER transition cost; and,
- an increase of $9.19 million mainly related to Budget 2018 transition to new impact assessment and regulatory processes.
Variance between 2020–21 Planned spending and 2019–20 Main Estimates
The 2020–21 planned spending is $15.81 million lower than the 2019–20 Main Estimates primarily due to:
- a decrease of $3.67 million related to Budget 2019 CER transition cost;
- a decrease of $0.22 million related to TMX Project reconsideration;
- a decrease of $5.25 million related to Budget 2017 pipeline safety lifecycle oversight;
- a decrease of $0.58 million related to Budget 2017 communication and access to information capacity;
- a decrease of $13.29 million related to Budget 2015 energy transportation infrastructure;
- a decrease of $0.34 million related to Budget 2017 indigenous advisory and monitoring committee; and,
- an increase of $7.54 million related to collective agreement renewal.
Variance between 2020–21 Planned spending and 2019–20 Actual spendingFootnote 37
The 2020–21 planned spending is $18.45 million lower than the 2019–20 actual spending primarily due to:
- a decrease of $13.29 million related to Budget 2015 energy transportation infrastructure;
- a decrease of $5.83 million related to Budget 2017 pipeline safety lifecycle oversight and communication and access to information capacity;
- a decrease of $2.35 million related to Budget 2019 CER transition cost;
- a decrease of $0.87 million related to Budget 2018 transition to new impact assessment and regulatory processes;
- a decrease of $2.18 million related to employee benefit plan; and,
- a net increase of $6.07 million mainly related to compensation adjustments made to terms and conditions of service or employment of the federal public administration.
Variance between 2019–20 Total authorities available for use and 2019–20 Main Estimates
The 2019–20 total authorities available for use is $14.62 million higher than the 2019–20 Main Estimates primarily due to:
- an increase of $3.15 million related to operating budget carry forward from 2018–19 to 2019–20;
- an increase of $7.61 million related to compensation allocation as a result of adjustments made to terms and conditions of service or employment of the federal public administration;
- an increase of $2.61 million mainly related to Budget 2018 re-profiling funding to establish the organization; and,
- an increase of $1.25 million related to 2019–20 employee benefit pension.
Variance between 2019–20 Total authorities available for use and 2019–20 Actual Spending
The 2019–20 actual spending is $11.97 million lower than the 2019–20 total authorities is primarily due to:
- a decrease of $1.32 million related to Budget 2019 CER transition cost;
- a decrease of $3.71 million related to Budget 2018 transition to new impact assessment and regulatory processes;
- a decrease of $5.34 million related to compensation allocation as a result of adjustments made to terms and conditions of service or employment of the federal public administration adjustment; and,
- a net decrease of $1.6 mainly related to some project delays.
Variance between 2020–21 Planned Spending and 2019–20 Planned spendingFootnote 38
The 2020–21 planned spending is $12.14 million lower than the 2019–20 planned spending is primarily due to:
- a decrease of $13.29 million related to Budget 2015 energy transportation infrastructure;
- a decrease of $5.25 million related to Budget 2017 pipeline safety lifecycle oversight;
- a decrease of $0.58 million related to Budget 2017 communication and access to information capacity;
- a decrease of $0.22 million related to the Trans Mountain Expansion Project reconsideration; and,
- a net increase of $7.2 million related to compensation allocation as a result of adjustments made to terms and conditions of service or employment of the federal public administration adjustment.
2019–20 Budgetary actual gross spending summary (dollars)
| Core responsibilities and Internal Services | 2019–20 Actual gross spendingTable Note a |
2019–20 Actual gross spending for specified purpose accounts |
2019–20 Actual revenues netted against expenditures |
2019–20 Actual net spending (authorities used) |
|---|---|---|---|---|
| Energy Adjudication | 21,550,144 | – | – | 21,550,144 |
| Safety and Environment Oversight | 24,588,408 | – | – | 24,588,408 |
| Energy Information | 9,235,424 | – | – | 9,235,424 |
| Engagement | 7,611,046 | – | – | 7,611,046 |
| Subtotal | 62,985,022 | – | – | 62,985,022 |
| Internal Services | 35,011,968 | – | – | 35,011,968 |
| Total | 97,996,990 | – | – | 97,996,990 |
Actual Human Resources
Human resources summary for Core Responsibilities and Internal Services
| Core responsibilities and Internal Services | 2017–18 Actual full-time equivalents |
2018–19 Actual full-time equivalents |
2019–20 Planned full-time equivalents |
2019–20 Actual full-time equivalents |
2020–21 Planned full-time equivalents |
2021–22 Planned full-time equivalents |
|---|---|---|---|---|---|---|
| Energy Adjudication | 125.7 | 103.9 | 119.8 | 119.2 | 108.2 | 108.5 |
| Safety and Environment Oversight | 124.5 | 120.2 | 159.2 | 131.0 | 114.0 | 114.3 |
| Energy Information | 55.5 | 47.8 | 34.2 | 43.8 | 29.0 | 29.1 |
| Engagement | 24.0 | 34.0 | 44.0 | 37.8 | 39.3 | 39.4 |
| Subtotal | 329.7 | 305.9 | 357.2 | 331.8 | 290.5 | 291.3 |
| Internal Services | 151.6 | 170.6 | 161.3 | 162.2 | 162.5 | 161.7 |
| Total | 481.3 | 476.4 | 518.5 | 494.0 | 453.0 | 453.0 |
The increase of 42.06 FTE from 2018–19 actual to the 2019–20 planned is mainly due to funding related to Budget 2018 transition to new impact assessment and regulatory processes to assist the organization in implementing the transition to the CER.
The decrease of 24.47 FTE from 2019–20 actual to the 2019–20 planned is the net effect of staffing delays related to Budget 2018 as well as a result of implementation of CER Act.
The decrease of 65.5 FTE from 2019–20 planned to 2020–21 plannedFootnote 39 is mainly attributed to:
- Sunsetting of Budget 2015 energy transportation infrastructure
- Sunsetting of Budget 2017 for pipeline safety lifecycle oversight
Expenditures by vote
For information on the CER’s organizational voted and statutory expenditures, consult the Public Accounts of Canada 2019–2020.Footnote 40
Government of Canada spending and activities
Information on the alignment of the CER’s spending with the Government of Canada’s spending and activities is available in the GC InfoBase.Footnote 41
Financial statements and financial statements highlights
Financial statements
The CER’s financial statementsFootnote 42 (audited) for the period ended March 31, 2020, are available on the departmental website.
Financial statement highlights
Condensed Statement of Operations (unaudited) for the year ended March 31, 2020 (dollars)
| Financial information | 2019–20 Planned results |
2019–20 Actual results |
2018–19 Actual results |
Difference (2019–20 Actual results minus 2019–20 Planned results) |
Difference (2019–20 Actual results minus 2018–19 Actual results) |
|---|---|---|---|---|---|
| Total expenses | 108,008,880 | 117,383,336 | 124,393,406 | 9,374,456 | (7,010,070) |
| Total revenues | – | – | – | – | – |
| Net cost of operations before government funding and transfers | 108,008,880 | 117,383,336 | 124,393,406 | 9,374,456 | (7,010,070) |
The actual net cost of operations before Government funding and transfers in 2019–20 was $9.37 million higher than the planned results for the same fiscal year. The net increase is primarily due to:
- an increase of $2.35 million related to Budget 2019 CER transition cost;
- an increase of $0.63 million related to Budget 2018 transition to new impact assessment and regulatory processes;
- an increase of $2.72 million related to compensation allocation as a result of adjustments made to terms and conditions of service or employment of the federal public administration adjustment;
- an increase of $0.64 million related to the TMX Project reconsideration; and,
- a net increase of $3.03 million mainly related to employee benefit pension.
The actual net cost of operations before government funding and transfers in 2019–20 was $7.01 million lower than the actual results for the previous fiscal year. The net decrease is primarily due to:
- a decrease of $14.71M levy remission to Northern Gateway Pipelines Limited Partnership;
- a decrease of $3.86 million related to TMX Project reconsideration;
- a decrease of $1.69 million related to compensation allocation as a result of adjustments made to terms and conditions of service or employment of the federal public administration adjustment;
- an increase of $2.35 million related to Budget 2019 CER transition cost;
- an increase of $9.19 million related to Budget 2018 transition to new impact assessment and regulatory processes; and,
- a net increase of $1.71 million related to employee benefit plans.
Condensed Statement of Financial Position (unaudited) as of March 31, 2020 (dollars)
| Financial information | 2019–20 | 2018–19 | Difference (2019–20 minus 2018–19) |
|---|---|---|---|
| Total net liabilities | 26,566,531 | 25,836,220 | 730,311 |
| Total net financial assets | 15,064,072 | 16,162,558 | (1,098,486) |
| Departmental net debt | 11,502,459 | 9,673,662 | 1,828,797 |
| Total non-financial assets | 15,294,728 | 17,649,079 | (2,354,351) |
| Departmental net financial position | 3,792,269 | 7,975,417 | (4,183,148) |
Departmental net debt in 2019–20 has an increase of $1.83 million, in comparison to 2018–19. This is mainly due to the increases related to annual leave as well as sick leave.
Departmental net financial assets in 2019–20 has a decrease of $2.35 million, in comparison to 2018–19. This is mainly due to depreciation associated with leasehold improvements.
- Date modified: