ARCHIVED – National Energy Board – 2016–17 Departmental Results Report – Analysis of trends in spending and human resources
This page has been archived on the Web
Information identified as archived is provided for reference, research or recordkeeping purposes. It is not subject to the Government of Canada Web Standards and has not been altered or updated since it was archived. Please contact us to request a format other than those available.
Actual expenditure
Departmental spending trend graph
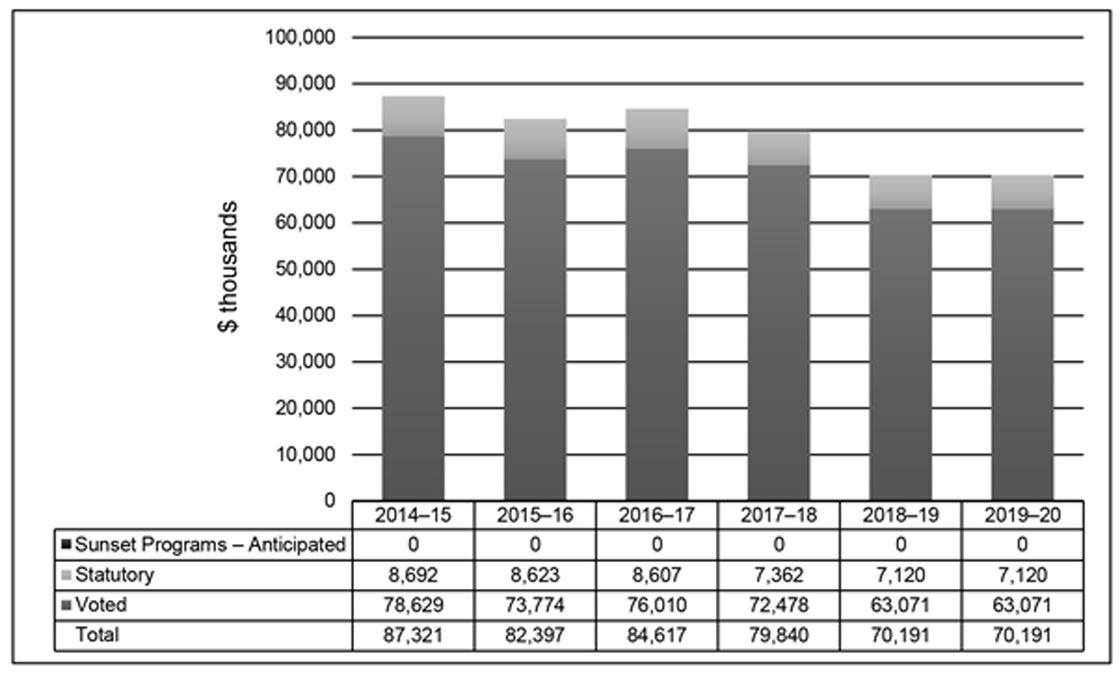
Fiscal years 2014–15 to 2016–17 reflect the department’s actual expenditures as reported in the Public Accounts. Fiscal years 2017–18 to 2019–20 represent planned spending.
The overall trend in the graph above illustrates a decrease in spending from 2014–15 to 2019–20 with a slight increase for 2016–17. The spending in 2016–17 reflects our enhanced safety and oversight activity, including enhanced engagement, announced in Budget 2015.
From 2017–18 to 2018–19 and 2019–20, overall departmental spending is planned to decrease by $9.6M, which is attributed to sunsetting temporary funding for the anticipated costs of the PFP related to the Energy East and Eastern Mainline process, a reduction in temporary funding provided for the review of mega-hearings (Energy East and Eastern Mainline), and a reduction in temporary funding related to pipeline safety.
Budgetary performance summary for Programs and Internal Services (dollars)
| Programs and Internal ServicesTable Note a | 2016–17 Main Estimates |
2016–17 Planned spending |
2017–18 Planned spending |
2018–19 Planned spending |
2016–17 Total authorities available for use |
2016–17 Actual spending (authorities used) |
2015–16 Actual spending (authorities used) |
2014–15 Actual spending (authorities used) |
|---|---|---|---|---|---|---|---|---|
| Energy Regulation | 58,584,596 | 61,322,894 | 48,368,248 | 44,081,267 | 61,255,420 | 40,961,325 | 43,185,092 | 45,310,493 |
| Energy Information | 7,307,066 | 7,648,605 | 7,632,498 | 5,015,468 | 7,542,996 | 6,125,216 | 9,018,344 | 6,567,390 |
| Subtotal | 65,891,662 | 68,971,499 | 56,000,746 | 49,096,735 | 68,798,416 | 47,086,541 | 52,203,436 | 51,877,883 |
| Internal Services | 23,533,785 | 24,633,776 | 23,839,240 | 21,094,497 | 24,358,500 | 37,530,277 | 30,193,132 | 35,443,200 |
| Total | 89,425,447 | 93,605,275 | 79,839,986 | 70,191,232 | 93,156,916 | 84,616,818 | 82,396,568 | 87,321,083 |
Variance between 2016–17 Planned Spending and 2016–17 Actual Spending
The NEB’s Actual Spending for fiscal year 2016–17 was $9.0M less than the Planned Spending. The decrease is primarily due to the following:
- a lapse of $3.5M in Participation Fund Program, due to delays in the Energy East hearing, that will be needed in future years to make payments;
- a frozen allotment of $0.5M in support of back-office Transformation and Professional Services, advertising and travel; and
- the remaining lapse of $5.0M relates to a shift in the planned spending profile of major project reviews (e.g., Energy East and Eastern Mainline), and a realignment of resources related to the adoption of the new Department Results Framework.
Variance between 2015–16 Actual Spending and 2014–15 Actual Spending
The NEB’s Actual Spending for fiscal year 2015–16 was $4.9M less than the prior fiscal year due, in large part, to the increased spending in 2014–15 related to the one-time costs of moving the NEB offices (which took place in June 2014).
Variance between 2016–17 Actual Spending and 2015–16 Actual Spending
The NEB’s Actual Spending for 2016–17 was $2.2M higher than the prior year primarily due to increased spending on activities supported by temporary funding announced for safety and enhanced public engagement activities.
Actual human resources
| Programs and Internal ServicesTable Note a | 2014–15 Actual |
2015–16 Actual |
2016–17 Forecast |
2016–17 Actual |
2017–18 Planned |
2018–19 Planned |
|---|---|---|---|---|---|---|
| Energy Regulation | 292.3 | 251.6 | 294.2 | 276.7 | 268.93 | 264.1 |
| Energy Information | 46.2 | 48.1 | 42.4 | 37.3 | 38.78 | 38.1 |
| Subtotal | 338.5 | 299.7 | 336.6 | 314 | 307.71 | 302.2 |
| Internal Services | 102.1 | 157.9 | 158.8 | 160.5 | 145.14 | 142.4 |
| Total | 440.6 | 457.6 | 495.4 | 474.5 | 452.85 | 444.6 |
Analysis
Expenditures by vote
For information on the National Energy Board’s organizational voted and statutory expenditures, consult the Public Accounts of Canada 2017.
Alignment of spending with the whole-of-government framework
| Program | Spending area | Government of Canada activity | 2016–17 Actual spending |
|---|---|---|---|
| Energy Regulation | Economic Affairs | Strong economic growth | 40,961,325 |
| Energy Information | Economic Affairs | Strong economic growth | 6,125,216 |
| Spending area | Total planned spending | Total actual spending |
|---|---|---|
| Economic affairs | 68,971,499 | 47,086,541 |
| Social affairs | – | – |
| International affairs | – | – |
| Government affairs | – | – |
Financial statements and financial statements highlights
Financial statements
The National Energy Board’s financial statements for the year ended 31 March, 2017 are available on the National Energy Board’s website.
Financial statements highlights
The National Energy Board operates on a full accrual accounting basis according to Treasury Board’s policy for reporting based on generally accepted accounting principles (GAAP). The tables below provide highlights from the NEB’s Statement of Operations and Statement of Financial Position, as presented in its 2016–17 financial statements. As such, differences do exist between these tables and those presented in other sections of the Departmental Results Report, which are prepared on the modified cash basis of accounting.
Condensed Statement of Operations for the year ended March 31, 2017 (dollars)
| Financial information | 2016–17 Planned results |
2016–17 Actual |
2015–16 Actual |
Difference (2016–17 actual minus 2016–17 planned) |
Difference (2016–17 actual minus 2015–16 actual) |
|---|---|---|---|---|---|
| Total expenses | 109,365,899 | 97,987,071 | 98,624,642 | (11,378,828) | (637,571) |
| Total revenues | – | – | – | – | – |
| Net cost of operations before government funding and transfers | 109,365,899 | 97,987,071 | 98,624,642 | (11,378,828) | (637,571) |
Difference between 2016–17 actual and 2016–17 planned
The department’s actual net cost of operations before government funding and transfer in 2016–17 was $11.4M less than the planned results for the same fiscal year. The decrease is primarily due to a lapse of $9.0M in expenditures (previously referenced), as well as a decrease of $2.4M in planned expenses due to a change in capitalization costs of planned software development and other differences between our planned and actual expenses.
Difference between 2016–17 actual and 2015–16 actual
The department’s actual net cost of operations before government funding and transfer in 2016–17 was $0.6M less than the previous year, with relatively minor differences in actual expenses in each program area between the two fiscal years.
| Financial Information | 2016–17 | 2015–16 | Difference (2016–17 minus 2015–16) |
|---|---|---|---|
| Total net liabilities | 28,287,217 | 19,031,783 | 9,255,434 |
| Total net financial assets | 22,656,539 | 13,189,146 | 9,467,393 |
| Departmental net debt | 5,630,678 | 5,843,637 | (212,959) |
| Total non-financial assets | 22,793,552 | 22,873,096 | (79,544) |
| Departmental net financial position | 17,162,874 | 17,029,459 | 133,415 |
Total net liabilities and total net financial assets have an increase of $9.3M and $9.5M, respectively when compared to 2015–16. The increases are mainly due to overbilling adjustment reflected in liabilities in 2016–17, and an under-billing adjustment reflected in assets in 2015–16.
- Date modified: