ARCHIVED – National Energy Board – 2017–18 Departmental Plan
This page has been archived on the Web
Information identified as archived is provided for reference, research or recordkeeping purposes. It is not subject to the Government of Canada Web Standards and has not been altered or updated since it was archived. Please contact us to request a format other than those available.
Spending and human resources
Planned spending
Text description of this graph
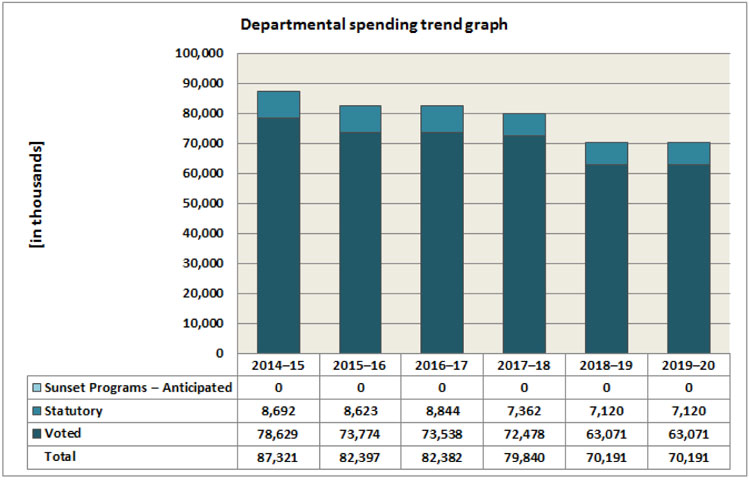
Departmental spending trend graph
This bar chart shows the National Energy Board’s six-year spending trend. It includes actual spending for the fiscal years 2014–15 and 2015–16, forecast spending for the year 2016–17 and planned spending for the years 2017–18 to 2019–20.
Actual Spending by period is as follows:
- 2014–15: $87,321
- 2015–16: $82,397
Forecast Spending by period is as follows:
- 2016–17: $82,382
Planned Spending by period is as follows:
- 2017–18: $79,840
- 2018–19: $70,191
- 2019–20: $70,191
Budgetary planning summary for Core Responsibilities and Internal Services (dollars)
| Core Responsibilities and Internal Services | 2014–15 Expenditures | 2015–16 Expenditures | 2016–17 Forecast spending | 2017–18 Main Estimates | 2017–18 Planned spending | 2018–19 Planned spending | 2019–20 Planned spending |
|---|---|---|---|---|---|---|---|
| Energy Adjudication | 30,209,718 | 26,172,193 | 25,235,723 | 28,333,982 | 28,333,982 | 20,495,319 | 20,495,319 |
| Safety and Environment Oversight | 15,100,775 | 17,012,899 | 20,617,163 | 22,807,608 | 22,807,608 | 21,503,435 | 21,503,435 |
| Energy Information | 6,567,390 | 9,018,344 | 5,973,956 | 7,289,921 | 7,289,921 | 5,755,352 | 5,755,352 |
| EngagementNote a | n/a | n/a | 2,534,233 | 2,528,944 | 2,528,944 | 3,645,316 | 3,645,316 |
| Subtotal | 51,877,883 | 52,203,436 | 54,361,076 | 60,960,455 | 60,960,455 | 51,399,422 | 51,399,422 |
| Internal Services | 35,443,200 | 30,193,132 | 28,021,243 | 18,879,531 | 18,879,531 | 18,791,809 | 18,791,809 |
| Total | 87,321,083 | 82,396,568 | 82,382,319 | 79,839,986 | 79,839,986 | 70,191,231 | 70,191,231 |
The decrease of approximately $2.5 million in planned spending in fiscal year 2017–18 compared to forecast spending in fiscal year 2016–17 is mainly attributed to the decrease in funding related to Budget 2012 Pipeline Safety Program ($5.1 million) and Budget 2014 Regulatory Review of Mega Projects ($2.1 million), partially offset by an increase in funding related to Budget 2016 Interim Strategy on Pipelines Program ($4.7 million).
The decrease of approximately $9.6 million in planned spending in fiscal year 2018–19 compared to planned spending in fiscal year 2017–18 is mainly attributed to a decrease in funding related to Budget 2016 Interim Strategy on Pipelines Program ending at the end of fiscal year 2017–18 ($4.7 million), a decrease in the re-profiled funding primarily for Budget 2014 Mega Hearings ending at the end of fiscal year 2017–18 ($4.2 million), a decrease in funding related to Budget 2015 Energy Transportation Infrastructure ($4.0 million), as well as a decrease in funding related to Budget 2012 Pipeline Safety ($1.0 million).
The NEB is funded through Parliamentary appropriations. The Government of Canada currently recovers approximately 97 per cent of the appropriation from the industry the Board regulates. All collections from cost recovery invoices are deposited to the account the Receiver General for Canada and credited to the Consolidate Revenue Fund.
Pipeline and power line companies regulated by the NEB (authorized under the NEB Act) are subject to cost recovery. Applications before the Board for new facilities are not subject to cost recovery until the facility is placed into service, unless the company does not have any prior facilities regulated by the Board in which case a one-time levy is assessed following the authorization of construction.
Cost recovery is carried out on a calendar year basis.
Planned human resources
Human resources planning summary for Core Responsibilities and Internal Services
(full-time equivalents)
| Core Responsibilities and Internal Services | 2014–15 Full-time equivalents |
2015–16 Full-time equivalents |
2016–17 Forecast full-time equivalents |
2017–18 Planned full-time equivalents |
2018–19 Planned full-time equivalents |
2019–20 Planned full-time equivalents |
|---|---|---|---|---|---|---|
| Energy Adjudication | 201.08 | 150.36 | 143.95 | 121.20 | 120.39 | 120.39 |
| Safety and Environment Oversight | 91.22 | 101.16 | 113.09 | 141.20 | 141.66 | 141.66 |
| Energy Information | 46.20 | 48.08 | 38.69 | 41.42 | 40.56 | 40.56 |
| EngagementNote a | n/a | n/a | 10.00 | 15.45 | 13.63 | 13.63 |
| Subtotal | 338.5 | 299.6 | 305.73 | 319.27 | 316.23 | 316.23 |
| Internal Services | 102.1 | 157.9 | 163.80 | 133.58 | 128.37 | 128.37 |
| Total | 440.6 | 457.5 | 469.53 | 452.85 | 444.60 | 444.60 |
The decrease of approximately 17 full-time planned human resources in fiscal year 2017–18 compared to forecast human resources in fiscal year 2016–17 is mainly attributed to the decrease in funding related to Budget 2012 Safety Program and Budget 2014 Regulatory Review of Mega Projects. The decrease of approximately 8 full-time equivalents in planned human resources in fiscal year 2018–19 compared to planned human resources in fiscal year 2017–18 is mainly attributed to the Budget 2016 Interim Strategy on Pipelines and Budget 2014 Mega Hearings ending at the end of fiscal year 2017–18.
Estimates by vote
For information on the NEB’s organizational appropriations, consult the 2017–18 Main Estimates.
Future-Oriented Condensed Statement of Operations
The Future-Oriented Condensed Statement of Operations provides a general overview of the NEB’s operations. The forecast of financial information on expenses and revenues is prepared on an accrual accounting basis to strengthen accountability and to improve transparency and financial management.
Because the Future-Oriented Condensed Statement of Operations is prepared on an accrual accounting basis, and the forecast and planned spending amounts presented in other sections of the Departmental Plan are prepared on an expenditure basis, amounts may differ.
A more detailed Future-Oriented Statement of Operations and associated notes, including a reconciliation of the net cost of operations to the requested authorities, are available on the NEB’s website.
Future Oriented Condensed Statement of Operations for the year ended March 31, 2018 (dollars)
Future Oriented Condensed Statement of Operations
for the year ended March 31, 2018 (dollars)
Future Oriented Condensed Statement of Operations for the year ended March 31, 2018 (dollars)
| Financial information | 2016–17 Forecast results |
2017–18 Planned results |
Difference (2017–18 Planned results minus 2016–17 Forecast results) |
|---|---|---|---|
| Total expenses | 99,234,413 | 96,328,839 | (2,905,574) |
| Total revenues | – | – | – |
| Net cost of operations before government funding and transfers | 99,234,413 | 96,328,839 | (2,905,574) |
2017–18 planned expenses are $96.3 million, a decrease of $2.9 million over the 2016–17 forecasted expenses of $99.2 million. This is primarily due to the following:
- a decrease of $2.5 million between 2016–17 forecasted expenditures and 2017–18 planned expenditures is mainly attributed to the decrease in funding related to Budget 2012 Safety Program and Budget 2014 Regulatory Review of Mega Projects, partially offset by an increase in funding related to Budget 2016 Interim Strategy on Pipelines Program;
- a decrease of services provided without charge of $0.7 million which relates to a decreased employee benefit plan rate, which is provided by Treasury Board; and
- an increase of amortization of $0.3 million relates to increased planned capital acquisition.
- Date modified: