Canada’s Pipeline Transportation System 2016
Enbridge Pipelines Inc.’s Enbridge Mainline
| Commodity and NEB Group | Crude oil, petroleum products, NGL (Group 1) |
| Average annual capacity | 453 300 m³/d (2.85 MMb/d)Note a |
| Average utilization 2015 | 85% |
| Primary receipt points | Edmonton, Hardisty, AB; Kerrobert, Regina, SK; Cromer, MB |
| Primary delivery points | Clearbrook, MN; Superior, WI |
| Rate base 2015 | $8,785 million |
| Revenue 2015 | $697 million |
| Abandonment Cost Estimate and Collection PeriodNote b | $1,115 million; 40 years |
Source: NEB
Text version of this map
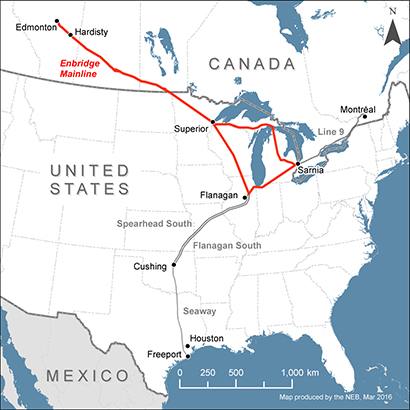
This map provides an overview of the Enbridge Mainline Pipeline System.
Overview
The Enbridge Mainline system is Canada’s largest transporter of crude oil. It originates in Edmonton, AB and extends east across the Prairies to the Canada-U.S. border near Gretna, MB where it joins with the Enbridge Lakehead System. It re-enters Canada at Sarnia, ON and connects with Line 7, and Line 9 which delivers to Montreal, QC. Figure 8.1.1 depicts the system’s configuration. The Lakehead system also connects with pipelines that deliver crude oil to Cushing, OK and the U.S. Gulf Coast.
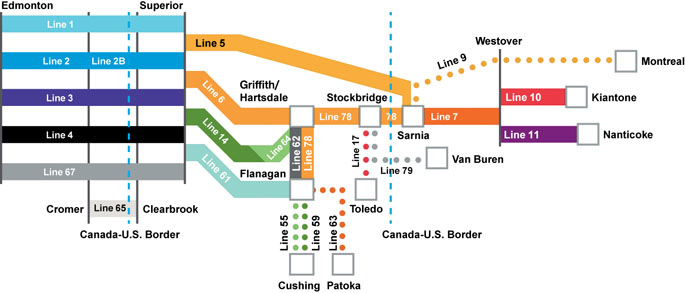
Figure 8.1.1: Enbridge Mainline System Configuration Details
Source: Enbridge
Text version of this graphic
This diagram provides an overview of the configuration of the Enbridge Mainline System.
The Enbridge Mainline has six lines exiting western Canada. Line 65 transports up to 29 600 m³/d (186 Mb/d) light and medium crude oil, and runs from Cromer, MB to Clearbrook, MN. Five lines originate in Alberta and terminate in Superior, WI:
- Line 1 transports natural gas liquids, synthetic crude oil, and refined petroleum products, with a capacity of 37 700 m³/d (237 Mb/d). The refined products are delivered upstream of Superior, MN, leaving only natural gas liquids and synthetic crude oil to be delivered to the Superior tank farm.
- Line 2 ships light crude oil and condensates, with a capacity of 70 300 m³/d (442 Mb/d).
- Line 3 ships light crude oil (and condensates from Edmonton to Hardisty, AB), with a capacity of 62 000 m³/d (390 Mb/d).
- Line 4 transports heavy crude oil (and light and medium crude oil past Clearbrook, MN), with a capacity of 126 600 m³/d (796 Mb/d).
- Line 67 (Alberta Clipper) transports heavy crude oil, with a capacity of 127 200 m³/d (800 Mb/d).
Key Developments
In December 2015, the Line 9B Reversal and Line 9 Capacity Expansion Project became operational, enabling Quebec refiners to access western Canadian crude oil by pipeline.
In 2014 and 2015, Enbridge completed the Canadian portions of the Alberta Clipper (Line 67) Expansion Project, increasing capacity by a total of 55 600 m³/d (350 Mb/d) to the full design capacity of 127 100 m³/d (800 Mb/d). This, together with flexibility enhancements, has resulted in higher throughputs on the Enbridge Mainline.
In November 2014, an application for the Line 3 Replacement Program was filed with the Board. It sought to restore the capacity of the pipeline to 127 200 m³/d (760 Mb/d) by 2019. On 25 April 2016, the Board concluded that the Enbridge Line 3 Replacement Program would be in the Canadian public interest and issued its recommendation for project approval to the federal Governor in Council.
Utilization
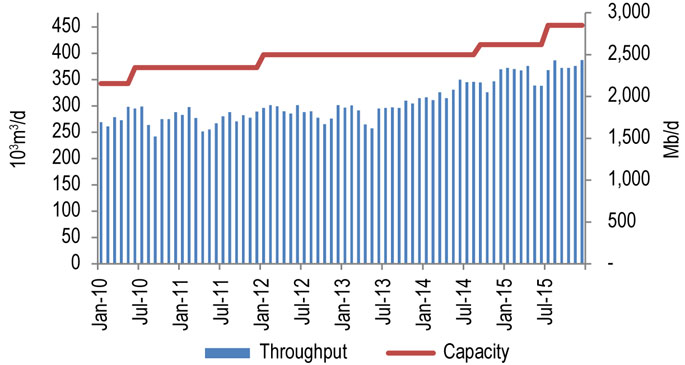
Figure 8.1.2 shows throughput and capacity for the Enbridge Mainline for 2010-2015. Capacity ended 2015 at 453 100 m³/d (2.85 MMb/d); however, effective export capacity is estimated at about 397 300 m³/d (2.5 MMb/d) due to constraints on pipelines downstream of Superior, WI.
In 2015, throughput averaged 368 700 m³/d (2.32 MMb/d), compared to 317 100 m³/d (2.11 MMb/d) in 2014.
Enbridge expects to add 63 600 m³/d (400 Mb/d) of capacity to Line 61 between Superior and Flanagan, IL by 2017, which would increase effective export capacity from Canada.
Figure 8.1.3 shows Enbridge announced apportionment in the U.S. and Figure 8.1.4 shows Enbridge announced apportionment on the Canadian section of the Mainline. At times, capacity has been inadequate to fully meet shipper demand on parts of the system in Canada and the U.S.
Figure 8.1.2: Enbridge Mainline Throughput vs. Capacity
Sources: Enbridge, NEB
Text version of this graphic
This bar chart shows Enbridge Mainline throughput and capacity between 2010 and 2015. Capacity ended 2015 at 453.1 10³m³/d (2.85 MMb/d). In 2015, throughput averaged 368.7 10³m³/d (2.32 MMb/d), compared to 317.1 10³m³/d (2.11 MMb/d) in 2014.
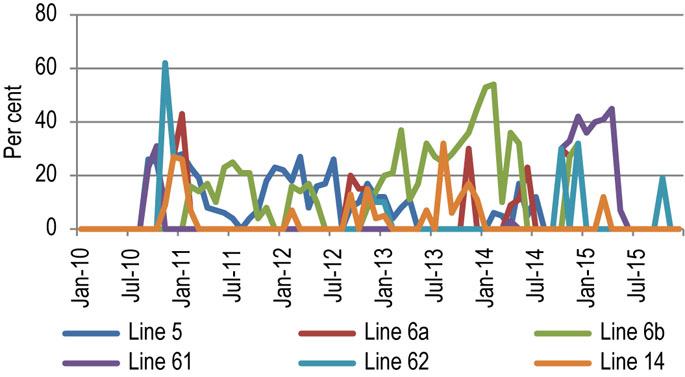
Figure 8.1.3: Apportionments Downstream of Superior
Source: Enbridge
Text version of this graphic
This line chart shows apportionment levels on the Enbridge Mainline downstream of Superior between 2010 and 2015. Since mid-2010 all six lines have been apportioned at times. Apportionment was frequently in the range of 20 to 30% but reached as high as 62% on Line 62 in late 2010. Lines 61, 62, and 14 were apportioned in various months throughout 2015.
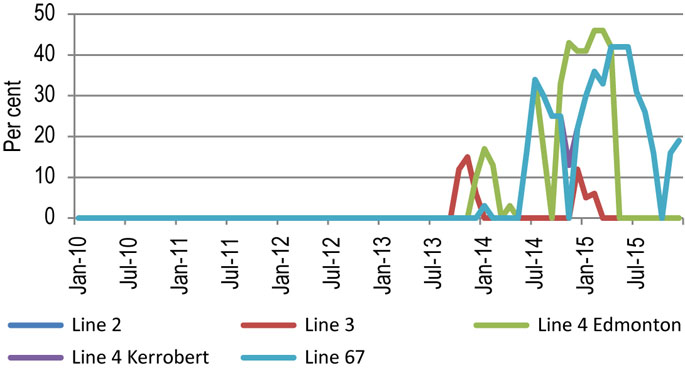
Figure 8.1.4: Enbridge Mainline Apportionments Leaving Alberta
Source: Enbridge
Text version of this graphic
This line chart shows apportionment levels leaving western Canada on the Enbridge Mainline between 2010 and 2015. Beginning in mid-2013 capacity on several lines was apportioned. Apportionment exceeded 40% on Lines 67 and 4 (Edmonton) from mid-2014 through mid-2015. Line 67 was still being apportioned at the end of 2015.
Tolls
Enbridge operates under the 2011 Competitive Tolls Settlement (CTS). The CTS came into effect on 1 July 2011 and expires on 30 June 2021. Tolls for Line 9 are not included in the CTS.
Figure 8.1.5 shows the Enbridge benchmark toll (light petroleum transportation from the Edmonton Terminal to the international border near Gretna, MB) and the GDP deflator (normalized) for 2010-2015. The benchmark toll increased by approximately 20% in 2011, mainly as a result of Enbridge Alberta Clipper pipeline costs. It increased by 23% in 2015 with the addition of the Edmonton Transportation Surcharge related to the Edmonton-to-Hardisty Pipeline Project.
Figure 8.1.5: Enbridge Mainline Benchmark Toll
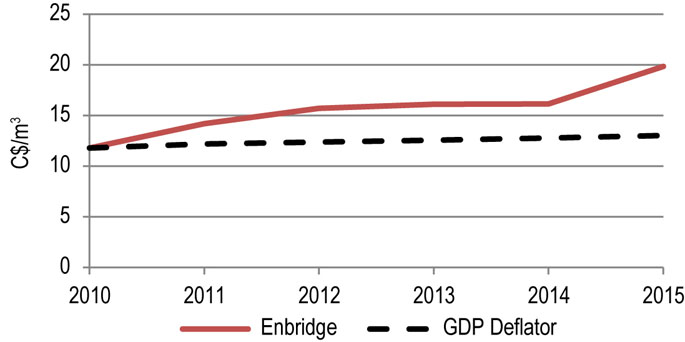
Source: NEB
Text version of this graphic
This graph shows the Enbridge benchmark toll as a solid red line and the GDP deflator as a black dashed line. The graph shows the Enbridge benchmark toll rising steadily from approximately $12.00 in 2010 to approximately $16.00 in 2012 and remains steady at that level till 2014. The toll increases sharply to approximately $20.00 in 2015.
Financial
In 2015, Enbridge Inc. completed multiple financial restructuring processes affecting Enbridge Pipelines Inc. Enbridge Pipelines Inc.’s financial ratios have weakened in recent years due to increased debt in its capital structure. Its credit rating was downgraded in 2015 by both Standard and Poor’s (S&P) and Moody’s, but remains investment grade. Each viewed Enbridge Pipeline’s parent company, Enbridge Inc., as having weakened financial metrics, increased structural subordination, and a financial policy that shifted in favour of shareholders. Dominion Bond Rating Service (DBRS) downgraded Enbridge from “A (high)” to “A” in 2011 after Enbridge implemented the CTS which introduced volume and operational risks to the Enbridge Mainline through a fixed-toll methodology as opposed to the previous cost of service method.
| Enbridge Pipelines Inc. | 2010 | 2011 | 2012 | 2013 | 2014 | 2015 |
|---|---|---|---|---|---|---|
| Revenues prior to EECI transfer (millions)Note a | $9 217 | $10 536 | $8 667 | $9 004 | $10 568 | n/a |
| Revenues post EECI transfer (millions, 2013 and 2014 restated) | $1 242 | $1 222 | $697 | |||
| Revenues from Discontinued Operations | $7 762 | $9 346 | $4 749 | |||
| Enbridge Mainline Rate Base (millions) | $4 731 | $5 193 | $5 683 | $6 387 | $8 785 | |
| Interest and Fixed-Charges Coverage Ratio | 2.11 | 2.52 | 2.39 | 1.95 | 2.08 | 1.55 |
| Cash Flow-to-Total Debt and Equivalents Ratio | 15.2% | 11.2% | 11.4% | 8.8% | 8.8% | 8.9% |
| DBRS Credit Rating | A (high) | A | A | A | A | A |
| S&P Credit Rating | A- | A- | A- | A- | A- | BBB+ |
| Moody’s Credit Rating | Baa1 | Baa1 | Baa1 | Baa1 | Baa1 | Baa2 |

- Date modified: