ARCHIVED – Canadian Pipeline Transportation System – Transportation Assessment
This page has been archived on the Web
Information identified as archived is provided for reference, research or recordkeeping purposes. It is not subject to the Government of Canada Web Standards and has not been altered or updated since it was archived. Please contact us to request a format other than those available.
Canadian Pipeline Transportation System - Transportation Assessment [PDF 2425 KB]
July 2009
Copyright/Permission to Reproduce
Table of Contents
List of Figures and Tables
List of Acronyms, Abbreviations and Units
Foreword
Executive Summary
1. Introduction
2. Adequacy of Pipeline Capacity
2.1 Price Differentials and Firm Service Tolls
2.1.1 Price Differentials and Tolls on Oil Pipelines
2.1.2 Price Differentials and Natural Gas Firm Service Tolls
2.2 Capacity Utilization on Major Routes
2.2.1 Oil Pipelines
2.2.2 Natural Gas Pipelines
2.3 Apportionment
2.3.1 Enbridge
2.3.2 Trans Mountain
2.4 Looking Ahead
2.4.1 Oil Pipelines
2.4.2 Natural Gas Pipelines
2.5 Chapter Summary
3. Pipeline Tolls and Shipper Satisfaction
3.1 Negotiated Settlements
3.2 Pipeline Tolls Index
3.2.1 Oil Pipeline Tolls
3.2.2 Natural Gas Pipeline Tolls
3.2.3 Comparison of Natural Gas and Oil Pipeline Tolls
3.3 Shipper Satisfaction
3.3.1 NEB Pipelines Services Survey
3.3.2 Formal Complaints
3.3.3 Service Enhancements
3.4 Chapter Summary
4. Pipeline Financial Integrity
4.1 Common Equity
4.2 Financial Ratios
4.3 Credit Ratings
4.4 Chapter Summary
5. Conclusions
Appendix 1: Group 1 and Group 2 Pipeline Companies
Appendix 2: Pipeline Services Survey Aggregate Results
Appendix 3: Debt Rating Comparison Chart
List of Figures and Tables
Figures
| 1.1 | Major Oil Pipelines Regulated by the NEB |
| 1.2 | Major Natural Gas Pipelines Regulated by the NEB |
| 1.3 | 2008 Supply and Disposition of Natural Gas |
| 1.4 | 2008 Supply and Disposition of Crude Oil |
| 2.1 | Light Sweet Crude Export Price vs. Edmonton Par |
| 2.2 | Heavy Crude Export Price vs. WCS at Hardisty |
| 2.3 | Canadian Crude Oil Prices and Differential |
| 2.4 | Canadian Light-Heavy Differential |
| 2.5 | Alberta-Dawn Price Differential vs. TransCanada Toll and Fuel |
| 2.6 | Sumas-Station 2 Price Differential vs. Westcoast T-South Toll and Fuel |
| 2.7 | Enbridge Pipeline Throughput vs. Capacity |
| 2.8 | Trans Mountain Pipeline Throughput vs. Capacity |
| 2.9 | Express Pipeline Throughput vs. Capacity |
| 2.10 | TNPI Throughput |
| 2.11 | Cochin Pipeline Throughput |
| 2.12 | TransCanada Mainline Throughput vs. Capacity |
| 2.13 | Foothills Sask. Throughput vs. Capacity at Monchy |
| 2.14 | Westcoast Mainline Throughput vs. Capacity |
| 2.15 | Foothills South B.C. System Throughput vs. Capacity at Kingsgate |
| 2.16 | Alliance Throughput vs. Capacity |
| 2.17 | TQM Throughput vs. Capacity |
| 2.18 | M&NP Throughput vs. Capacity |
| 3.1 | Negotiated Settlements Timeline |
| 3.2 | NEB-Regulated Oil Pipeline Benchmark Tolls |
| 3.3 | NEB-Regulated Natural Gas Pipeline Benchmark Tolls |
| 3.4 | Oil and Natural Gas Pipeline Benchmark Tolls |
| 3.5 | Shipper Satisfaction on Pipeline Quality of Service |
| 3.6 | Five-Year Comparison of the Overall Quality of Service |
| 4.1 | Variance from NEB-Approved ROE - 2003 to 2007 |
| 4.2 | Fixes-Charges Coverage Ratios |
| 4.3 | Cash Flow-to-Total Debt and Equivalent Ratios |
Tables
| 2.1 | Enbridge Apportionment |
| 2.2 | Trans Mountain Apportionment |
| 2.3 | Canadian Oil Pipeline Projects |
| 2.4 | Canadian Natural Gas Pipeline Projects |
| 4.1 | Deemed Common Equity Ratios |
| 4.2 | Achieved ROEs and the RH-2-94 Formula ROE |
| 4.3 | DBRS Credit Rating History |
| 4.4 | S&P Credit Rating History |
| 4.5 | Moody's Credit Rating History |
List of Acronyms, Abbreviations and Units
Acronyms and Abbreviations
| AOS | Authorized Overrun Service |
| Alliance | Alliance Pipeline Ltd. |
| BP | BP Canada Energy Company |
| Cochin | Kinder Morgan Cochin ULC |
| DBRS | Dominion Bond Rating Service |
| EMCE | ExxonMobil Canada Energy |
| Enbridge | Enbridge Pipelines Inc. |
| Express | Express Pipeline Ltd. |
| Foothills Sask. | Foothills Pipe Lines (Sask.) Ltd. |
| Foothills South B.C. | Foothills Pipe Lines (South B.C.) Ltd. |
| Gateway | Enbridge's Gateway Pipeline Project |
| GDP | Gross domestic product |
| GiC | Governor in Council |
| ICES | IBERDROLA Canada Energy Services Ltd. |
| Keystone | TransCanada Keystone GP Ltd. |
| Keystone XL | Keystone XL Project |
| LNG | Liquefied Natural Gas |
| M&NP | Maritimes & Northeast Pipeline Management Ltd. |
| NEB or Board | National Energy Board |
| NGL | Natural Gas Liquid |
| NGTL | NOVA Gas Transmission System Ltd. |
| OEB | Ontario Energy Board |
| PADD | Petroleum Administration Defense District |
| ROE | Return on Common Equity |
| S&P | Standard & Poor's |
| T-South | Westcoast's Southern Mainline (Zone 4) |
| TNPI or Trans-Northern | Trans-Northern Pipelines Inc. |
| TQM | Trans Québec & Maritimes Pipeline Inc. |
| TransCanada or TCPL | TransCanada PipeLines Limited |
| Trans Mountain | Trans Mountain Pipeline ULC |
| U.S. | United States |
| Union Gas | Union Gas Limited |
| WCSB | Western Canada Sedimentary Basin |
| WCS | Western Canada Select |
| Westcoast | Westcoast Energy Inc. |
Units
| b/d | Barrels per day |
| Mb/d | Thousand barrels per day |
| MMb/d | Million barrels per day |
| Bcf | Billion cubic feet |
| MMcf/d | Million cubic feet per day |
| GJ | Gigajoule |
| m³/d | Kilomètre |
| 10³m³/d | Thousand cubic metres per day |
| MW | Megawatt |
| km | Kilometres |
| kPa | Kilopascal |
| psia | Pounds per square inch |
Foreword
The National Energy Board (NEB or Board) is an independent, quasi-judicial federal agency whose purpose is to promote safety and security, environmental protection and efficient energy infrastructure and markets in the Canadian public interest[*] within the mandate set by Parliament in the regulation of pipelines, energy development and trade. The NEB is an active, effective and knowledgeable partner in the responsible development of Canada's energy sector for the benefit of Canadians.
The Board's main responsibilities include regulating:
- the construction and operation of interprovincial and international oil and gas pipelines;
- tolls and tariffs on these pipelines;
- international power lines;
- the imports of natural gas and the exports of natural gas, oil, natural gas liquids (NGLs) and electricity; and
- oil and gas exploration and development on frontier lands and offshore areas not covered by provincial or federal management agreements.
This report marks the fifth year that the Board has provided an assessment of the Canadian pipeline transportation system. It utilizes data from various publicly available sources that are collected and monitored by the Board in addition to throughput data supplied by the pipeline companies. These are supplemented by the responses to the NEB Pipeline Services Survey as well as other clarification information collected by the Board in the course of its work.
The Board has an advisory function to Parliament to review and monitor matters in its jurisdiction, including the functioning of the Canadian pipeline transportation system. Accordingly, the Board has monitored and assessed this system and periodically has issued reports after obtaining the views of a cross section of parties. This report should not be viewed as a regulatory decision and the Board is not making a determination on any current or potential future application that may come before it.
If a party wishes to rely on material from this report in any regulatory proceeding, it can submit the material as it can any public document. In such a case, the material is in effect adopted by the party submitting it and that party could be required to answer questions on it.
Information about the NEB, including its publications, can be found on the Board's website: www.neb-one.gc.ca.
Executive Summary
Energy is essential to our daily lives. The Canadian pipeline transportation system delivers energy in the form of natural gas, natural gas liquids (NGLs), crude oil, and petroleum products. In 2008, approximately $127 billion worth of products moved through NEB-regulated pipelines to markets at home and in the United States (U.S.). The efficient and effective functioning of this system is critical to Canada's economic well-being. Canadians depend on this infrastructure for a safe, reliable, and efficient energy supply as well as energy trade.
The pipelines regulated by the NEB are a key element in Canada's pipeline transportation system. The purpose of this report is to determine how well these elements are working to ensure that the Board's goal "Canadians benefit from efficient energy infrastructure and markets" is being achieved. Although the majority of information presented is an update and assessment for 2008, where available, 2009 information is also provided.
In this report, the Board assesses the following factors:
- adequacy of pipeline capacity;
- pipeline tolls and shipper satisfaction; and
- the financial soundness of pipeline companies.
The specific conclusions are, as follows:
- Capacity remained tight on oil pipelines in 2008, but additional capacity nearing completion is expected to alleviate current constraints. While there was some spare capacity on some oil pipeline systems in 2008, there were periods of apportionment as incremental capacity additions were largely offset by increasing oil sands supply. A number of pipeline applications were filed and approved by the Board in 2007 and 2008; that infrastructure is now being built and additional capacity is expected as early as the fourth quarter of 2009.
There was adequate capacity in place on natural gas pipelines in 2008. Most NEB-regulated gas pipelines had excess capacity, even during the peak winter season. Pipeline utilization declined for most pipelines supplying gas from the Western Canada Sedimentary Basin (WCSB) in 2008. Declining production from the WCSB, growing demand within western Canada, and competition from other supply basins, particularly in the western U.S., resulted in reduced flows on pipelines transporting gas from western Canada. Changing supply and demand dynamics may have important implications for both new and existing pipeline systems, including possibly challenging transitions with respect to utilization and tolls. - In 2008, shippers continued to indicate that they were reasonably satisfied with the services provided by pipelines. The results of the NEB Pipeline Services Survey again rated the physical reliability of pipeline operations highly, while the degree to which pipeline companies demonstrate an attitude of continuous improvement and innovation received a lower score, indicating one area where shipper services could be improved.
- In 2008, NEB-regulated pipelines companies were financially sound. Credit ratings continued to be investment grade and key financial ratios remained stable.
Based on this review of 2008, the Board believes that, overall, the Canadian pipeline transportation system continues to work effectively.
1. Introduction
The pipeline transportation system delivers natural gas, NGLs, crude oil, and petroleum products which are critical to Canada's well-being and economic activity. In 2008, approximately $127 billion worth of products were moved through NEB-regulated pipelines to markets at home, the United States (U.S.) and offshore. The cost of providing these transportation services last year is estimated to be around $4.4 billion, not including the fuel costs paid by shippers on natural gas pipelines.
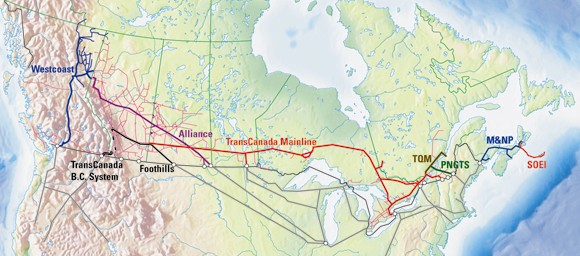
The NEB regulates approximately 70 000 kilometres (km) of oil and natural gas pipelines,[2] which are key elements in Canada's hydrocarbon transportation system (Figures 1.1 and 1.2). In addition to oil and natural gas pipelines, the system includes NGLs and oil products pipelines.
[2] This includes pipelines from the NOVA Gas Transmission System Ltd (NGTL) System. Th NEB assumed jurisdiction of the NGTL System on 29 April 2009; for more information see Section 2.4.
Figure 1.1 - Major Oil Pipelines Regulated by the NEB
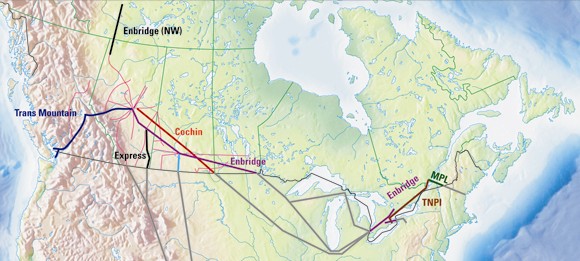
Figure 1.2 - Major Natural Gas Pipelines Regulated by the NEB
In line with its mandate to promote safety and security, environmental protection and efficient energy infrastructure and markets in the Canadian public interest[*], the Board has identified five goals that articulate its purpose and core objectives:
- NEB-regulated facilities are safe and secure, and are perceived to be so.
- NEB-regulated facilities are built and operated in a manner that protects the environment.
- Canadians benefit from efficient energy infrastructure and markets.
- The rights and interests of those affected by NEB-regulated facilities and activities are respected.
- The NEB delivers quality outcomes through innovation and leadership.
To determine whether these goals are being achieved, the Board has established various measures and a system of monitoring for each goal. Each year, the Board also issues various reports that discuss these different aspects of Canadian energy infrastructure and activities. This report focuses largely on aspects of Goal 3, and provides an update on the Board's assessment of how well the Canadian pipeline system is working. This report marks the fifth consecutive year for this assessment and utilizes the system of monitoring and measurements for the performance of the transportation system that was established in previous years.
For the pipeline transportation system to function efficiently and effectively, it must operate in a safe and environmentally acceptable manner, which relates to Goals 1 and 2. The Board reports annually on the performance of NEB-regulated pipelines in these areas in a companion report entitled, Focus on Safety and Environment - A Comparative Analysis of Pipeline Performance 2000-2007.
In this report, the following factors are assessed to determine how well NEB-regulated pipelines are working to ensure that the Board's goal "Canadians benefit from efficient energy infrastructure and markets" is being achieved:
- adequacy of pipeline capacity;
- pipeline tolls and shipper satisfaction; and
- the financial soundness of pipeline companies.
In general, an efficient pipeline transportation system will have an ability to respond on a timely basis to changing market conditions. This may entail adjustments to pipeline capacity or enhancement of pipeline services.
In its assessment, the Board uses publicly available data for Group 1 regulated companies and Express Pipeline Ltd. (Express), the largest Group 2 company.[4] These companies represent the major NEB-regulated pipelines and provide a good view of the overall functioning of the pipeline transportation system. In addition, the Board uses throughput and capacity information received from the pipelines and input from the users of NEB-regulated pipelines. Although the majority of information presented in this report is an update and assessment for 2008, where available, 2009 information is also provided. A listing of the pipeline companies regulated by the NEB, as of December 31, 2008, can be found in Appendix 1.
[4] For the purpose of the Board's financial regulation, pipeline companies are divided into two groups, Group 1 and Group 2. Historically, major oil and gas pipeline companies were designated as Group 1 and generally under full regulation the NEB, while all other NEB-regulated pipelines were designated as Group 2 and subject to a lighter degree of regulation. However, since Express, some major pipelines have been designated Group 2.
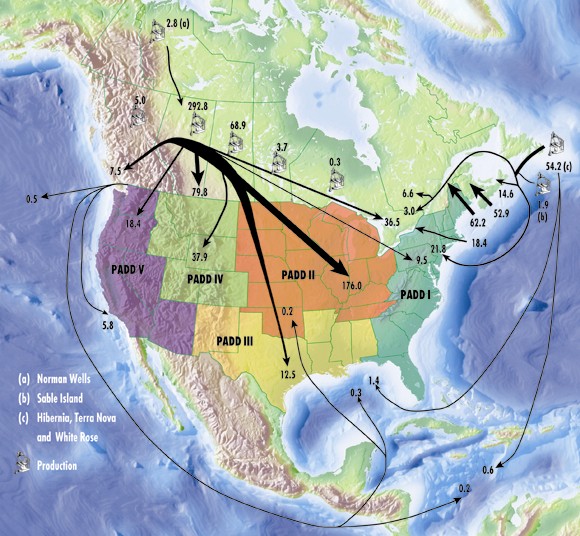
Figures 1.3 and 1.4 provide an overview of the supply and disposition of natural gas and crude oil in Canada. More information on the supply and disposition of energy in Canada can be found in the Board's report entitled, Canadian Energy Overview 2008, published in May 2009.
Figure 1.3 - 2008 Supply and Disposition of Natural Gas
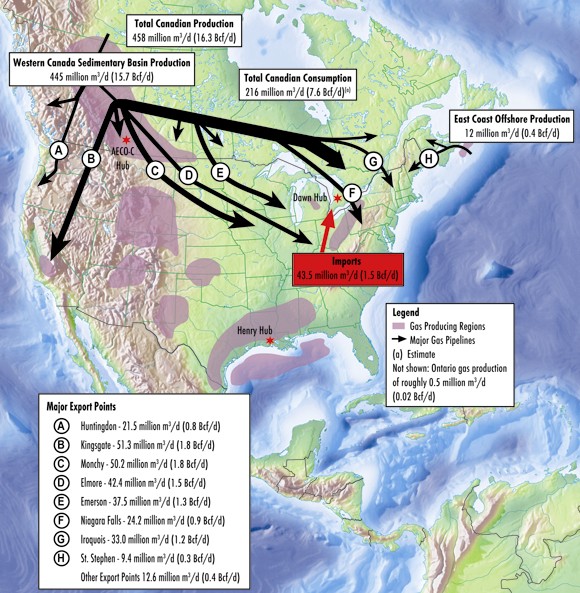
Figure 1.4 - 2008 Supply and Disposition of Crude Oil (thousand m³/d)
2. Adequacy of Pipeline Capacity
A key measure of an energy market's operational efficiency is the ability of its pipeline system to adequately transport crude oil, refined products, natural gas and NGLs from producing to consuming regions as required.
This chapter will examine the following factors to assess the current adequacy of pipeline capacity:
- price differentials compared with firm service tolls for major transportation paths;
- capacity utilization on pipelines; and
- the degree of apportionment on major oil pipelines.
The Board has generally taken the view that some excess capacity on a pipeline is desirable. This may result in higher tolls for shippers; however, the costs associated with inadequate pipeline capacity can be far greater. Substantial revenue loss for producers and governments can result when producers are unable to move oil and gas to market. In addition, excess capacity allows shippers the flexibility to access the appropriate markets as market conditions change, thereby maximizing their revenues.
2.1 Price Differentials and Firm Service Tolls
When there is adequate pipeline capacity between two market hubs, commodity prices will be connected and the price differential will be equal to, or less than, the transportation costs between the two points. As long as the price differential is less than the toll (plus fuel for natural gas pipelines), the market is indicating that there is adequate pipeline capacity between the two pricing points. In a market with adequate capacity, suppliers will generally direct their product to the market that nets the highest revenue back to the seller, thereby meeting that region's need for energy. Where inadequate capacity exists, the product cannot get to market, resulting in higher prices for downstream consumers or lower revenues to producers, creating a higher differential in price between the two end points.
2.1.1 Price Differentials and Tolls on Oil Pipelines
Figure 2.1 illustrates the Canadian export price of light crude oil netted back for tolling charges to Edmonton, Alberta compared with the Edmonton par posted price. The two prices track closely, indicating that the market is working and that, overall, adequate pipeline capacity did exist in 2008 to transport western Canada supply.
Figure 2.1 - Light Sweet Crude Export Price vs. Edmonton Par
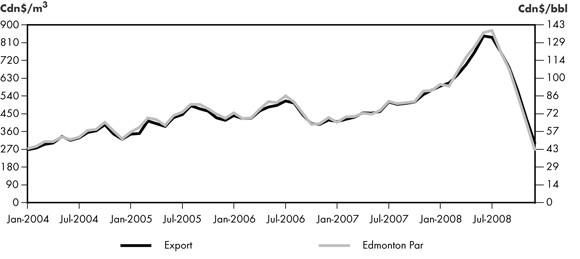
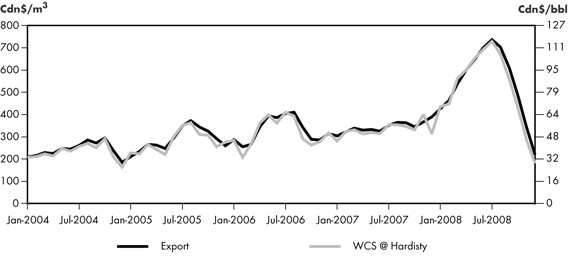
Figure 2.2 illustrates the Canadian export price of heavy crude oil netted back for tolling charges to Hardisty, Alberta compared with the Western Canada Select (WCS) price, a heavy crude oil blend at Hardisty, Alberta. The two prices track closely, further indicating that the market is working and that, overall, adequate pipeline capacity did exist in 2008 to transport western Canada supply.
Figure 2.2 - Heavy Crude Export Price vs. WCS at Hardisty
Light-heavy Price Differentials
The price differentials between Canadian light and heavy crude oil are determined by a number of factors including availability of pipeline capacity, supply and demand fundamentals at each end of the pipeline, seasonality and the grade (quality) of crude oil.
Historically, the discussion of oil price differentials has typically revolved around heavy crude oil; however, with increased production of upgraded bitumen, the relative price differentials between synthetic crude oil, Canadian light crude oil, and other crude oil supplied to U.S. refineries is becoming an increasingly important issue. Largely because of increased synthetic crude oil production and limited pipeline capacity to downstream markets, price discounts have been observed on Canadian synthetic and light crude oil. During periods of constrained supply because of planned and unplanned maintenance at upgraders, however, synthetic crude oil has at times traded at a premium to West Texas Intermediate.
Figure 2.3 shows the light-heavy differential as indicated by the difference or gap in the average price paid for Edmonton Par light crude oil and the posted price of WCS at Hardisty. As illustrated, the differential is volatile and at times has been wide.
Figure 2.3 - Canadian Crude Oil Prices and Differential
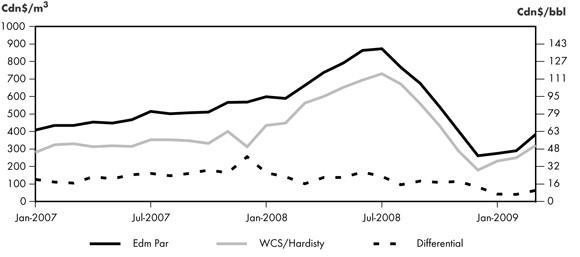
Historically, the average price differential between light and heavy crude oil benchmarks in markets where western Canadian oil competes has been around 30 per cent. In 2008, the differential began the year at about this level; however, as crude oil prices climbed through the year it narrowed considerably to about 12 per cent in August. At the close of 2008, the differential widened again to about 30 per cent following the steep drop in both light and heavy crude oil prices. In January 2009, on a dollar basis, the differential narrowed to its lowest level since February 2002 largely due to reduced OPEC supplies of heavy and sour crude oil. Figure 2.4 shows the light-heavy differential over the past several years, both on a dollar and percentage basis.
Figure 2.4 - Canadian Light-Heavy Differential

In the past, a lack of take-away pipeline capacity and limited access to refineries that can process Canadian heavy crude oil contributed to the widening of the differential. Industry, however, has been making progress in developing new markets and supporting pipelines to connect these markets. Access to the Cushing Hub through the reversed Spearhead pipeline in September 2006 and access to the U.S. Gulf Coast through the reversal of the Mobil pipeline in March 2007 are prime examples. Major pipeline projects under construction, and proposed pipelines, aim to further expand market access for both Canadian light and heavy crude oil.
2.1.2 Price Differentials and Natural Gas Firm Service Tolls
In order to use price differentials as an indicator of the adequacy of natural gas pipeline capacity, there must be reasonably reliable pricing data available. Two examples of price differentials compared with firm service tolls are provided below - one for transportation on TransCanada PipeLines Limited (TransCanada or TCPL) Mainline and one for transportation on Westcoast Energy Inc. (Westcoast), now operating as Spectra Energy Transmission.
TransCanada
Figure 2.5 shows the price differential from January 2004 to March 2009 between Alberta and the Dawn, Ontario delivery point compared with the TransCanada firm service toll between the two points, including fuel costs. While the price differential between Alberta and the Dawn delivery point fluctuates during this period, it is generally below the total cost of transportation (firm transportation plus fuel) via the TransCanada pipeline connecting these two markets. This indicates that pipeline capacity is adequate between these locations.
Figure 2.5 - Alberta-Dawn Price Differential vs. TransCanada Toll and Fuel
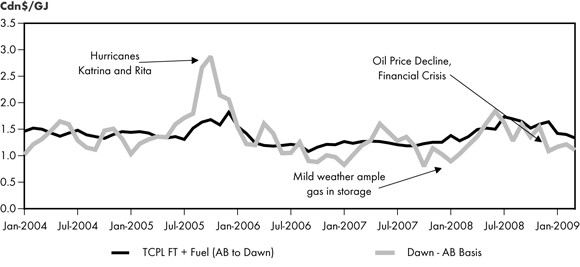
As indicated by the variation in the price difference between the two locations, natural gas pricing is very responsive to relatively small changes in flow or demand. Exceptional natural gas demand in eastern markets has resulted in short-term increases in the price differential. Examples include the summer heat wave in 2005 which produced a strong demand for natural gas-fired power generation for air conditioning, and reduced supplies from the Gulf of Mexico in the months following hurricanes Katrina and Rita (August 2005 to January 2006). Conversely, mild weather and ample gas in storage can cause the price differential and the demand for gas and transportation services to moderate, such as occurred September 2007. In the first half of 2008, natural gas prices followed the rising trend in oil prices, reaching an all-time mid-summer high before themmodity price collapse and falling Canadian dollar (relative to the U.S. dollar) resulted in an erratic decline of the price differential between Alberta and Dawn.
Spectra
Figure 2.6 shows the price differential on Westcoast's Southern Mainline (Zone 4) (Southern Mainline or T-South) between Compressor Station 2, near Chetwynd, British Columbia, and the export point at Huntingdon/Sumas, British Columbia, compared with the firm service toll for transportation between the two locations, including fuel costs. Since January 2004, except for the peak winter months in recent years, the price differential has been lower than, or close to, the cost of transportation, indicating that there has been adequate capacity in place.
Figure 2.6 - Sumas-Station 2 Price Differential vs. Westcoast T-South Toll and Fuel
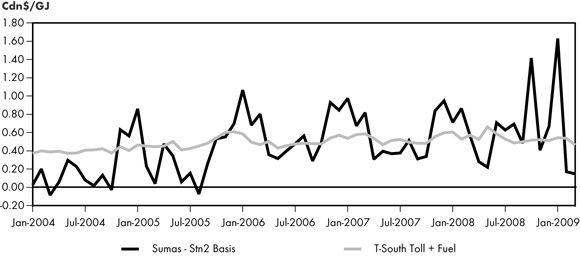
Figure 2.6 also demonstrates that natural gas pricing is volatile. Short-term increases in the price differential observed in recent years are generally a result of changes in market conditions such as hurricane-induced supply disruptions in the U.S., unpredictable weather-related demand, and availability of other transportation options during such periods. Similar to the Alberta-Dawn price movements in 2008, the Sumas-Station 2 price differential was affected by a rapid increase and subsequent decline in natural gas prices. In addition, the rapid movement in the Canada-U.S. exchange rate during October 2008 impacted the price differential.
2.2 Capacity Utilization on Major Routes
Where adequate pricing data is not available at major receipt and delivery locations on pipeline systems, another measure of adequate capacity comes from directly comparing the throughput or flow on a pipeline with its capacity. The Board monitors capacity utilization for most of the large pipelines it regulates.
The following figures show pipeline average monthly throughput compared with capacity for some of the largest NEB-regulated pipeline systems.
2.2.1 Oil Pipelines
Determining the capacity on an oil pipeline can be complex as there are many factors to be considered including the type of product, product mix, type of batching and pipeline configurations. For example when heavy crude oil is transported on a pipeline, the capacity of the pipeline is reduced. Alternatively, when lighter crude oil or refined products are transported a pipeline has more capacity.
Enbridge Pipelines Inc. (Enbridge)
The Enbridge pipeline system originates at Edmonton, Alberta and extends east across the Canadian prairies to the U.S. border near Gretna, Manitoba where it joins with the Lakehead system in the U.S. It is the largest crude oil pipeline in the world and the primary transporter of crude oil from western Canada to markets in eastern Canada and the U.S. Midwest. The Enbridge/Lakehead system also connects with pipelines that deliver crude oil to Cushing, Oklahoma and the U.S. Gulf Coast. The system consists of many lines transporting crude oil, NGLs and refined petroleum products.
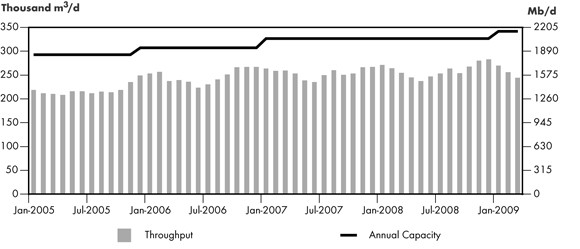
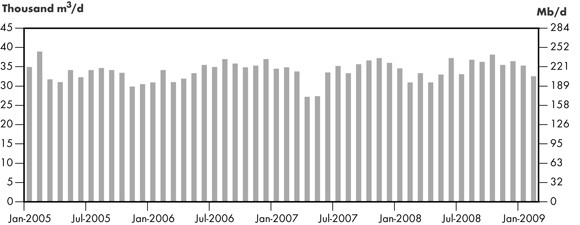
Figure 2.7 illustrates total monthly throughput versus capacity on the Enbridge system out of western Canada. Since the third quarter of 2006, however, many of its lines have been operating at or near full capacity with some lines experiencing apportionment (see Section 2.3). In 2008, Enbridge transported roughly 260 000 m³/d (1.6 MMb/d) of crude oil, petroleum products and NGLs. In the first quarter of 2009, Enbridge operated at about 80 per cent of capacity.
Figure 2.7 - Enbridge Pipeline Throughput vs. Capacity
Enbridge's Line 9 has a capacity of 38 150 m³/d (240 Mb/d) and transports crude oil from Montreal, Quebec to refineries located at Nanticoke and Sarnia, Ontario. Shipments on Line 9 have been trending downward due to increased deliveries of western Canadian crude oil to refineries in Ontario and weakening demand for gasoline and diesel.
Trans Mountain Pipeline Inc. (Trans Mountain)
Trans Mountain, owned by Kinder Morgan Canada Inc. (Kinder Morgan), transports crude oil and refined petroleum products from Edmonton, Alberta west to locations in British Columbia, Washington State and offshore. Trans Mountain's current capacity, assuming some heavy crude oil, is 42 000 m³/d (300 Mb/d). The pipeline has been operating at or near capacity for several years and on many occasions has been under apportionment (see Section 2.3).
Figure 2.8 - Trans Mountain Pipeline Throughput vs. Capacity
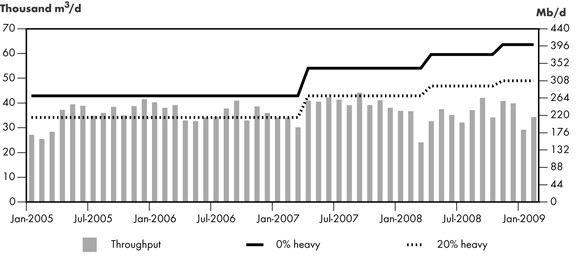
Figure 2.8 shows two capacities for the Trans Mountain pipeline; one assumes no shipments of heavy crude oil and the other assumes 20 per cent heavy crude oil. When heavy crude oil is shipped, it reduces the capacity of the pipeline. On average, in 2008 approximately 25 per cent of Trans Mountain's crude oil receipts at Edmonton were heavy crude oil.
In 2008, Trans Mountain added 6 400 m³/d (40 Mb/d) of capacity with the implementation of the two phases of the Anchor Loop Project.
In the first quarter of 2009, the pipeline operated at about 80 per cent of capacity. Refinery maintenance at a west coast refinery and refinery outages at Puget Sound reduced throughputs during this period.
Express Pipeline Inc.
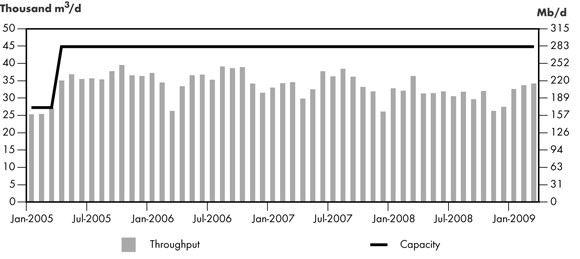
The Express system consists of two pipelines, the Express Pipeline and the Platte Pipeline. The Express pipeline originates in Hardisty, Alberta and transports crude oil to markets in Montana, Wyoming, Utah and Colorado. The Express Pipeline connects with the Platte Pipeline at Casper, Wyoming for deliveries to refineries located in Kansas and Illinois. Express has been operating below its capacity of 44 900 m³/d (280 Mb/d) over the past several years due in part to apportionment downstream on the Platte Pipeline.
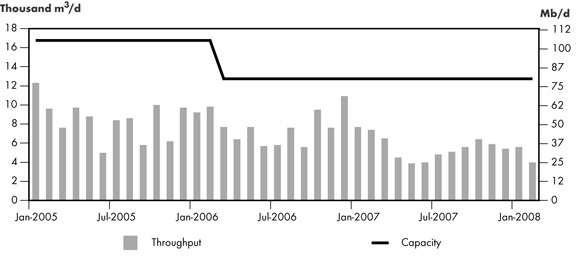
In the first quarter of 2009, the pipeline operated at approximately 78 per cent of capacity (Figure 2.9). Currently, Express is the only crude oil pipeline in western Canada that operates under long-term take-or-pay agreements with its shippers for a majority of its capacity.
Figure 2.9 - Express Pipeline Throughput vs. Capacity
Trans-Northern Pipelines Inc. (TNPI)
TNPI transports refined petroleum products west from Montreal to Toronto and operates bi-directionally between Toronto and Oakville, Ontario. TNPI also transports refined products from Imperial Oil Limited's refinery at Nanticoke, Ontario east to Toronto. Figure 2.10 shows that in the first quarter of 2009, TNPI throughput averaged 34 900 m³/d (220 Mb/d) of petroleum products. The pipeline is generally operating at capacity.
Figure 2.10 - TNPI Throughput
The capacity of TNPI is difficult to calculate because it has multiple delivery locations and different capacities on each segment of the pipeline. For example, from Montreal to Farran's Point the capacity is 21 000 m³/d (132 Mb/d); from Farran's Point to Belleville the capacity is 11 500 m³/d (72 Mb/d); and, from Belleville to Toronto the capacity is 10 000 m³/d (63 Mb/d).
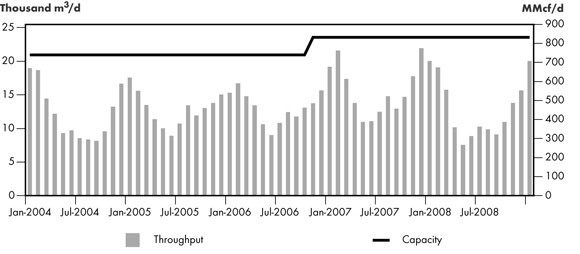
Kinder Morgan Cochin Pipeline ULC (Cochin)
The Cochin pipeline is the largest and longest NGL pipeline in Canada. The 3 000 km pipeline runs from Fort Saskatchewan, Alberta, to Windsor, Ontario, and passes through five Canadian provinces and seven U.S. states. Cochin has five terminals that deliver propane in the U.S and it has access to third-party underground storage in Fort Saskatchewan and Windsor. In addition, an interconnection with a third-party pipeline in Windsor allows the transfer of propane to Sarnia, Ontario.
Cochin has operated below capacity since 1998 as new export pipelines and the expansion of the petrochemical facilities in Fort Saskatchewan reduced volumes of NGLs available to the pipeline. Ongoing maintenance has affected pipeline capacity. Since March 2006, the pipeline has been operating at reduced pressure after a defect was discovered in the U.S. portion of the pipeline. As the pressure restriction has been applied to the entire pipeline, ethylene shipments were phased out indefinitely due to its high vapour pressure. In February 2007, Kinder Morgan announced that it would also suspend ethane deliveries commencing at the end of March 2007, pending evaluation of capital costs to restore the pipeline's capacity. Cochin has only transported propane since August 2007, as butane shipments stopped in 2002. Figure 2.11 shows Cochin throughputs and capacity.
Figure 2.11 - Cochin Pipeline Throughput
Kinder Morgan is undertaking a set of measures to improve Cochin operations. The first is the implementation of an integrity management plan in order to restore ethane transportation capacity. The plan looks to inspect the pipeline in segments over a five-year period. Each segment will be evaluated, repaired and tested hydrostatically to ensure integrity. Once all defects are corrected, the company plans to apply to increase the allowed pressure to 6 895 kPa (1000 psia). Kinder Morgan contemplates repeating the process every five years. As well, Kinder-Morgan implemented a line fill program in April 2008, with the purpose of guaranteeing a minimal inventory in the line and improving deliverability at the different destination points along the pipeline. After its successful implementation in 2008, the company plans to enhance the program in 2009.
2.2.2 Natural Gas Pipelines
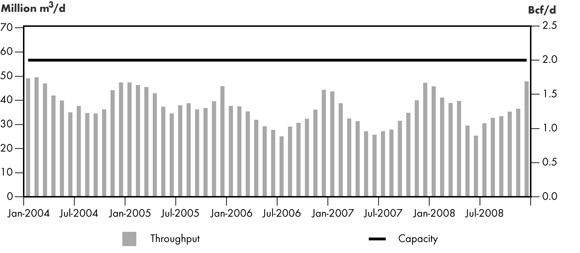
TransCanada Mainline
Figure 2.12 compares the average monthly throughput with the capacity of the TransCanada Mainline, which flows eastward from the Alberta/Saskatchewan border. This comparison illustrates that, on a monthly average basis, there has been capacity in excess of monthly throughput volumes over the period shown. However, in the months following hurricanes Katrina and Rita in 2005, there were days that the Mainline system was flowing at capacity.
Figure 2.12 - TransCanada Mainline Throughput vs. Capacity
Overall, this indicator shows that there has been adequate pipeline capacity to move western Canada volumes to eastern markets.
Excess capacity provided the impetus for TransCanada's Keystone Pipeline project. In this initiative, TransCanada proposed to transfer Line 100-1 of the Mainline to TransCanada Keystone Pipeline GP Ltd. (Keystone) for conversion to oil service. The Board approved this transfer and conversion in 2007 and construction began in 2008. The closure of Line 100-1 began in July 2008 and resulted in an annual average capacity reduction on the Mainline of approximately 14.2 million m³/d (0.5 Bcf/d), by the end of 2008.
Including the closure of Line 100-1, capacity utilization on the TransCanada Mainline was approximately 72 per cent in 2008, down from 75 per cent in 2007. Increased consumption of natural gas in Alberta, combined with a five per cent decline in year-over-year WCSB production (approximately 17.6 million m³/d (0.6 Bcf/d)) contributed to the continued trend of lower throughput on natural gas pipelines leaving Alberta for eastern markets. A remarkable 7.5 per cent increase in U.S. production, mainly from growth in the shale gas plays of Texas, Louisiana, and Arkansas and tight sands of Texas and the Rocky Mountain basins, helped to meet demand for gas in the U.S. Midwest and eastern markets and reduced the demand for Canadian gas.
Foothills Pipeline (Sask.) Ltd. (Foothills Sask.)
Figure 2.13 shows the average monthly throughputs on the Foothills Sask. pipeline compared with its capacity. This pipeline transports western Canadian gas supply to markets in the U.S. Midwest through a connection with the Northern Border Pipeline Ltd. at Monchy, Saskatchewan. Foothills Sask. throughput has displayed distinct seasonal patterns in recent years, with annual average capacity utilization running at 72 per cent in 2008, down from an average of 85 per cent in 2007. Until 2008, throughput on the Foothills Sask. pipeline had run fairly close to capacity in both the winter and the summer months to meet winter heating demand and to meet summer demand for power generation and storage injection. Throughput subsequently declined in the low-consumption spring and autumn months.
Figure 2.13 - Foothills Sask. Throughput vs. Capacity at Monchy
In May 2008, throughput on this pipeline declined dramatically and remained low throughout the summer months. The western leg of the Rockies Express pipeline in the U.S. became operational in May 2008. The Rockies Express pipeline added an average of about 28.3 million m³/d (1 Bcf/d) of natural gas from the Rockies region of the U.S. to connecting pipelines delivering gas to the Midwest U.S. market, reducing the requirement for Canadian gas in that region. Although throughput on the Foothills Sask. Pipeline picked up as winter began, the impact of a slowing economy cut demand from utilities and industrial users and throughput remained lower than traditionally seen on this pipeline. Similar to the TransCanada Mainline, the combination of increased consumption of natural gas in Alberta, and lower WCSB production resulted in less gas available to ship on the Foothills Sask. system in 2008.
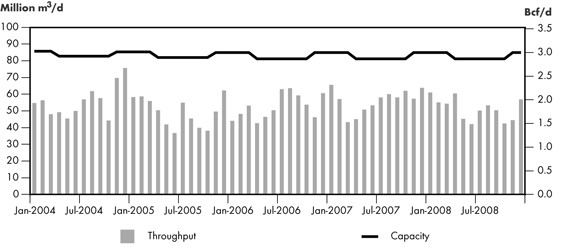
Westcoast
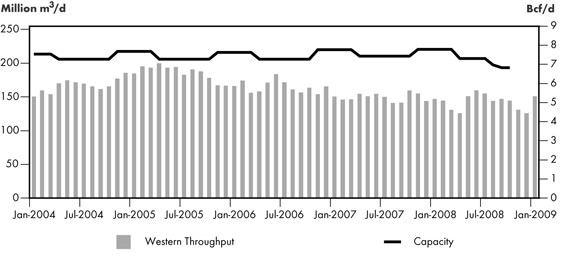
Figure 2.14 compares the average monthly throughput on Westcoast's Southern Mainline with the capacity on this system between Station 2 and the export point at Huntingdon/Sumas, British Columbia. This figure shows the seasonal nature of throughput on the Southern Mainline with higher volumes being transported during the peak winter months and less during the summer. Flows on Westcoast in recent years have been impactd by greater competition with production from the U.S. Rockies region for markets in the U.S. Pacific Northwest, mild winter weather, and increased hydro power generation in British Columbia and the U.S. Pacific Northwest. Flows in 2008, however, were up about four per cent compared to 2007 due to increased weather related demand and increased demand for natural gas for power generation in both California and the U.S. Pacific Northwest.
Figure 2.14 - Westcoast Mainline Throughput vs. Capacity
Foothills Pipe Line (South B.C.) Ltd.[5] (Foothills South B.C.)
Figure 2.15 shows the average monthly throughput and capacity on the Foothills South B.C. system, which primarily serves California. The average capacity utilization in 2008 was 62 per cent, slightly lower than in previous years. Spare capacity on this pipeline is related to supply competition which has reduced demand for exports to the U.S. from the WCSB at Kingsgate, British Columbia. California market players have transportation options enabling them to access U.S. supply from the Rocky Mountains, San Juan and Permian basins, in addition to the WCSB. When the western leg of the Rockies Express pipeline became operational in 2008, gas supplies from areas including the Anadarko basin in the Southwestern U.S., which traditionally supplied the U.S. Midwest, were forced to seek alternate markets, such as California, consequently reducing the requirement for Canadian gas in these markets.
[5] TransCanada's BC System was integrated into Foothills Pipe Lines Ltd. in 2007. In the first quarter of 2007, the NEB approved the transfer of assets and finalized the revised tolls for 2007.
Figure 2.15 - Foothills South B.C. System Throughput vs. Capacity at Kingsgate
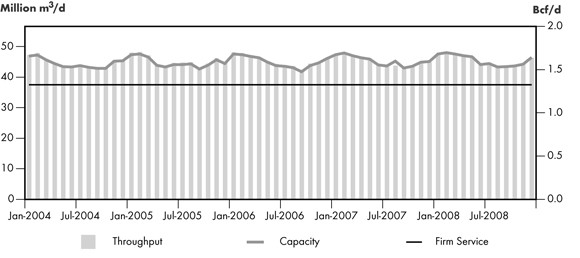
Alliance Pipeline Ltd. (Alliance)
Figure 2.16 shows the average monthly throughput on the Alliance system relative to available capacity. Alliance offers approximately 36.8 million m³/d (1.3 Bcf/d) of firm service capacity and makes any additional capacity available to its contracted shippers at a low cost as Authorized Overrun Service (AOS). Available AOS levels are determined on a daily basis and may be used at the cost of fuel only. The total available capacity varies, depending on such factors as ambient temperature and compressor unit availability (as influenced by maintenance schedules). Alliance's total available capacity has essentially been fully utilized since the commencement of service, with all available firm service contracted on a long-term basis. In 2008, throughput on the Alliance system averaged about 45.7 million m³/d (1.612 Bcf/d).
Figure 2.16 - Alliance Throughput vs. Capacity
Trans-Québec & Maritmes Pipeline (TQM)
Figure 2.17 compares the average monthly throughput and capacity on the TQM pipeline. TQM delivers gas from the TransCanada Mainline at Saint-Lazare on the Ontario and Quebec border to Quebec City and the East Hereford, Quebec export point to New Hampshire. This figure illustrates the seasonality of natural gas consumption and the variable throughput on this pipeline. Each year, higher volumes are transported during the winter months when gas requirement for residential and commercial space heating is higher. Without abundant underground storage in the region, the pipeline system is designed to meet the winter requirement. In the summer, gas consumption and flows are typically much lower, resulting in spare capacity on the pipeline.
Figure 2.17 - TQM Throughput vs. Capacity
Historically, the average annual capacity utilization of the TQM system has been around 62 per cent. In November 2006, the pipeline was expanded to supply a new gas-fired power co-generation plant at Bécancour, Quebec. As a result, average capacity utilization increased to about 67 per cent in 2007. However, following the suspension of the Bécancour Power Plant operation in early 2008, average capacity utilization of the TQM system declined to 53 per cent. Hydroelectricity surpluses in Quebec are expected to continue, making future use of the Bécancour plant uncertain.
Maritimes & Northeast Pipeline (M&NP)
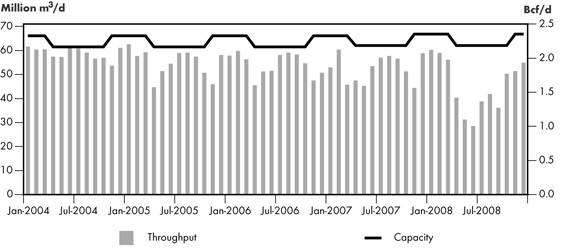
Figure 2.18 compares the average monthly capacity and throughput on M&NP. This pipeline delivers natural gas produced offshore Nova Scotia and onshore New Brunswick to markets in Nova Scotia, New Brunswick and export markets in the U.S. Northeast via an export point at St. Stephen, New Brunswick.
Figure 2.18 - M&NP Throughput vs. Capacity
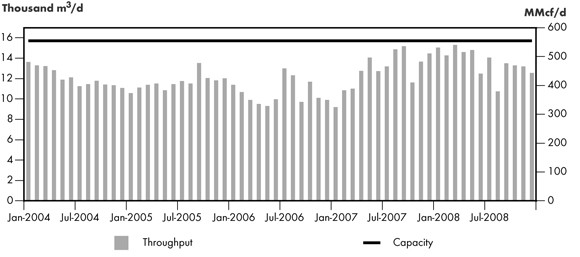
The addition of compression facilities at the Sable Island project offshore Nova Scotia, and incremental volumes from the onshore McCully field in New Brunswick helped to boost throughput on M&NP in early 2008. However, ongoing production decline and operational difficulties at Sable Island gradually reduced capacity utilization in the second half of 2008. Although average capacity utilization (87 per cent) on M&NP in 2008 was higher than in 2007, utilization in the second half of the year was about 82 per cent, down from almost 92 per cent observed in the first half.
2.3 Apportionment
As discussed in this chapter, there is generally adequate capacity on NEB regulated natural gas pipeline systems. Unlike natural gas pipelines, for the most part oil pipelines operate as common carriers. This requires shippers to nominate volumes on a monthly basis for delivery into a pipeline without a long-term contract for pipeline capacity. There are only a few oil pipelines in Canada that operate a portion of their capacity under long-term shipper take-or-pay agreements, including Express, Enbridge's Line 9 and TNPI. When shippers nominate more oil or oil products in a given month than the pipeline can transport, shipper volumes are apportioned (reduced) based on the tariff in effect. Apportionment can be caused by factors such as growing supply, increased demand, pipeline reconfigurations, reduced pipeline capacity or refinery maintenance. Apportionment levels for Enbridge and Trans Mountain are discussed below.
2.3.1 Enbridge
Enbridge currently has five pipelines that originate in Alberta. Line 1 transports NGLs, synthetic crude oil and refined petroleum products; Line 2 ships light crude oil; Lines 3 and 4 are dedicated to transporting heavy crude oil; and, Line 13 ships light crude oil. Line 13 terminates at Clearbrook, Minnesota while the other lines extend to Superior, Wisconsin where lines 5, 6, and 14 begin and provide service to the market hubs of Chicago, Illinois and eastern Canada. In January 2009, Line 65 began shipping light sour and medium crude oil, adding 29 500 m³/d (186 Mb/d) of additional capacity from Cromer, Manitoba to the U.S. border.
Enbridge throughput from March 2008 to March 2009 shows that there was some apportionment on the system during this timeframe (Table 2.1). In the fourth quarter of 2008, very high throughputs on the Enbridge system resulted in apportionment on Lines 2B, 3 and 13B. In addition, the Enbridge system was close to apportionment in October and November; however, this was averted through the cooperative efforts of the shippers and Enbridge.
Table 2.1 - Enbridge Apportionment
| Mar- 08 | Apr- 08 | May- 08 | Jun- 08 | Jul- 08 | Aug- 08 | Sept- 08 | Oct- 08 | Nov- 08 | Dec- 08a | Jan- 09b | Feb- 09 | Mar- 09 | |
|---|---|---|---|---|---|---|---|---|---|---|---|---|---|
| Apportionment | 0% | 0% | 0% | 0% | 0% | 0% | 0% | 0% | 0% | 24% | 6% | 0% | 0% |
| Throughput (10³m³/d) |
254.7 | 244.6 | 237.2 | 247.2 | 253.0 | 263.4 | 253.6 | 267.4 | 280.4 | 282.6 | 269.9 | 255.6 | 244.3 |
a) Lines 2B and 13B apportioned 24 per cent - Apportionment later lifted because of operational factors.
b) Lines 2B, 3 and 13B apportioned 6 per cent - Apportionment later lifted because of operational factors.
There was some apportionment on the Enbridge system in the first quarter of 2009. In January, there was apportionment due to supply increases of light and heavy crude oil; however, reduced nominations due to a number of Force Majeure claims resulted in apportionment being lifted. Apportionment on the pipeline that transports light crude oil was a result of expected increases in Syncrude production volumes and some additional light sweet production. In February, Canadian Natural Resource Ltd.'s Horizon project began producing synthetic crude oil, adding to throughputs on the Enbridge system. There were also forecast increases in Cold Lake production and additional heavy crude oil projects coming on-stream.
During 2008, there were several Enbridge pipeline projects under construction including Alberta Clipper, Line 4 and the LSr line (Line 65).Apportionment
2.3.2 Trans Mountain
Unlike most crude oil pipelines, capacity on the Trans Mountain pipeline system is allocated based on delivery destination: Westridge Dock or Land Destinations. Deliveries to the Westridge Dock are loaded onto marine vessels. Due to the unique nature of these marine deliveries, capacity allocated is a deemed volume based on vessel size, currently 8 270 m³/d (52 Mb/d), the equivalent of four tanker-sized cargoes and two barge-sized cargoes. Dock nominations are apportioned on an all-or-nothing basis based on a Bid Premium process when capacity allocated for Dock deliveries is over-nominated.[6]
[6] When nominating volumes for delivery into tankers or barges over the Dock, shippers are required to submit a bid price (cents per m³) that they are willing to pay to win the space, should capacity for deliveries to the Dock be over-subscribed. During months of apportionment for Dock deliveries, space is awarded on an all or nothing basis to the shippers who submit the highest premium bid values (bid price times volume) in each of the two sub-categories, barge and tanker. The number of bids accepted is dependant upon the current deemed volume allocated to the Dock.
The remainder of the capacity on the Trans Mountain system is allocated for deliveries to Land Destinations. As shown in Table 2.2, up to and including October 2008, apportionment on Trans Mountain to Land Destinations was calculated separately for deliveries to British Columbia (Domestic Destinations) and to the four Washington State pipeline-connected refineries (Export Destinations). In November 2008, following the release of the RH-4-2008 decision, Domestic and Export Destinations were combined into a single Lands Destination category apportioned on a pro rata basis for capacity allocation purposes.
Table 2.2 - TransMountain Apportionment
| Mar- 08 | Apr- 08 | May- 08 | Jun- 08 | Jul- 08 | Aug- 08 | Sept- 08 | Oct- 08 | Nov- 08 | Dec- 08 | Jan- 09 | Feb- 09 | Mar- 09 | |
|---|---|---|---|---|---|---|---|---|---|---|---|---|---|
| Apportionment | |||||||||||||
| Domestic | 0% | 0% | 0% | 0% | 0% | 0% | 0% | 0% | 0% | 0% | 0% | 0% | 0% |
| Export | 0% | 4% | 0% | 0% | 0% | 0% | 0% | 0% | 0% | 0% | 0% | 0% | 0% |
| Dock (advanced) | 0% | 7% | 0% | 0% | 0% | 0% | 4% | 10% | 1% | 2% | 0% | 0% | 0% |
| Dock (regular) | 0% | 100% | 0% | 0% | 0% | 0% | 69% | 58% | 74% | 0% | 0% | 0% | 23% |
| Throughput (10³m³/d) |
24.2 | 32.8 | 37.5 | 35.2 | 32.2 | 37.2 | 42.1 | 34.2 | 40.8 | 49.9 | 29.2 | 34.4 | 51.1 |
Dock numbers at 100% reflect full capacity utilization under advance bids.
Trans Mountain was under apportionment several times during 2008, and again in March 2009. Most of this apportionment, including the March 2009 apportionment, was applied on nominations to the Dock. Apportionment on Dock nominations reflects the continuing increase in oil sands supply and associated demand for increased shipments to export markets accessible by marine vessel. In 2008, there were 40 tanker shipments off the Westridge Dock. The large number of tanker shipments was largely driven by price weakness in the U.S. Midwest (PADD II) and an increasing interest in testing western Canadian crude oil in refineries located in Asia. In October and November, capacity became available due to operational issues at storage facilities located at Edmonton. In January and February 2009, throughputs were reduced due to refinery outages in the Puget Sound area.
2.4 Looking Ahead
An efficient pipeline transportation system should have an ability to respond on a timely basis to changing market conditions. This may invite proposed adjustments to pipeline capacity or enhancement of pipeline services.
2.4.1 Oil Pipelines
The current global economic downturn has led to the delay of many oil sands projects and, correspondingly, expectations of slower oil production growth. Oil sands production, however, continues to grow with ongoing investment. To address the need for increased capacity and greater flexibility, a number of pipeline applications were filed and approved by the Board in 2007 and 2008; that infrastructure is now being built. In addition to these projects, there are new proposals currently before the Board and potential projects yet to be filed.
In November 2007, Keystone filed an application with the Board to expand and extend its Keystone Pipeline. The application was approved by the Board in July 2008 and received Governor in Council (GiC) approval in September 2008. The project will expand the pipeline's capacity to 94 000 m³/d (590 Mb/d) and extend the U.S. portion from the Nebraska/Kansas border to the market hub of Cushing, Oklahoma.
In February 2009, Keystone filed an application with the Board for the Keystone XL Project (Keystone XL) to expand and extend the pipeline system to the U.S. Gulf Coast. If approved, Keystone XL would have an initial capacity of 111 300 m³/d (700 Mb/d) and provide transportation from western Canada to the U.S. Gulf Coast. As a result of its open season, Keystone received shipping commitments on the Keystone XL totaling 60 400 m³/d (380 Mb/d) with an average term of 17 years.
Table 2.3 summarizes recently approved and currently applied for (at the time of writing, May 2009) NEB regulated oil pipeline projects to deliver oil out of western Canada.
Table 2.3 - Canadian Oil Pipeline Projects
| Pipeline | NEB Filing Date/ NEB approval date | Capacity Increase m³/d (Mb/d) | Proponents' Estimated Completion Date | Market |
|---|---|---|---|---|
| TCPL Keystone Pipeline | Certificate approved Nov 2007 | 69 000 (435) | Q4 2009 | Southern PADD II and PADD III |
| Enbridge Clipper | Certificate approved May 2008 | 71 500 (450) | Q2 2010 | PADD II |
| TCPL Keystone Cushing Expansion | Approved July 2008 | 24 800 (155) | Q4 2010 | Cushing, Oklahoma |
| TCPL Keystone XL | Filed February 2009 | 111 300 (700) | Q4 2012 | U.S. Gulf Coast (PADD III) |
2.4.2 Natural Gas Pipelines
While 2008 saw continuing declines in Canadian conventional natural gas supplies, the magnitude of U.S. natural gas production growth was unexpected, particularly from unconventional sources including shale gas. Consequently, increasing attention is being focused on large potential shale gas resources in several areas of Canada, including Quebec, Alberta and B.C. While positive exploration results were seen in all of these areas, only the Montney Formation of British Columbia has been producing significant amounts of shale gas.
As a result of the success of shale gas exploration and production, the Board has received recent applications for new pipelines seeking to gather natural gas from producing and prospective Montney areas of British Columbia, as well as from other gas producing formations nearby. These pipelines would connect with existing pipeline infrastructure in Alberta. Hearings for the Spectra Energy Transmission South Peace Pipeline and the SemCAMS Redwillow ULC Redwillow Pipeline took place in 2008. The Board approved the South Peace Pipeline in November 2008 and the Redwillow Pipeline in March 2009.
On the east coast of Canada, EnCana Corporation began preparations for the Deep Panuke pipeline project that will bring gas from offshore Nova Scotia to Goldboro, Nova Scotia. In New Brunswick, construction of the Emera Brunswick Pipeline, designed to connect the Canaport LNG terminal to the M&NP Mainline, was completed and became available for service in January 2009. Right-of-way clean up and restoration activities will take place during the summer of 2009.
In February 2009, the Board approved TransCanada's 2008 application for federal regulation of its Alberta System (NGTL). Previously, NGTL was provincially regulated by the Alberta Utilities Commission in conjunction with the Energy Resources Conservation Board. Following GiC approval of the certificate, the Board assumed jurisdiction over the 23 000 km pipeline network on 29 April 2009.
Table 2.4 summarizes recently approved and currently applied for (at the time of writing, May 2009) NEB-regulated natural gas pipeline projects.
Table 2.4 - Canadian Natural Gas Pipeline Projects
| Pipeline | Location | Capacity Increase million m³/d (Bcf/d) | Proponents' Estimated Completion Date | Markets Impacted |
|---|---|---|---|---|
| TransCanada Pipelines Limited (TransCanada) and TransCanada Keystone GP Ltd. (Keystone) | Saskatchewan, Manitoba | -14.16 (-0.5) |
2009/10 | Transfer and conversion of gas pipeline assets to oil transportation service |
| Emera Brunswick Pipeline | New Brunswick | 24.08 (0.85) |
2009 | Atlantic Canada, Northeastern U.S. |
| EnCana - Deep Panuke Pipeline | Nova Scotia | 8.5 (0.3) |
2010 | Atlantic Canada, Northeastern U.S. |
| SemCAMS Redwillow ULC - Redwillow Pipeline | British Columbia, Alberta | 1.98 (0.07) |
Late 2009 | western Canada |
| Spectra Energy Transmission (Westcoast) - South Peace Pipeline Project. | British Columbia | 6.23 (0.22) |
2009 | western Canada |
| TransCanada Pipelines Limited (TransCanada) - Groundbirch Pipeline | British Columbia | 46.91 (1.656) |
Late 2010 | central Canada |
| Dawn Gateway LP - Dawn Gateway pipeline | Ontario | 11.33 initial (0.4) | Late 2010 | western Canada |
Liquefied Natural Gas (LNG)
The Board has recently published an Energy Market Assessment on the dynamics of global natural gas and LNG markets, the likelihood and availability of future LNG imports to North America and the potential implications for Canadian natural gas markets and LNG development.[7] The report suggests that although current North American regasification capacity significantly exceeds historical import levels, growth in LNG imports may provide a supply alternative, particularly in regions with limited pipeline or production capacity.
[7] NEB,Liquefied Natural Gas: A Canadian Perspective - Energy Market Assessment, February 2009.
2.5 Chapter Summary
A well functioning pipeline transportation system has adequate pipeline capacity in place to move products to consumers who need them. The material discussed in this chapter indicates that, overall, adequate capacity did exist on major NEB-regulated pipelines in 2008.
Oil Pipelines
While capacity utilization indicators show there was some spare capacity on selected oil and petroleum products pipelines in 2008, periods of apportionment on certain systems indicate that overall capacity remained tight. In 2008 and the first quarter 2009, both Trans Mountain and Enbridge added additional pipeline capacity, thereby easing the capacity strain that had been in place for several years. Export prices for Canadian light and heavy crude oil in 2008 tracked domestic posted prices closely indicating that, although pipeline capacity was tight and at times some systems were under apportionment, adequate capacity did exist overall.
The current global economic downturn has led to the delay of many oil sands projects and, correspondingly, expectations of slower oil production growth. Oil sands production, however, continues to grow with ongoing investment. To address the need for increased capacity and greater flexibility, a number of pipeline applications were filed and approved by the Board in 2007 and 2008; that infrastructure is now being built and will add capacity as early as the fourth quarter of 2009.
Natural Gas Pipelines
Overall, the comparison of price differentials and natural gas firm service tolls and throughput versus capacity on NEB-regulated natural gas pipelines shows that pipeline capacity is adequate across the country, although there may be occasions of short-term limitation at some points depending upon markets, storage and seasonal shifts. The demand for natural gas varies seasonally and, as a result, the flow of natural gas and utilization of some Canadian pipelines can be variable. Where available, the use of storage helps to stabilize flows and allows pipeline capacity to be used more efficiently.
Pipeline utilization declined for most natural gas pipelines in 2008. Declining conventional supply from the WCSB, growing demand within western Canada, and competition from other supply basins, particularly in the western and southern U.S., resulted in reduced flows on pipelines transporting gas from western Canada. Changing supply and demand dynamics may have important implications for both new and existing pipeline systems, including possibly challenging transitions with respect to utilization and tolls.
In comparison to previous years, 2008 showed fewer applications for new NEB-regulated natural gas pipelines. Recent applications in western Canada sought to connect new unconventional production in northeast BC to markets via connections to existing pipelines. Other applications sought to enhance delivery of North American gas to markets in central Canada.
3. Pipeline Tolls and Shipper Satisfaction
The Board utilizes a number of indicators to assess whether pipeline companies are providing services that meet the needs of shippers at stable and reasonable prices (tolls). This includes monitoring the stability of pipeline tolls as indicated by year-to-year variations in the benchmark toll for each of the major NEB-regulated pipelines, direct shipper feedback received through response to the NEB's annual survey on pipeline services, and via formal complaints and informal discussions with shippers and stakeholders.
3.1 Negotiated Settlements
The Board's current Guidelines for Negotiated Settlements were issued in June 2002, when they were updated to provide flexibility to address contested settlements.
All of the major pipelines regulated by the Board were operating under negotiated settlements during 2008, with the exception of TQM, which filed a partial settlement for the years 2007 to 2009. The settlement excluded cost of capital items (Figure 3.1). The Board held a public hearing in the fall of 2008 to deal with TQM's application for approval of the cost of capital that it would utilize in the calculation of final tolls for services provided in 2007 and 2008. The Board released its decision on TQM's application on 19 March 2009, wherein it agreed to vary from its previous methodology with respect to TQM's 2007 and 2008 tolls.
Figure 3.1 - Negotiated Settlements Timeline
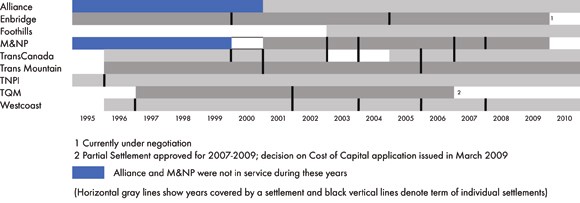
In August 2008, Westcoast filed a three-year toll settlement for 2008 to 2010 for services on its mainline transmission system. In March 2009, M&NP and its stakeholders successfully negotiated a one-year toll settlement for 2009.
In 2008, the Board dealt with a few toll-related matters that could not be resolved through negotiated settlements. These included TQM's cost of capital application mentioned above, an application by Enbridge to set tolls on its Line 9, an application by Trans Mountain related to the disposition of the Westridge Dock premium and a further application by Trans Mountain concerning the rules and regulations governing capacity allocation and apportionment on its system.
3.2 Pipeline Tolls Index
Stable and reasonable tolls are a key concern for shippers and therefore one of a number of indicators of the hydrocarbon transportation system's efficiency. The Board tracks year-to-year variations in the benchmark tolls for each pipeline it regulates as they may vary for various reasons under cost of service regulation. For example, a significant expenditure to modify or expand a system to meet shipper's needs could increase or decrease toll levels depending on the specific circumstances. Falling throughput or contract demand leading to lower capacity utilization could lead to a significant toll increase. The following section reviews variations and trends of some NEB-regulated pipelines since 2001.
3.2.1 Oil Pipeline Tolls
The benchmark tolls for Enbridge, Trans Mountain, TNPI, Express, and the gross domestic product (GDP) deflator[8], all normalized to 2001[9], are shown in Figure 3.2.[10]
[8] The implicit GDP deflator for 2008 is an estimate using actual data for the first half of the year and data estimated by Informetrica for the second half of the year.
[9] Differing pipeline distances add to the challenges in comparing tolls between individual pipelines. Some normalization is required. Here the tolls are normalized only with respect to their own changes over time. The year of normalization is arbitrary; 2001 was selected as some tolls are only available for more recent years.
[10] The benchmark tolls are: Enbridge Edmonton to the International Border near Chippewa; TMI Edmonton to Burnaby; TNPI Oakville to Montreal; and Express 15-year.
Figure 3.2 - NEB-Regulated Oil Pipeline Benchmark Tolls
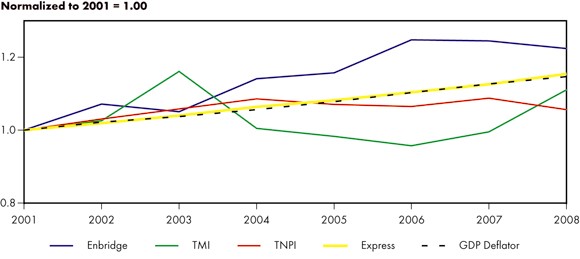
* Enbridge Toll does not include terminal and tankage fees.
The Enbridge benchmark tolls have risen overall during the period, growing at a faster pace than the GDP deflator between 2002 and 2006. The tolls increased most in 2004 and 2006. Tolls in 2008 are slightly lower than those in 2007. This decrease is primarily due to a reduction in the revenue requirement caused by prior year adjustments, which are partially offset by costs associated with the Southern Access Expansion.
Trans Mountain's benchmark toll rose in 2002 and 2003 then declined until experiencing an increase in 2007 and 2008. The 2008 tolls increased an average of 10 per cent over the 2007 tolls largely because the costs for the Pump Station Expansion and Anchor Loop Expansion were included in the 2008 revenue requirement. Express's benchmark tolls move roughly in line with the GDP deflator from 2001 to 2008.
3.2.2 Natural Gas Pipeline Tolls
In Figure 3.3, the benchmark tolls are shown for TransCanada's Mainline, Westcoast, Foothills (Sask. Zone 9), the Foothills B.C. System Zone 8, TQM, M&NP, Alliance, and the GDP deflator, normalized to the year 2001.
Figure 3.3 - NEB-Regulated Natural Gas Pipeline Benchmark Tolls
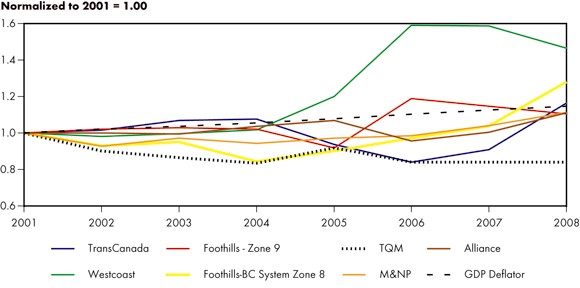
TransCanada's benchmark toll tracked the GDP deflator fairly closely from 2001 to 2004. However, in 2005 and 2006 the toll fell, primarily due to increased contract demand. The significant increase in TransCanada's 2008 toll was due to an increase in operating costs combined with a decrease in volumes, which was partly due to decontracting.
Westcoast's tolls increased modestly until 2004 then increased by over 18 per cent due to decontracting of firm service. Reductions in volume in 2006 caused a further 32 per cent increase in that year's tolls. In 2007, tolls held steady at near 2006 values and in 2008, tolls decreased over eight per cent as contract demand increased.
The Foothills Zone 9 benchmark toll increased in 2006 because of lower volumes and the end of a ten-year period for deferred tax payback in 2005. The 2007 and 2008 tolls have decreased. The Foothills B.C. System[11] benchmark toll increased 19 per cent in 2008. This was due to a decrease in demand with contract volumes decreasing eight per cent and a clearing of a deferral account from a previous year. M&NP's benchmark toll also increased slightly in 2008 due to a reduction in demand determinates which are measures of contract demand on the system taking into account volume and distance. The benchmark toll for Alliance increased nearly 10 per cent over the 2007 toll. This increase was due to compressor overhaul expenditures and information systems equipment, maintenance and upgrades.
[11] Foothills B.C. System was amalgamated into Foothills South B.C. (Zone 8) effective 1 April 2007.
In the recent decision RH-1-2008, TQM has been directed to file for final tolls for 2007 and 2008.
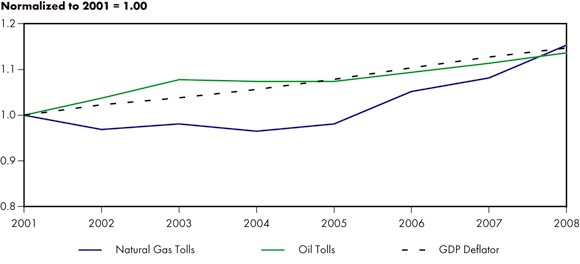
3.2.3 Comparison of Natural Gas and Oil Pipeline Tolls
Figure 3.4 shows the simple averages of the natural gas and oil benchmark pipeline tolls indices (reported in Figure 3.2 and Figure 3.3) with the GDP deflator.[12] From 2001 to 2007, oil pipeline tolls increased on average more than gas pipeline tolls, with the net increase over this period matching the GDP deflator. In 2008, gas pipeline tolls on average increased more than oil pipeline tolls.
[12] These simple averages are for those pipelines where data was available in each year with no adjustments made for the relative volume, capacity or length of the individual pipelines.
Figure 3.4 - Oil and Natural Gas Pipeline Benchmark Tolls
3.3 Shipper Satisfaction
3.3.1 NEB Pipelines Services Survey
The Board conducted its fifth annual Pipeline Services Survey in early 2009 to obtain direct feedback from the shippers of major NEB-regulated pipeline and midstream companies on the quality of service provided by those pipelines. The Board also uses this survey to obtain feedback from shippers on the Board's regulatory performance with respect to tolls and tariffs.
For each survey received, shippers complete one response which reflects their company's corporate views on the services provided by the pipeline and midstream company being surveyed and on the services provided by the Board. The overall response rate for the survey was 38 per cent, an eight percentage point increase over last year. The number of surveys sent out this year was 421, down 52 from last year.
After analyzing the survey responses, the Board publishes a summary of the aggregate results on its website. It includes the industry average and distribution of responses for each question and a summary of major themes. In addition, the Board provides each company and its shippers with detailed company-specific results including the average rating and distribution of responses for each question as well as the verbatim comments received from shippers, with the names of the respondents excluded.
As in previous years, the Board conducted the survey through its web-based survey tool. There were no new questions added, however, because this is the fifth year the survey has been conducted, the Board chose to provide a comparison of the five-year aggregated results in this report.
Appendix 2 provides the aggregate scores on all survey questions. See the complete report on aggregate results.
Pipeline Services
Figure 3.5 shows the aggregate results for the survey question that asked shippers to rate their satisfaction with the overall quality of service provided by their pipeline/midstream companies. This year, the industry average score of 3.67 is higher than the score of 3.40 in last year's survey (1 indicates "very dissatisfied" and 5 indicates "very satisfied"). Approximately 70 per cent of respondents gave their company a rating of satisfied or very satisfied on overall quality of service, compared to 60 per cent last year. Based on these results, the Board is able to conclude that shippers still appear reasonably satisfied with the services provided by pipeline/midstream companies.
Figure 3.5 - Shipper Satisfaction on Pipeline Quality of Service
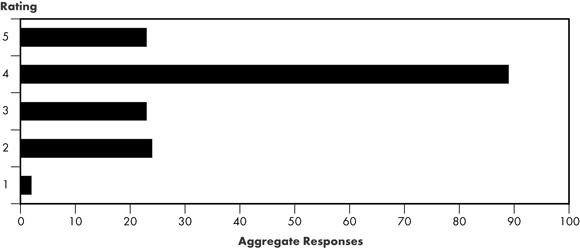
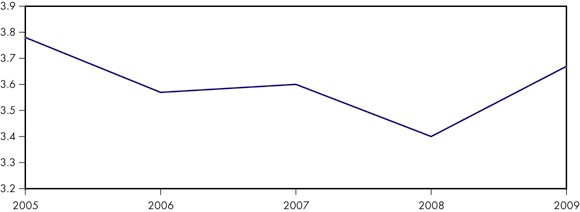
Figure 3.6 shows the five-year comparison for the survey question that asked shippers to rate their satisfaction with overall quality of service provided by their pipeline/midstream company. The Board is able to conclude, based on the five-year comparison, that satisfaction in the overall quality of service has improved over the prior three years, but is not quite attaining the level seen in 2005.
Figure 3.6 - Five-Year Comparison of the Overall Quality of Service
The three areas with the highest scores in this year's survey are:
- physical reliability of pipeline operations;
- timeliness and accuracy of invoices and statements; and
- the timeliness and usefulness of commercial information.
The three areas with the lowest scores in this year's survey are:
- demonstrating an attitude of continuous improvement and innovation;
- accessibility and responsiveness to shippers issues and requests; and
- the level of tolls in relation to transportation and midstream services received.
Feedback on the Board
The 2009 survey indicated that shipper satisfaction with the Board has decreased slightly compared to last year. Approximately 65 per cent of shippers are either satisfied or very satisfied with the Board's performance in creating an appropriate regulatory framework in which negotiated settlements for tolls and tarriffs can be reached. Approximately 55 per cent of shippers are either satisfied or very satisfied with the Board's processes to resolve disputes. Both of these results are slightly lower than in the 2008 survey. Shippers indicated that the Board could improve by striving to be more collaborative with its stakeholders and more diligent about ensuring all shippers are adequately consulted in tolling matters. The Board will consider this feedback as part of its ongoing continual improvement efforts.
The Board notes that a majority of shippers are satisfied with the public information provided by the NEB on energy markets.
3.3.2 Formal Complaints
If shippers are unable to resolve concerns with a pipeline on specific toll and tariff matters, they can file a formal complaint with the Board. Depending on the nature of the complaint, the Board may decide to deal with it through a formal complaint process before the Board, an appropriate dispute resolution process or, in some cases, the parties may be able to negotiate a solution to the concern on their own. There were two formal shipper complaints during the past year involving the Board.
IBERDROLA Canada Energy Services Ltd. (ICES)
In October 2007, Alliance filed an application with the Board for tolls effective 1 January 2008. In December 2007, ICES filed an objection to Alliance's proposed 2008 tolls stating Alliance failed to demonstrate that some or all of the additional costs that it proposed to recover through its 2008 tolls were reasonable and prudent and, therefore, the proposed tolls were not just and reasonable.
In April 2008, the Board established a written process, which was limited to the consideration of ICES's five objections, and allowed for the filing of information requests and written argument. In September 2008, the Board, based on the evidence, dismissed the objection of ICES and approved Alliance's proposed tolls effective 1 January 2008.
ExxonMobil Canada Energy (EMCE)
In January 2008, EMCE filed a complaint and application in respect of the tolls to be charged by Westcoast for gathering and processing services in Zones 1 and 2. As tolls for these services are negotiated under the Framework for Light-handed Regulation and are confidential, EMCE also applied for an order directing confidentiality of the information filed with the Board. While the matter was before the Board, EMCE and Westcoast continued to negotiate in order to reach a settlement. In October 2008, EMCE advised the Board that negotiations had resulted in resolution of the dispute between the parties.
3.3.3 Service Enhancements
As part of its negotiated settlement for 2008 to 2010, Westcoast and its stakeholders agreed to negotiate the terms of a Customer Service Incentive Program for transmission services provided by Westcoast in Zones 3 and 4. The purpose of the program is to improve the overall quality of Westcoast's customer service by creating positive and negative financial incentives for Westcoast tied to agreed-upon performance measures, including a customer survey.
Also included in Westcoast's settlement were three initiatives to enhance service. These initiatives were: (1) to investigate the scope and requirements necessary for Westcoast to introduce enhancements to its nominations cycle; (2) to reconcile and possibly adjust the current level of contractible capacity in Zones 3 and 4 on a segment-by-segment basis; and (3) to work with its Toll and Tariff Task Force to implement a proposal regarding summer reliability targets.
3.4 Chapter Summary
The following observations are made in this chapter:
- Pipeline companies and shippers were able to resolve the vast majority of their toll and tariff issues through the negotiated settlement process.
- The Board dealt with a few contentious toll and tariff applications that could not be resolved through negotiated settlements.
- Overall, pipeline tolls in 2008 increased over the previous year with gas pipeline tolls increasing on average more than oil pipeline tolls.
- Shippers indicated an increased level of satisfaction with the services provided by their pipeline/midstream companies in 2008.
- The five-year comparison of Overall Quality of Service indicates that, while shipper satisfaction with pipeline services had declined slightly over the three previous years, it did improve in the last year.
- There were two formal shipper complaints last year involving the Board.
Based on these observations, the Board concludes that pipeline/midstream companies are providing services that meet the needs of shippers at reasonable tolls. The increase in the 2009 survey scores does indicate that pipeline/midstream companies have improved their level of service to shippers in the last year. Shippers are also reasonably satisfied with the Board's role in the regulation of tolls and tariffs. Nevertheless, the Board continually seeks to improve its processes.
4. Pipeline Financial Integrity
This chapter reviews the financial soundness of NEB regulated pipeline companies and reports on a number of relevant factors.
4.1 Common Equity
A common equity ratio is defined as the percentage of common equity in a company's capital structure. The market sees this ratio as related to a company's financial risk, which is the risk associated with a company's use of debt. Higher common equity ratios increase the likelihood of a company being able to meet its financial obligations, including debt service.
Deemed Common Equity Ratios
When the Board approves a Group 1 pipeline company's tolls for a specified time period, it typically has also approved a return on equity (ROE) and a common equity ratio for the regulated entity. Since parent companies often have a variety of business lines consolidated into one capital structure, an appropriate common equity ratio has previously been determined or deemed for the NEB-regulated assets.[13] Alternatively, some Group 1 pipeline companies may successfully negotiate a comprehensive tolls settlement with their shippers that includes capital structure and return on equity. In these instances, the Board still considers the overall settlement for approval.
[13] A deemed common equity ratio is a notional capital structure used for rate-making purposes that may differ from a company's actual capital structure.
Table 4.1 shows the deemed common equity ratio for some NEB Group 1 pipeline companies. The deemed common equity ratios for TransCanada Mainline and Westcoast Transmission increased between 2006 and 2007 while M&NP's ratio increased in 2007 and 2008. M&NP's 2009 deemed equity ratio was not specified in its 2009 toll settlement. The market considers increases to be credit positive, lowering the financial risk of the pipeline companies.
Table 4.1 - Deemed Common Equity Ratios
| 2006 | 2007 | 2008 | 2009 | |
|---|---|---|---|---|
| Alliance | 30 | 30 | 30 | 30 |
| Foothills | 36 | 36 | 36 | 36 |
| Foothills BC System Zone 8 | 36 | 36 | 36 | 36 |
| M&NP | 25 | 29.27 | 31.18 | * |
| TQM | 30 | ** | ** | *** |
| TransCanada Mainline | 36 | 40 | 40 | 40 |
| Westcoast Transmission | 35 | 36 | 36 | 36 |
* Not specified.
** Refer to RH-1-2008.
*** TQM has indicated it intends to resolve in negotiation or, if unable to negotiate, will file an application with the Board.
Return on Common Equity
For NEB-regulated pipeline companies the ROE is approved by the Board and determined through either adjudication or negotiation.
The Board establishes an approved-ROE annually, using a formula outlined in the Reasons for Decision for hearing RH-2-94. It is applicable to all regulated pipelines except for those with alternative rates approved by the Board. Achieved ROEs may vary from NEB-approved levels for various reasons such as throughput changes, incentives, profit-sharing mechanisms and cost variances.
Table 4.2 shows the achieved ROE for several NEB-regulated pipeline companies from 2004 to 2008 as well as the ROE approved by the NEB in accordance with the RH-2-94 Formula.[14] Achieved ROEs from Enbridge, Trans Mountain and Trans-Northern are not included in Table 4.2 as those companies are not required to submit Financial Surveillance Reports to the NEB, as per their negotiated settlements. Alliance and M&NP, which are included but not subject to the RH-2-94 Formula, have negotiated ROEs with their shippers.[15] Westcoast's Field Services Division, also not subject to the ROE Formula, is financially regulated on a complaint basis as described in the Framework for Light-handed Regulation (RHW-1-98). Its tolls for gathering and processing services are negotiated individually with shippers. TransCanada uses the RH-2-94 Formula as a basis for their negotiated settlements that also include some incentives, resulting in some variation from the Formula rate.
[14] The formula used to determine the ROE for certain NEB-regulated pipelines, established in the RH-2-94 Proceeding, and later amended to eliminate rounding.
[15] The Board subsequently approved these settlements. M&NP had a base return on equity of 11.66 per cent for 2008; 12 per cent for 2007; and up to and including 2006, its base rate was 13 per cent with incentive potential.
The RH-2-94 Formula produced an ROE of 8.71 per cent for 2008 and 8.57 per cent for 2009. Settlements using the RH-2-94 Formula as the allowed ROE have varying degrees of incentives and risks that cause pipelines' return to differ from the Formula ROE. As a result of the various incentives, most Group 1 pipelines have achieved actual ROEs that are greater than their allowed ROEs.
In the case of Alliance, the ROE had been fixed for an extended period. Initially it was set at 11.25 per cent, as shown in Table 4.2 for 2004 to 2006. For the years 2007 and 2008, it increased to 11.26 per cent. This change in ROE was the result of a decrease in final construction costs. The achieved ROE for M&NP has fluctuated over the past five years, first increasing each year from 2004 to 2006, then decreasing from 2006 to 2008.
Table 4.2 - Achieved ROEs and the RH-2-94 Formula ROE
| 2004 | 2005 | 2006 | 2007 | 2008 | |
|---|---|---|---|---|---|
| Transmission | |||||
| Alliance | 11.25 | 11.25 | 11.25 | 11.26 | 11.26 |
| Foothills* | 9.56 | 9.56 | 9.30 | 8.67 | 8.71 |
| Foothills BC System Zone 8 | 8.51 | 9.46 | 8.47 | 8.37 | 8.71 |
| M&NP | 13.75 | 14.31 | 14.68 | 12.15 | 11.35 |
| TQM** | 9.84 | 9.92 | 8.99 | *** | *** |
| TransCanada Mainline | 10.18 | 9.66 | 8.92 | 9.13 | 9.91 |
| Westcoast Transmission*** | 10.28 | 10.82 | 9.16 | 8.35 | 8.76 |
| RH-2-94 Formula | 9.56 | 9.46 | 8.88 | 8.46 | 8.71 |
| Midstream | |||||
| Westcoast Field Services*** | 11.63 | 12.48 | 10.46 | 7.28 | 7.61 |
* As of 2005, Foothill's achieved ROE equals the NEB's approved ROE supplemented by the Incentive Return and Other (IRO)
** In RH-1-2008, the NEB granted TQM's request to vary from the RH-2-94 Formula for TQM's Total Return on Capital for 2007 and 2008
*** Excluding construction in progress (CWIP) and, in the case of Transmission, deferrals
Source: NEB Surveillance and Annual Reports
Figure 4.1 shows the difference between achieved ROEs and NEB-approved ROEs for TransCanada Mainline, TQM,[16] the Westcoast Transmission System, M&NP, Foothills, Foothills BC System Zone 8 and Alliance.[17] From 2004 to 2008, these pipeline companies have met or exceeded their NEB-approved ROEs 80 per cent of the time. In many cases, pipeline companies have met or outperformed their approved levels through cost reductions, incentives and profit sharing mechanisms.
[16] 2004-2006.
[17] Foothills and Alliance's achieved ROEs are equal to their approved ROEs by their settlement.
Figure 4.1 - Variance from NEB-Approved ROE - 2003 to 2007
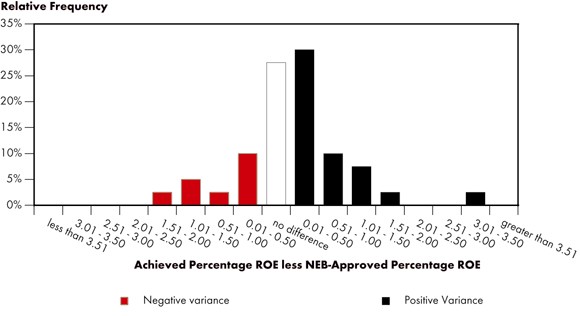
Source: NEB Surveillance Quarterly and Annual Reports. Includes TransCanada Mainline, TQM, Westcoast Transmission System, and M&NP, as well as Foothills, Foothills BC System Zone 8 and Alliance who earn precisely their allowed ROE.
4.2 Financial Ratios
Financial ratios, based on financial statement information, can be useful when describing a company's performance and financial integrity. The evaluation of financial ratios is most meaningful when the ratio of a particular company is compared with a benchmark or industry standard over time. A variety of ratios can be used to evaluate a company's liquidity, operating performance, growth potential, and risk. Care must be exercised in the collection and interpretation of these financial ratios as reported financial information may pertain to a parent company and include non-regulated assets and/or assets from different industries.
Financial risk is the risk inherent in a company's use of debt and other obligations where fixed payments are used. It differs from business risk, which is the risk attributed to the nature of a particular business activity and, for pipelines, typically includes supply, market, regulatory, competitive and operating risks. Financial risk increases as the proportion of debt increases relative to shareholders equity. An increase in debt may obligate a company to make more and larger fixed payments in the future. From a bondholder's perspective, a company with above average financial risk could have problems making interest payments. From an equity holder's perspective, a company's level of debt coverage gives some indication of the sustainability and value of the equity, and possible ability to pay dividends. A company's financial risk may be described by ratios such as interest coverage, fixed-charges coverage and cash flow-to-total debt and equivalents.
The following sections specifically outline and discuss certain ratios relating to the financial risk of certain companies with NEB-regulated pipelines.
Interest and Fixed-Charges Coverage Ratios
An interest coverage ratio describes a company's ability to make interest payments and repay its debt obligations. It is defined as earnings before interest and taxes divided by interest charges. A fixed-charges coverage ratio also describes the ability to make interest payments and repay debt obligations, as well as considering some of the other types of fixed payments a company is obligated to make. It is defined as earnings before interest, fixed charges and taxes, divided by interest and fixed charges. Higher ratios indicate a higher likelihood the company will meet its obligations and may indicate there is unused borrowing capacity.
The fixed-charges coverage ratios for some NEB-regulated pipeline companies, as calculated by the Dominion Bond Rating Service (DBRS), are shown in Figure 4.2.[18] Complete data is not available consistently for all companies: Enbridge Mainline is shown separately from the consolidated company Enbridge Inc. and the information for Trans Mountain is no longer available on a stand-alone basis, therefore its new owner, Kinder Morgan Energy Partners L.P., is shown. The average fixed-charges coverage ratio for the first six months of 2008 is 2.97, which is an 11 per cent increase from the December 31, 2007 fixed-charges coverage ratios for these companies.
[18] An annual cash flow item relative to another annual cash flow item is typically expressed as a factor of 'Times'.
Figure 4.2 - Fixed-Charges Coverage Ratios
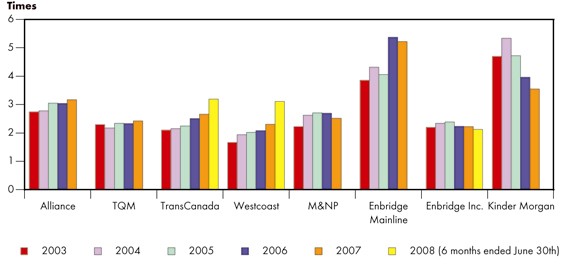
Source: DBRS (June 2008 is the most recent data available)
Cash Flow-to-Total Debt and Equivalents Ratio
The cash flow-to-total debt and equivalents ratio is another way of describing a company's ability to meet its debt obligations and fixed payments. It is defined as operating cash flow divided by total debt and debt equivalents.[19] Again, higher ratios indicate an increased likelihood of a company being able to meet its obligations and indicate that it has greater borrowing capacity.
[19] The annual cash flow over a balance sheet item is typically converted to a percentage
The cash flow-to-total debt and equivalents ratios for some NEB-regulated pipeline companies, as calculated by DBRS, are shown in Figure 4.3. As noted earlier, this ratio is not available for all pipeline units. The average cash flow-to-total debt and equivalents ratio for these companies was 17.2 per cent for the partial year ending June 2008, a six and a half per cent increase from the year ending December 31, 2007. For most companies, the trend has been increasing for cash flow-to-total debt and equivalent ratios. The data for Westcoast includes the gathering and processing income which is more volatile than the transmission income.
Figure 4.3 - Cash Flow-to-Total Debt and Equivalent Ratios
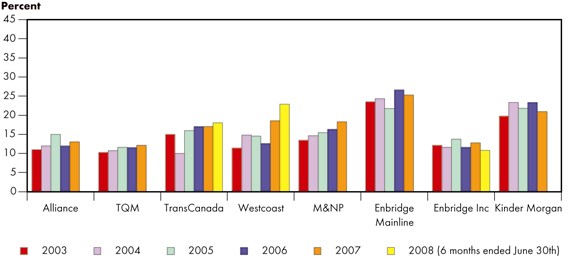
Source: DBRS
4.3 Credit Ratings
In Canada, pipeline credit ratings are determined by three independent credit rating agencies: DBRS, Standard & Poor's (S&P), and Moody's. Credit ratings provide an assessment of the probability a debt issuer will live up to its obligations and, as such, indicate the financial integrity of the rated company. A company's credit rating generally reflects the consolidated operations of the entire company, not just the regulated portion. Consequently, the credit ratings for companies such as Enbridge, TransCanada and Westcoast, which have both regulated and non-regulated operations, may be influenced by their non-regulated operations. Credit ratings are somewhat subjective in that a company's ratings are the expert opinion of the credit rating agency, which may result in different ratings by different agencies. See Appendix 3 for a comparison of the rating scales for DBRS, S&P, and Moody's.
DBRS
According to its published data, in assigning a credit rating to a particular company, DBRS attempts to consider all meaningful factors that could impact the risk of maintaining timely payments of interest and principal in the future. Key credit considerations will vary from industry to industry nevertheless, some of the common factors considered for most ratings are core profitability, asset quality, strategy and management strength, and the financial and business risk profile.
The following specific factors are also considered for pipelines when deriving their credit ratings: regulatory factors, competitive environment, supply and demand considerations, and regulated versus non-regulated activities. The credit ratings for most Group 1 pipeline companies are shown in Table 4.3 and indicate that ratings have remained stable from 2004 to the present, varying from A(low) to A(high), with no recent rating changes.
Table 4.3 - DBRS Credit Rating History
| Pipeline | 2004 | 2005 | 2006 | 2007 | 2008 | Current |
|---|---|---|---|---|---|---|
| Alliance | A (low) | A (low) | A (low) | A (low) | A (low) | A (low)/Stable |
| Enbridge Pipelines | A (high) | A (high) | A (high) | A (high) | A (high)/neg | A (high)/neg |
| Expressa | A (low) | A (low) | A (low) | A (low) | A (low) | A (low)/Stable |
| M&NP | A | A | A | A | A | A/Stable |
| TQM | A (low) | A (low) | A (low) | A (low) | A (low) | A (low)/Stable |
| TransCanada | A | A | A | A | A | A/Stable |
| Trans Mountain | A (low) | A (low) | repaid | repaid | repaid | repaid |
| Trans-Northern | NR | A(low) | A(low) | A (low) | A (low) | A (low)/Stable |
| Westcoastb | A (low) | A (low) | A (low) | A (low) | A (low) | A (low)/Stable |
a) Senior secured
b) Unsecured debentures
NR Not rated
Standard & Poor's
According to its published data, S&P indicates that its credit rating reflects a borrower's capacity and willingness to meet its financial commitments on a timely basis. S&P bases its ratings on the overall creditworthiness of a consolidated company. Therefore, the rating of a wholly-owned subsidiary, in the absence of meaningful ring-fencing measures, generally reflects the creditworthiness of the parent.
In S&P's rating methodology, a company rated 'A' has strong capacity to meet its financial commitments but is somewhat more susceptible to the adverse effects of changes in circumstances and economic conditions than companies in higher-rated categories, such as 'AA' or 'AAA'. Companies rated 'BBB' have adequate capacity to meet their financial commitments. However, adverse economic conditions or changing circumstances are more likely to lead to a weakened capacity of the company to meet its financial commitments.
S&P credit ratings for several Group 1 pipeline companies are shown in Table 4.4. The table illustrates ratings have remained stable from 2004 to the present, varying from 'BBB+' to 'A-'.
Table 4.4 - S&P Credit Rating History
| Pipeline | 2004 | 2005 | 2006 | 2007 | 2008 | Current |
|---|---|---|---|---|---|---|
| Enbridge Pipelines | A-/Stable | A-/Stable | A-/Stable | A-/Stable | A-/Stable | A-/Stable |
| M&NPa | A /Stable | A /Stable | A /Stable | A /Stable | A /Stable | A /Stable |
| TQM | BBB+/Stable | BBB+/Stable | BBB+/Stable | BBB+/Stable | BBB+/Stable | BBB+/Stable |
| TransCanada | A-/Watch Neg | A-/Neg | A-/Neg | A-/Stable | A-/Stable | A-/Stable |
| Trans Mountain | BBB/Stable | BBB/Stable | debt repaid | debt repaid | debt repaid | debt repaid |
| Westcoastb | BBB+/Stable | BBB/Watch Neg | BBB/Stable | BBB+/Stable | BBB+/Stable | BBB+/Stable |
a) Senior secured
b) Unsecured debentures
Moody's
According to its published data, Moody's indicates that its credit analysis focuses on the fundamental factors and key business drivers relevant to an issuer's long-term and short-term risk profile. The foundation of Moody's methodology rests on two basic considerations:
- the risk to the debt holder of not receiving timely payment of principal and interest on the specific debt security; and
- a comparison of the level of risk with that of all other debt securities.
Like S&P, Moody's focuses its ratings on the overall creditworthiness of the consolidated entity. In so doing, Moody's measures the ability of an issuer to generate cash in the future, thus its primary focus is on the predictability of future cash generation. This determination is built on an analysis of the individual issuer and of its strengths and weaknesses compared to those of its peers worldwide. An examination of factors external to the issuer is also conducted, including industry or country-level trends that could impact the entity's ability to meet its debt obligations. Of particular concern is the ability of management to sustain cash generation in the face of adverse changes in the business environment.
The rating histories for several Group 1 pipeline companies are provided in Table 4.5. All of Moody's ratings place these pipelines in the investment grade category and range from 'medium grade' to 'upper-medium grade'.
Table 4.5 - Moody's Credit Rating History
| Pipeline | 2004 | 2005 | 2006 | 2007 | 2008 | Current |
|---|---|---|---|---|---|---|
| Alliancea | A3 | A3 | A3 | A3 | A3 | A3 |
| Enbridge Inc. | A3 | A3 | A3 | A3 | Baa1 | Baa1 |
| Expressb | Baa1 | Baa1 | Baa1 | Baa1 | Baa1 | Baa1 |
| M&NPb | A1 | A1 | A2 | A2 | A2 | A2 |
| TransCanadaa | A2 | A2 | A2 | A2 | A2 | A2 |
a) Unsecured debentures
b) Senior secured
In June 2008, Moody's downgraded the ratings of TransCanada's unsecured debentures from A2 to A3. According to TransCanada's Quarterly Report to Shareholders - Second Quarter, 2008, the downgrade occurred after its announcement to acquire Ravenswood. Moody's undertook a review of TransCanada and its subsidiaries and subsequently assigned it the lower rating; however, it also assigned it a stable outlook.
4.4 Chapter Summary
The pipeline sector in 2008 was financially sound. Credit ratings continued to be investment grade and key financial ratios remained stable.
The following observations are made in this chapter:
- Fixed-charges and cash flow-to-total debt and equivalents coverage ratios have remained stable.
- Deemed common equity ratios have, for the most part, remained stable since 2006.
- Achieved ROEs have, in most cases, been greater than their NEB-approved levels.
- Credit ratings continue to be investment grade.
5. Conclusions
Based on this review of 2008, the Board believes that, overall, the Canadian pipeline transportation system continues to work effectively.
The Board recognizes that this report represents only a snapshot in time and does not include a comparison with or to pipeline transportation systems in other jurisdictions. As part of its mandate, the Board will continue to monitor the effectiveness of the transportation system and will continue to meet with parties to gain an understanding of all perspectives on this issue. The Board welcomes feedback on the measures and conclusions in this report and suggestions for improvements to future reports.
The Board thanks those companies and organizations that directly or indirectly provided the information found in this report, including those that actively participated in the Pipeline Services Survey.
Appendix 1 - Group 1 and Group 2 Pipeline Companies
Regulated by the NEB as of 31 December 2008
Group 1 Oil and Products
Kinder Morgan Cochin Pipe ULC
Enbridge Pipelines Inc.
Enbridge Pipelines (NW) Inc.
Trans Mountain Pipeline Inc.
Trans-Northern Pipelines Inc
Group 1 Natural Gas
Alliance Pipeline Ltd.
Foothills Pipe Lines Ltd.
Gazoduc Trans Québec & Maritimes Inc.
Maritimes & Northeast Pipeline Management Ltd.
TransCanada PipeLines Limited
TransCanada PipeLines Limited, B.C. System
Westcoast Energy Inc.
Group 2 Oil and Products
Amoco Canada Petroleum Company Ltd.
Aurora Pipe Line Company
Berens Energy Ltd.
BP Canada Energy Company
Dome Kerrobert Pipeline Ltd.
Dome NGL Pipeline Ltd.
Enbridge Pipelines (Westspur) Inc.
Ethane Shippers Joint Venture
Express Pipeline Limited Partnership
Genesis Pipeline Canada Ltd.
Glencoe Resources Ltd.
Husky Oil Limited
Imperial Oil Resources Limited
ISH Energy Ltd.
Kaiser Exploration Ltd.
Montreal Pipe Line Limited
|
Murphy Oil Company Ltd
NOVA Chemicals (Canada) Ltd.
PanCanadian Kerrobert Pipeline Ltd.
Paramount Transmission Ltd.
Penn West Petroleum Ltd.
Plains Marketing Canada, L.P.
PMC (Nova Scotia) Company
Pouce Coupé Pipe Line Ltd.
as agent and general partner
of the Pembina North Limited Partnership Provident Energy Pipeline Inc.
Renaissance Energy Ltd.
SCL Pipeline Inc.
Shell Canada Products Limited
Spectra Energy Empress L.P.
Sun-Canadian Pipe Line Company
Taurus Exploration Canada Ltd
Yukon Pipelines Limited
1057533 Alberta Ltd.
Group 2 Natural Gas
AltaGas Pipeline Partnership
Apache Canada Ltd.
ARC Resources Ltd.
Bear Paw Processing Company (Canada) Ltd.
BP Canada Energy Company
Burlington Resources Canada (Hunter) Ltd.
Canada Border Services Agency
Canadian-Montana Pipe Line Corporation
Canadian Natural Resources Limited
Centra Transmission Holdings Inc.
Champion Pipeline Corporation Limited
Chief Mountain Gas Co-op Ltd.
County of Vermilion River No. 24 Gas Utility
Crescent Point Resources Ltd.
Delphi Energy Corporation
Devon Canada Corporation
DR Four Beat Energy Corp.
Echoex Energy Inc.
EnCana Border Pipelines Limited
EnCana Corporation
EnCana Ekwan Pipeline Inc.
EnCana Oil & Gas Co. Ltd.
EnCana Oil & Gas Partnership
Enermark Inc.
ExxonMobil Canada Properties
Fletcher Challenge Petroleum Inc.
Forty Mile Gas Co-op Ltd.
Huntingdon International Pipeline Corporation
Husky Oil Operations Ltd.
Kaiser Exploration Ltd.
KEYERA Energy Ltd.
Many Islands Pipe Lines (Canada) Limited
Marauder Resources West Coast Inc.
Mid-Continent Pipelines Limited
Minell Pipeline Limited
Murphy Canada Exploration Company
Murphy Oil Company Ltd.
Nexen Inc.
Niagara Gas Transmission Limited
NuVista Energy Ltd.
Omimex Canada, Ltd.
Paramount Transmission Ltd.
Peace River Transmission Company Limited
Pengrowth Corporation
Penn West Petroleum Ltd.
Petrovera Resources Ltd.
Pioneer Natural Resources Canada Inc.
Portal Municipal Gas Company Canada Inc.
Profico Energy Management Ltd.
Renaissance Energy Ltd.
Shiha Energy Transmission Ltd.
Spectra Energy Midstream Canada L.P.
St. Clair Pipelines Management Inc.
Suncor Energy Inc.
Sword Energy Limited
Talisman Energy Inc.
Taurus Exploration Canada Ltd
True Energy Inc.
Union Gas Limited
Vault Energy Inc.
Vector Pipeline Limited Partnership
Wolstitmor Joint Venture
1057533 Alberta Ltd.
2193914 Canada Limited
Commodity Pipelines
Abitibi-Consolidated Company of Canada
E.B. Eddy Forest Products Ltd.
Fraser Papers Inc. (Canada)
Genesis Pipeline Canada Ltd.
Penn West Petroleum Ltd.
Souris Valley Pipeline Limited
Appendix 2 - Pipeline Services Survey Aggregate Results
Below are the aggregate responses for each question in the survey. Respondents were asked to rate their satisfaction with the services they receive on a scale of 1 to 5, where 1 indicates "Very dissatisfied" and 5 indicates "Very satisfied". See the Board's website for the complete details.
- How satisfied are you with the physical reliability of the pipeline company's operations?
Pipeline Services Survey - Question 1 1 2 3 4 5 Average 3 13 13 84 47 3.99 - How satisfied are you with the quality, flexibility and reliability of the pipeline company's transactional systems (nominations, bulletin boards, reporting, contracting, etc)?
Pipeline Services Survey - Question 2 1 2 3 4 5 Average 5 23 22 76 30 3.66 - How satisfied are you with the timeliness and accuracy of the pipeline company's invoices and statements?
Pipeline Services Survey - Question 3 1 2 3 4 5 Average 4 22 12 88 31 3.76 - How satisfied are you with the timeliness and usefulness of operations information (outages, available capacity, scheduled maintenance, flows, etc) provided by the pipeline company?
Pipeline Services Survey - Question 4 1 2 3 4 5 Average 3 29 23 81 22 3.57 - How satisfied are you with the timeliness and usefulness of commercial information (tolls, service changes, new services, contract information, etc) provided by the pipeline company?
Pipeline Services Survey - Question 5 1 2 3 4 5 Average 3 17 26 88 22 3.70 - How satisfied are you with the degree to which the pipeline company demonstrates an attitude of continuous improvement and innovation?
Pipeline Services Survey - Question 6 1 2 3 4 5 Average 12 32 44 59 14 3.19 - How satisfied are you with the accessibility and responsiveness of the pipeline company to shipper issues and requests?
Pipeline Services Survey - Question 7 1 2 3 4 5 Average 8 37 38 58 17 3.25 - How satisfied are you that the pipeline company works towards fair and reasonable solutions when resolving issues?
Pipeline Services Survey - Question 8 1 2 3 4 5 Average 9 21 36 77 17 3.45 - How satisfied are you with the suite of services offered by the pipeline company?
Pipeline Services Survey - Question 9 1 2 3 4 5 Average 4 21 47 70 15 3.45 - How satisfied are you with the level of this pipeline company's tolls in relation to the transportation services your company receives?
Pipeline Services Survey - Question 10 1 2 3 4 5 Average 7 28 46 74 5 3.26 - How satisfied are you with the collaborative processes (negotiations or task force meetings) utilized by this pipeline company?
Pipeline Services Survey - Question 11 1 2 3 4 5 Average 2 17 44 66 12 3.49 - How satisfied are you that the current negotiated settlement agreement or tariff arrangements work well to provide fair outcomes?
Pipeline Services Survey - Question 12 1 2 3 4 5 Average 7 9 51 72 8 3.44 - How satisfied are you with the OVERALL quality of service provided by the pipeline company over the last calendar year?
Pipeline Services Survey - Question 13 1 2 3 4 5 Average 2 24 23 89 23 3.67 - On an overall basis, has the pipeline company's quality of service in the last year:
Pipeline Services Survey - Question 14 Improved 25 15 Remained the Same 123 76 Decreased 14 9 Total 162 100% - What are the things that this pipeline company does well?
- What are the things that this pipeline company could do better?
- How satisfied are you that the NEB has established an appropriate regulatory framework in which negotiated settlements for tolls and tariffs can be reached?
Pipeline Services Survey - Question 17 1 2 3 4 5 Average 4 5 45 89 7 3.60 - When toll and tariff matters are not resolved through settlement, how satisfied are you with the Board's processes to resolve disputes?
Pipeline Services Survey - Question 18 1 2 3 4 5 Average 4 4 50 55 14 3.56 - What could the Board be doing to improve its processes through which tolls and tariffs are determined?
- Overall Quality of Service (Importance Rating) (see Figure 3.5).
- How satisfied are you with the public information provided by the NEB on energy markets?
Pipeline Services Survey - Question 21 1 2 3 4 5 Average 1 5 53 66 11 3.60
Appendix 3 - Debt Rating Comparison Chart
This chart provides a comparison of the rating scales used by Dominion Bond Rating Service (DBRS), Standard and Poor's (S&P), and Moody's when rating long-term debt.
Standard & Poor's provides a Rating Outlook, which assesses the potential direction of a long-term credit rating over the intermediate to longer term. A 'Positive' outlook means a rating may be raised; a 'Negative' outlook that a rating may be lowered; and a 'Stable' outlook means a rating is not likely to change.
| Credit Quality | DBRS | S&P | Moody's |
|---|---|---|---|
| Investment Grade | |||
| Superior/High grade | AAA | AAA | Aaa |
| AA (high) | AA+ | Aa1 | |
| AA | AA | Aa2 | |
| AA (low) | AA- | Aa3 | |
| Good/Upper Medium | A (high) | A+ | A1 |
| A | A | A2 | |
| A (low) | A- | A3 | |
| Adequate/Medium | BBB (high) | BBB+ | Baa1 |
| BBB | BBB | Baa2 | |
| BBB (low) | BBB- | Baa3 | |
| Non-Investment Grade | |||
| Speculative | BB (high) | BB+ | Ba1 |
| BB | BB | Ba2 | |
| BB (low) | BB- | Ba3 | |
| Highly speculative | B (high) | B+ | B1 |
| B | B | B2 | |
| B (low) | B- | B3 | |
| Very highly speculative | CCC | CCC | Caa1 |
| CC | CC | Caa2 | |
| C | C | Caa3 | |
| D | D | Ca | |
| C | |||
Note: DBRS and S&P ratings in the CCC category and lower also have subcategories "high/+" and "low/-" and the absence of "high/+" and "low/-" designation indicates the rating is in the "middle" of the category.
- Date modified: