Market Snapshot: How the 2021 Summer Heat Dome Affected Electricity Demand in Western Canada
Connect/Contact Us
Please send comments, questions, or suggestions for Market Snapshot topics to snapshots@cer-rec.gc.ca
Release date: 2021-11-17
From late June to early July 2021, a warm weather event, known as a heat dome, settled over western Canada and the northwestern United States.Footnote 1 The rise in temperatures associated with this event led to increased electricity demand in Alberta and British Columbia (B.C.), which was noticeably higher than in previous summers. This market snapshot explores the high temperatures seen during the heat dome and the effects they had on electricity demand in Alberta and B.C.
The heat dome resulted in several days of high temperatures that approached 50 degrees Celsius (°C) in Lytton, B.C., setting an all-time temperature record for Canada.Footnote 2 In other parts of B.C., temperatures peaked at 34°C in Vancouver and 40°C in Victoria on 28 June, with Kamloops reaching 47°C a day later. Albertan temperatures peaked at 34°C degrees in Edmonton and 36°C in Calgary on 30 June. These summer temperatures set all-time high records in interior B.C., Victoria, and Edmonton. Slightly hotter temperatures were recorded in Calgary in 1919 and 2018, and in Vancouver in 2009. The heat dome had less impact on temperatures in eastern Canada.
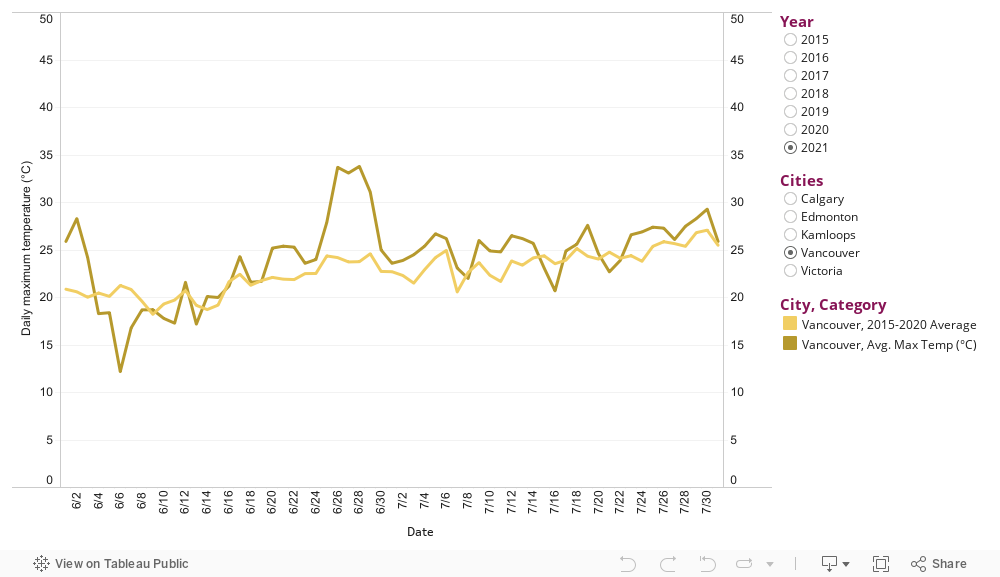
Figure 1: Maximum Daily Temperature in June and July for Select Cities in Alberta and B.C.
Source and Description
Source: Government of Canada – Past weather and climate data
Description: This line chart shows the maximum daily temperature for five cities in Alberta and B.C. in degrees Celsius for the months of June and July. The darker lines represent daily high temperatures for a particular year and the lighter lines show the 2015 to 2020 average daily high. The chart can be changed to display data from any year between 2015 and 2021. Temperatures peaked in late June through early July in the western Canadian provinces during the 2021 heat dome, with interior B.C. experiencing the highest temperatures.
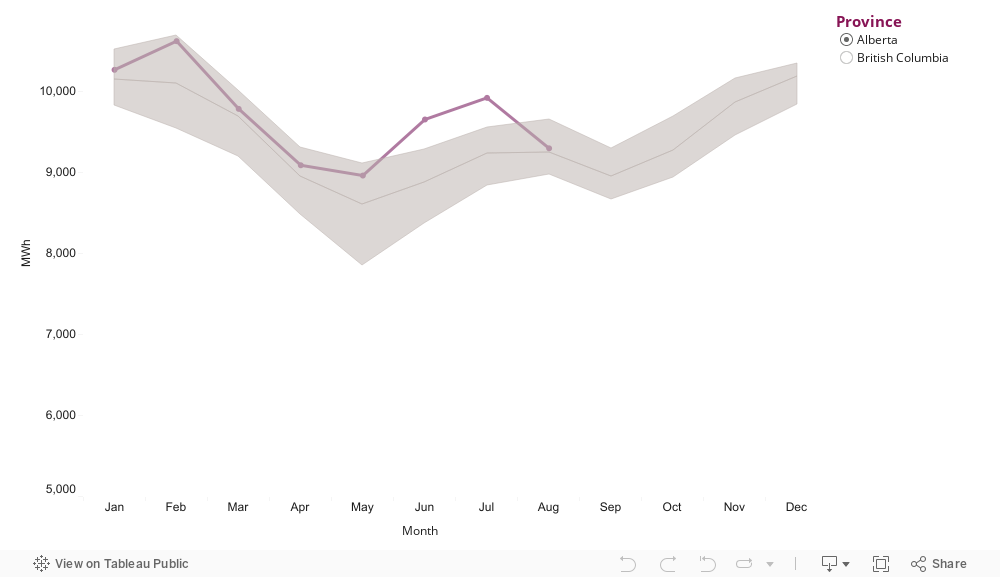
Figure 2 shows average monthly electricity use is Alberta and B.C. from 2015 to 2020, compared to 2021. During periods of high temperatures, like those that occurred during the heat dome, people are more likely to turn on air conditioning units to cool their houses and other buildings. Air conditioners are normally powered by electricity and can create noticeable increases in electricity demand when many are used at the same time. When temperatures are low in winter, people use more heating, which typically comes from either natural gas or electricity in Alberta and B.C. Cold temperatures and long nights during winter also keep people indoors where they use more electricity for lighting or entertainment like watching TV. In homes heated with natural gas, the fans used to circulate hot air produced by furnaces also consume significant amounts of electricity.Footnote 3
Figure 2: Average Monthly Electricity Demand from 2015-2020 compared to 2021 in Alberta and B.C.
Source and Description
Source: BC Hydro – Balancing Authority Load Data (B.C.), Alberta Electric System Operator – Market and system reporting (Alberta)
Description: This line chart shows the maximum daily temperature for five cities in Alberta and B.C. in degrees Celsius for the months of June and July. The darker lines represent daily high temperatures for a particular year and the lighter lines show the 2015 to 2020 average daily high. The chart can be changed to display data from any year between 2015 and 2021. Temperatures peaked in late June through early July in the western Canadian provinces during the 2021 heat dome, with interior B.C. experiencing the highest temperatures.
Both Alberta and B.C. tend to see their electricity demand peak between December and February before falling off during the spring and summer. Compared to previous summers, June and July of 2021 had significantly higher than normal average hourly electricity demands in both provinces. Average hourly demand in B.C. approached 7 000 megawatts (MW) for the two months, when in previous summers it was closer 6 500 MW per hour. In Alberta in July 2021 average demand came close to 10 000 MW per hour, while it was generally around 9 500 MW in previous years. Average Albertan hourly demand in June 2021 was above 9 600 MW, up from an average of 8 900 MW over the previous five years.
Despite having a smaller population than B.C., Alberta consumes significantly more electricity per year. In 2019, Alberta consumed almost 87 000 gigawatt hours (GWh) of electricity, while B.C. consumed just under 59 000 GWh.Footnote 4 This difference mainly comes from Alberta’s energy intensive industrial sector, which consumed more than twice as much electricity as B.C.’s industrial sector in 2019.
In Alberta, there is typically a relatively small number hours in a year where total electricity system demand exceeds 11 000 MW. In B.C., a comparably high demand hour would be closer to 9 000 MW. In most years, these hours occur only during the winter months of December, January, and February, when temperatures are at their coldest and heating demand is at its highest.
In the six years from 2015 to 2020, there were only 10 hours in June, July, and August where electricity demand in Alberta was above 11 000 MW, while 63 such hours occurred in the summer of 2021. All the hours where summer demand was over 11 000 MW from 2015 to 2020 occurred in August 2018 during a heatwave.Footnote 5 In B.C. there were 21 hours where demand was above 9 000 MW in June, July, and August between 2015 to 2021, all of which occurred during the 2021 heat dome.Footnote 6 So far in 2021, the heat dome has accounted for 22% of high demand hours in Alberta and 5% in B.C. However, this share is likely to shrink as high demand hours tend to occur in November and December in both provinces.
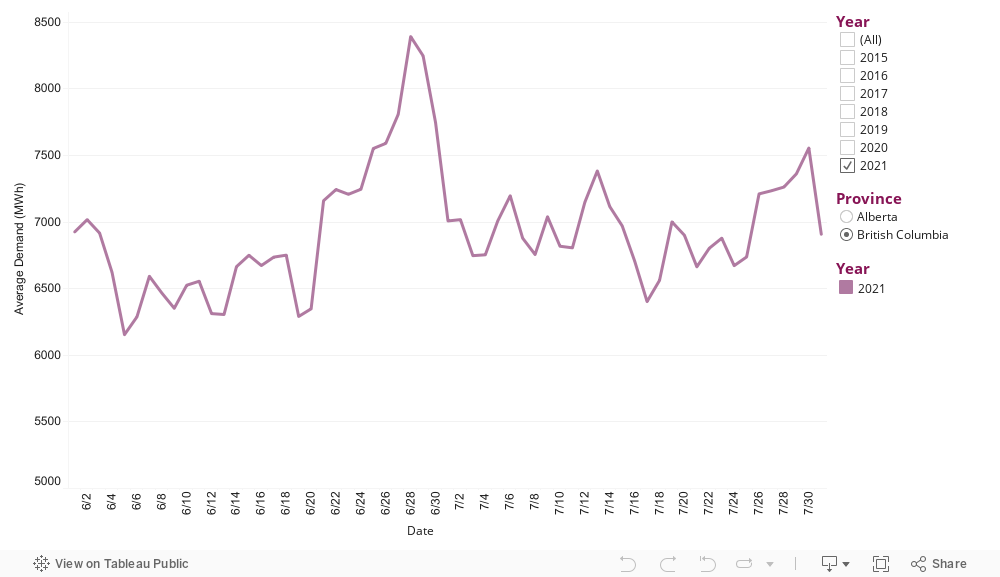
Figure 3: Average Daily Electricity Demand in June and July for Alberta and B.C.
Source and Description
Source: BC Hydro – Balancing Authority Load Data (B.C.), Alberta Electric System Operator – Market and system reporting (Alberta)
Description: This line chart shows average daily electricity demand in Alberta and B.C. for the years 2015-2021 in June and July. Demand in the two provinces peaked in late June through early July. During the heat dome, electricity demand peaked at 5 p.m. on 28 June 2021 at 9 539 MW in B.C. While this was a record high for summer electricity demand it is far below the B.C. record of 11 541 set at 6 p.m. on 14 January 2020. In Alberta, demand peaked at 11 721 MW on 29 June 2021 at 2 p.m., which was the second-highest hourly electricity demand ever recorded in the province, with the highest occurring in February of 2021.
If extreme temperature events like the heat dome become more common in the future, some Canadian regions may see summer peak electricity demand that approach the peaks of winter. This summer demand shift could be accelerated if more homes and businesses install air conditioning in response to hotter temperatures. Changes in seasonal demand could affect electricity grid planners, who must ensure enough electricity can be produced to meet both winter and summer peaks.
- Date modified: