ARCHIVED – Canada’s Adoption of Renewable Power Sources – Energy Market Analysis
This page has been archived on the Web
Information identified as archived is provided for reference, research or recordkeeping purposes. It is not subject to the Government of Canada Web Standards and has not been altered or updated since it was archived. Please contact us to request a format other than those available.
Introduction
The electricity industry around the world is moving towards increased renewable generation, including hydro, biomass, wind, and solar. Although these forms of generation have also increased substantially in Canada, further growth is not without challenges.
Canadian electricity prices are among the lowest in the world, making it difficult for relatively expensive non-hydro renewable sources to compete. Renewable power projects can also face public criticism and approval delays. As shown in Figure 1, Canadian electricity demand was relatively flat from 2005 to 2015. The NEB’s latest long-term energy outlook projects electricity demand to grow at an average of 0.7% per year from 2015 to 2040.
Table 1 – Renewable Electricity in Canada – Key Statistics
| Key Statistics (2015) | Renewables |
|---|---|
| Installed capacity | 94 929 MW |
| Share of Canada’s capacity | 65.6% |
| Share of Canada's generation | 65.7% |
| Electricity generated | 429 229 GW.h |
| Generation growth from 2005 to 2015 | 17% |
Source: Canada’s Energy Future 2016: Update – Energy Supply and Demand Projections to 2040
Figure 1 – Canadian Electricity Demand
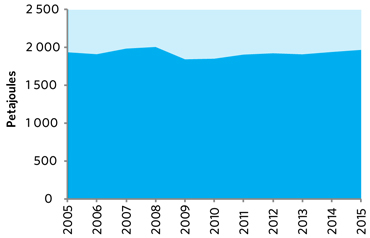
Source: Canada’s Energy Future 2016: Update – Energy Supply and Demand Projections to 2040
Description:
This graph shows Canadian electricity demand from 2005 to 2015. Over this period, demand was relatively flat at just under 2 000 PJ.
For more information on historical growth rates for renewable power in Canada, including data for each province and territory, please see Canada’s Renewable Power Landscape.
This report, Canada’s Adoption of Renewable Power Sources, discusses major renewable technologies in greater detail, with emphasis on factors influencing their adoption rates. These include costs, technological advancements, environmental considerations, and regulatory issues. This report also compares renewable generation growth in Canada to developments in other countries.

Table 2 – Renewable Electric Capacity and Generation in Canada
| Capacity in MW and % | Generation in GW.h and % | |||
|---|---|---|---|---|
| 2005 | 2015 | 2005 | 2015 | |
 Hydro Hydro |
72 859 | 79 313 | 358 387 | 385 500 |
| 59.7% | 54.8% | 59.0% | 59.0% | |
 Wind Wind |
557 | 11 072 | 1 453 | 28 561 |
| 0.5% | 7.7% | 0.2% | 4.4% | |
 Biomass Biomass |
1 789 | 2 408 | 7 875 | 12 161 |
| 1.5% | 1.7% | 1.3% | 1.9% | |
 Solar Solar |
17 | 2 135 | 0 | 3 007 |
| 0% | 1.5% | 0% | 0.5% | |
| All renewable sources | 75 222 | 94 929 | 367 716 | 429 229 |
| 61.6% | 65.6% | 60.6% | 65.7% | |
| All sources | 122 065 | 144 608 | 607 007 | 653 183 |
Source: Canada’s Energy Future 2016: Update – Energy Supply and Demand Projections to 2040
Hydro electricity comes from the energy in water flowing over reservoir dams or through run-of-river projects.
Wind power is captured by the blades of wind turbines which spin a shaft connected to a generator.
Biomass power comes from burning organic waste.
Solar energy comes from photovoltaic (PV) cells converting sunlight into electricity at the atomic level.
Electric capacity vs generation
Capacity is the maximum amount of power that a device can generate, use, or transfer. It is usually expressed in megawatts.
Generation is the process of producing electric energy by transforming other forms of energy. In this report, generation is commonly used to refer to the amount of energy actually produced.
- Date modified: