ARCHIVED – Canada’s Adoption of Renewable Power Sources – Energy Market Analysis
This page has been archived on the Web
Information identified as archived is provided for reference, research or recordkeeping purposes. It is not subject to the Government of Canada Web Standards and has not been altered or updated since it was archived. Please contact us to request a format other than those available.
International Comparisons
Canada is a world leader in renewable electricity production and generates a larger share of its electricity from renewable sources, including hydro, than most developed economies.
In 2015, Canada generated about 66% of its electricity from renewable sources. Canada’s renewable power sector relies mostly on hydro. Wind and solar, which have grown tremendously across the globe, play a much smaller role in Canada than in some other countries.
Only 12 countries generate more than half of their electricity from renewable sources. Like Canada, most of them rely heavily on hydro, but Denmark is a significant outlier. Denmark produces a small amount of hydro but generates two-thirds of its electricity from wind, biomass, and solar.
Canada’s electricity generation per capita is relatively high. With over 600 TW.h of electricity production in 2015, Canada generates as much electricity as some countries with much higher populations, including Brazil, Germany, and France.
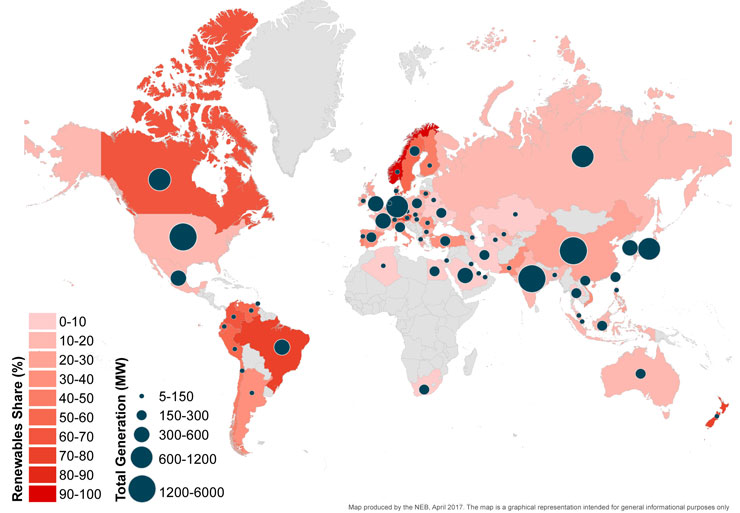
Figure 2 – Electricity Generation and Share of Renewables in Electricity Generation
Source: BP World Energy Statistical Review
Description:
This map shows countries based on their share of electricity generation from renewable sources. Countries are coloured pink if they have less than 10% of renewables in their electrical mix and range up to dark red with over a 90% share of renewables. Countries without data are shown in grey. A dot over each country represents the total generation in megawatts.
In 2015, Canada generated about 10% of the world’s hydroelectricity – second only to China. Hydroelectricity accounts for about 60% of Canada’s production. Only two countries generate a higher proportion of their electricity from hydro sources: Norway and Brazil. (See Figure 2)
In the same year, Canada accounted for about 3% of global wind production, which placed it 7th in the world (See Figure 11). However, wind generation only accounts for a small proportion (4%) of Canada’s production. In other countries, wind production plays a much larger role in the electricity mix, including Denmark (50%), Ireland (23%), and Portugal (22%). (See Figure 2)
Solar plays a modest role in Canada’s electricity mix (0.5%), but is used heavily in a number of other countries. In 2015, four countries generated 5% of their electricity from solar: Italy (9%), Greece (7%), Germany (6%), and Spain (5%).
Similarly, geothermalFootnote 1 and biomass energy account for about 2% of Canadian electricity generation but more than 10% of electricity generation in New Zealand, Finland, Denmark, , the Philippines, and Lithuania. (See Figure 2 and Figure 3)
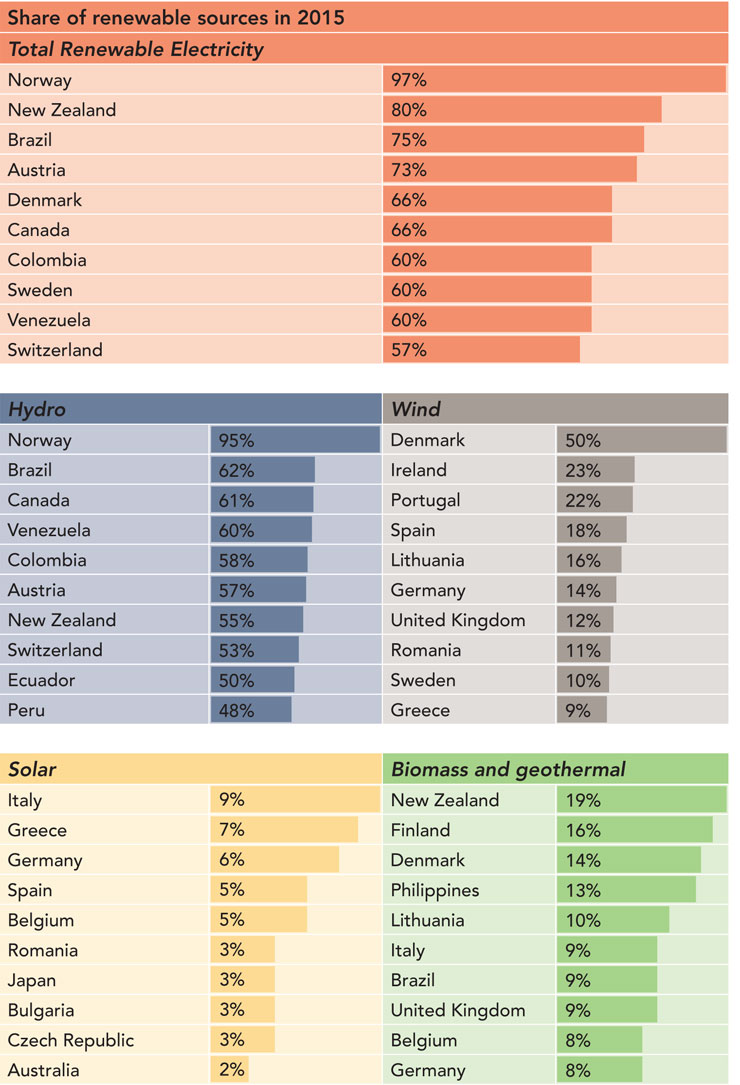
Figure 3 – Countries with Highest Share of Renewables
Source: BP World Energy Statistical Review
Note: BP World Energy generation numbers for Canada are slightly different than NEB numbers but they are used in international comparisons for consistency.
Description:
| Total Renewable Electricity | |
|---|---|
| Norway | 97% |
| New Zealand | 80% |
| Brazil | 75% |
| Austria | 73% |
| Denmark | 66% |
| Canada | 66% |
| Colombia | 60% |
| Sweden | 60% |
| Venezuela | 60% |
| Switzerland | 57% |
| Hydro | Wind | ||
|---|---|---|---|
| Norway | 95% | Denmark | 50% |
| Brazil | 62% | Ireland | 23% |
| Canada | 61% | Portugal | 22% |
| Venezuela | 60% | Spain | 18% |
| Colombia | 58% | Lithuania | 16% |
| Austria | 57% | Germany | 14% |
| New Zealand | 55% | United Kingdom | 12% |
| Switzerland | 53% | Romania | 11% |
| Ecuador | 50% | Sweden | 10% |
| Peru | 48% | Greece | 9% |
| Solar | Biomass and geothermal | ||
| Italy | 9% | New Zealand | 19% |
| Greece | 7% | Finland | 16% |
| Germany | 6% | Denmark | 14% |
| Spain | 5% | Philippines | 13% |
| Belgium | 5% | Lithuania | 10% |
| Romania | 3% | Italy | 9% |
| Japan | 3% | Brazil | 9% |
| Bulgaria | 3% | United Kingdom | 9% |
| Czech Republic | 3% | Belgium | 8% |
| Australia | 2% | Germany | 8% |
| Source: BP World Energy Statistical Review. The source includes data for 71 countries. Note: BP World Energy generationnumbers for Canada are slightly different than NEB numbers but they are used in international comparisons for consistency. | |||
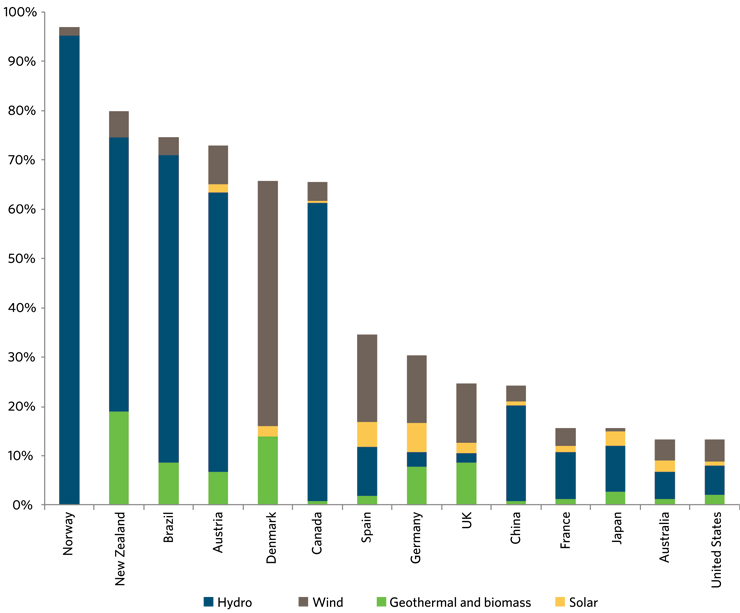
Figure 4 – Renewables in Electricity Generation Mix: Top Selected Countries
Source: BP World Energy Statistical Review
Note: BP World Energy generation numbers for Canada are slightly different than NEB numbers but they are used in international comparisons for consistency.
Description:
The stacked column graph shows the percentage of electricity generated from wind, solar, hydro and biomass sources in fourteen select countries, including Canada. In this selection, Norway relies the most on renewable sources and the United States, the least. In 2015, Norway produced 97% of its electricity from renewable sources and the United States produced 13%.
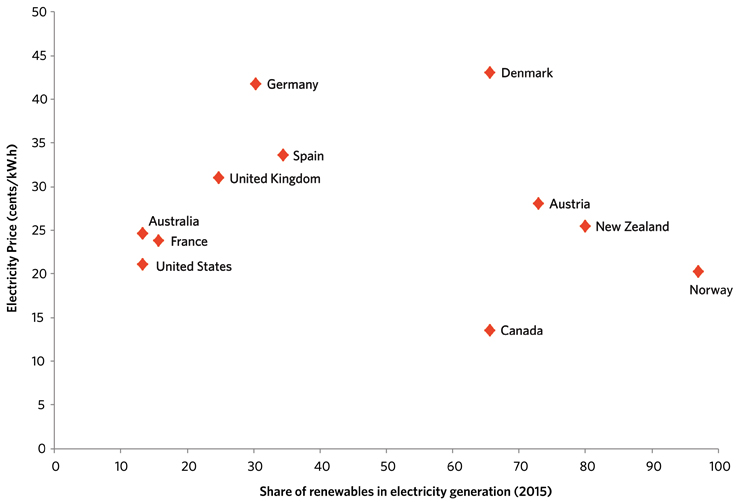
Canada’s electricity prices are relatively low compared to many other countries. Consumers in Germany and Denmark pay more than twice as much as Canadians for each kW.h of electricity. However, consumers in those countries use less electricity per capita than in Canada, so their total electricity bills are not necessarily much higher. (See Figure 5)
Figure 5 – Share of Renewables and Electricity Prices: Selected Countries
Sources:
Prices: Canada and the US – Hydro Quebec: Comparison of Electricity Prices in Major North American Cities (2015)
European countries – Eurostat
Australia – Australian Energy Market Commission: 2015 Residential Electricity Price Trends
New Zealand Ministry of Business, Innovation and Employment – Sales based Electricity Costs
Share of renewable generation: BP World Energy Statistical Review
Description:
The graph plots the share of renewable generation, on the x axis, and residential electricity prices, on the y axis, for 11 selected countries. In most cases, prices are higher when the share of renewable generation is higher. Canada and Norway are the outliers. They have the lowest prices but generate more electricity from renewable sources than the other countries in the selection. Canada and Norway mostly use hydro, which is usually the cheapest form of renewable generation.
- Date modified: