ARCHIVED – Canada’s Energy Future 2019 Supplement: Natural Gas Liquids
This page has been archived on the Web
Information identified as archived is provided for reference, research or recordkeeping purposes. It is not subject to the Government of Canada Web Standards and has not been altered or updated since it was archived. Please contact us to request a format other than those available.
Canada’s Energy Future 2019 Supplement: Natural Gas Liquids [PDF 261 KB]
Data and Figures [EXCEL 4165 KB]
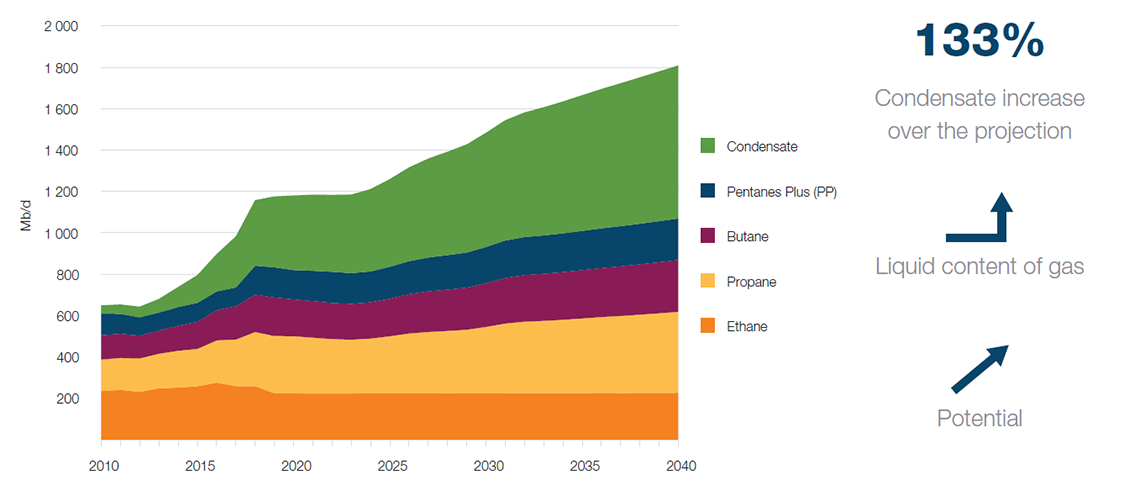
Natural Gas Liquids Production Projection – Canada
Description:
This chart shows the production of various natural gas liquids in Canada from 2010 to 2040. Ethane production falls only slightly over the projection from 236 Mb/d in 2010 to 227 Mb/d in 2040. Propane increases significantly from 152 Mb/d in 2010 to 392 Mb/d in 2040. Butane also increases, from 118 Mb/d in 2010 to 250 Mb/d in 2040. Pentanes Plus nearly double’s its production from 104 Mb/d in 2010 to 201 Mb/d by 2040. Condensate increases from only 40 Mb/d in 2010 to 740 Mb/d in 2040.
Production depends on natural gas production and, in the short-term, NGL production levels off as gas production declines. In the long-term, natural gas production rises with rising gas prices, causing rising NGL production as activity continues to focus on liquids-rich tight and shale gas areas. Increasing NGL production means greater potential for petrochemical growth and export growth.
Ethane Potential – Mb/d

Description:
This chart shows the potential production of ethane along with the projected actual production from gas processing and off gas plants. Production of ethane from both sources decreases slightly over the projection from 236 Mb/d in 2010 to 208 Mb/d in 2040. While the production remains relatively flat, the amount of ethane that is not recovered grows considerably. Ethane potential increases from 14 Mb/d in 2014 to 424 Mb/d in 2040.
Canadian Trade Numbers...
| 2010 | 2025 | 2040 | |
|---|---|---|---|
| Ethane, thousand b/d (Mb/d) Imports |
0 |
130 |
130 |
| Propane, Mb/d Exports Imports |
81 6 |
154 15 |
249 15 |
| Butane, Mb/d Exports Imports |
24 12 |
49 7 |
107 7 |
| PP and Condensate, Mb/d Net Imports |
157 |
226 |
30 |
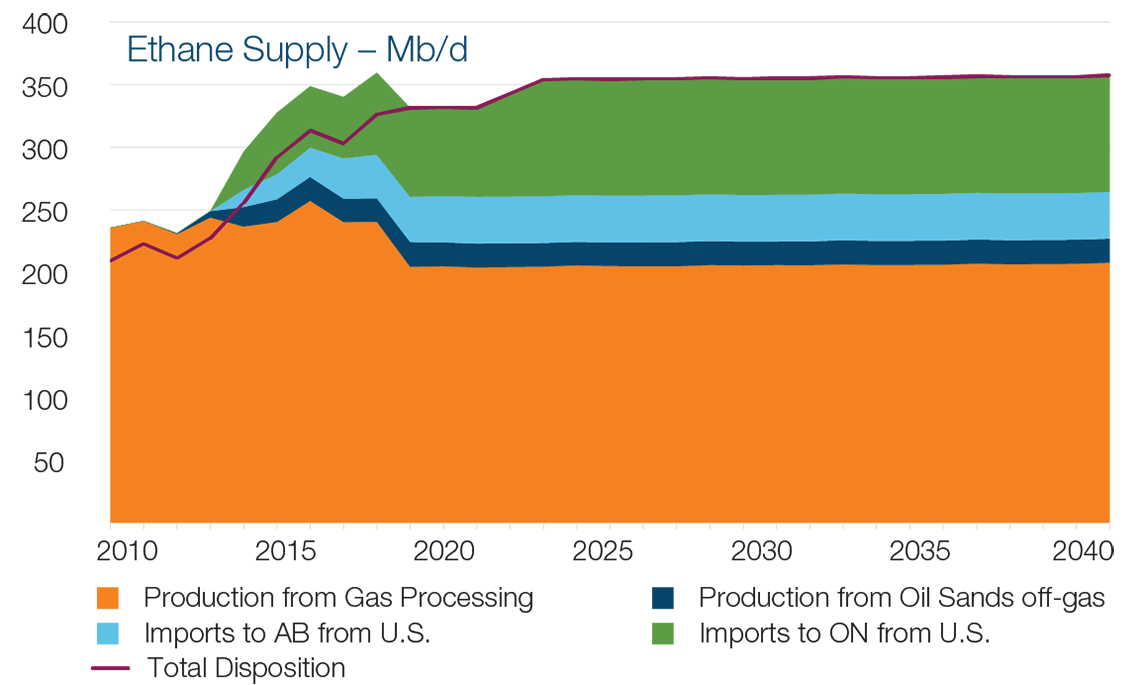
Ethane Supply – Mb/d
Description:
This chart shows the supply of ethane from various sources from 2010 to 2040. Ethane production from gas processing falls slightly from 236 Mb/d to 208 Mb/d in 2040. Production of ethane from oil sands off-gas facilities grow from 0 Mb/d in 2010 to 19 Mb/d in 2040. Imports of ethane into Alberta from the United States grow from 0 Mb/d in 2010 to 37 Mb/d in 2040 while imports of ethane into Ontario from the United States grow from 0 Mb/d in 2010 to 93 Mb/d in 2040. Total supply grows from 236 Mb/d in 2010 to 357 Mb/d in 2040.
Ethane Disposition – Mb/d

Description:
This chart shows the disposition of ethane in Canada from 2010 to 2040. Alberta petrochemical demand grows over the projection from 198 Mb/d in 2010 to 253 Mb/d in 2040. Similarly, Ontario petrochemical demand grows from 0 Mb/d in 2010 to 93 Mb/d in 2040. Demand for ethane as a solvent in the oil sands remains relatively flat, falling from 12 Mb/d in 2010 to 11 Mb/d in 2040. Exports of ethane remain 0 Mb/d throughout the projection.
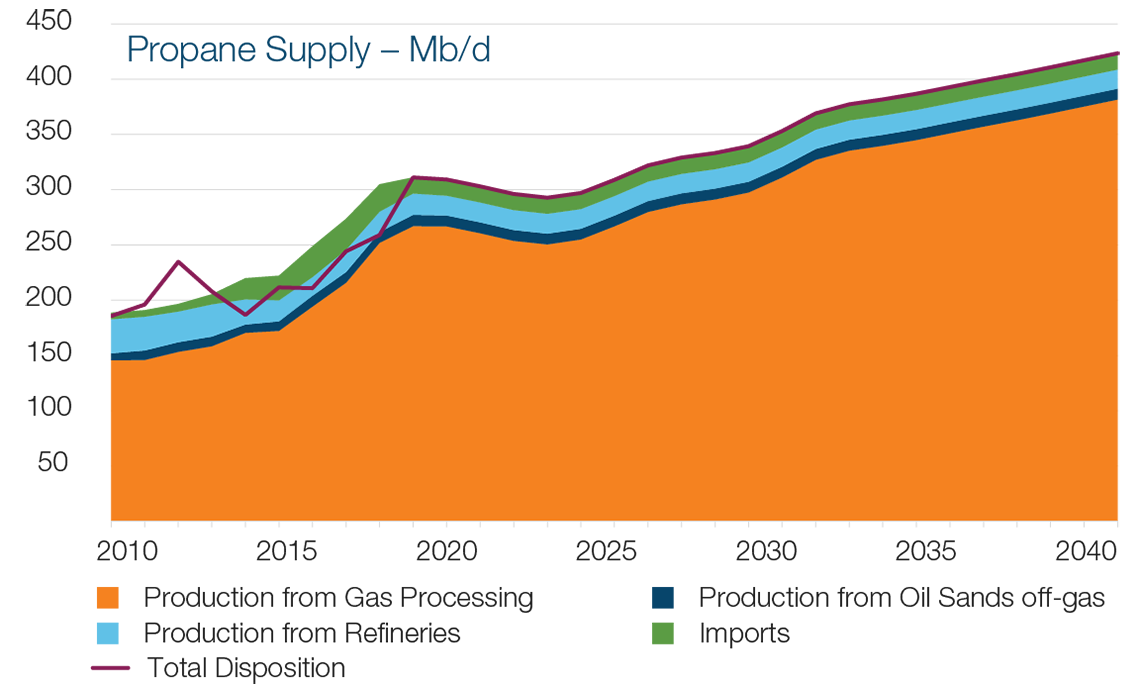
Propane Supply – Mb/d
Description:
This chart shows the supply of propane from various sources from 2010 to 2040. Propane production from gas processing grows from 146 Mb/d to 382 Mb/d in 2040. Production of propane from oil sands off-gas facilities grow from 6 Mb/d in 2010 to 10 Mb/d in 2040. Production of propane from refineries falls from 31 Mb/d in 2010 to 17 Mb/d in 2040. Imports of propane grow from 6 Mb/d in 2010 to 15 Mb/d in 2040. Total supply grows from 189 Mb/d in 2010 to 423 Mb/d in 2040.
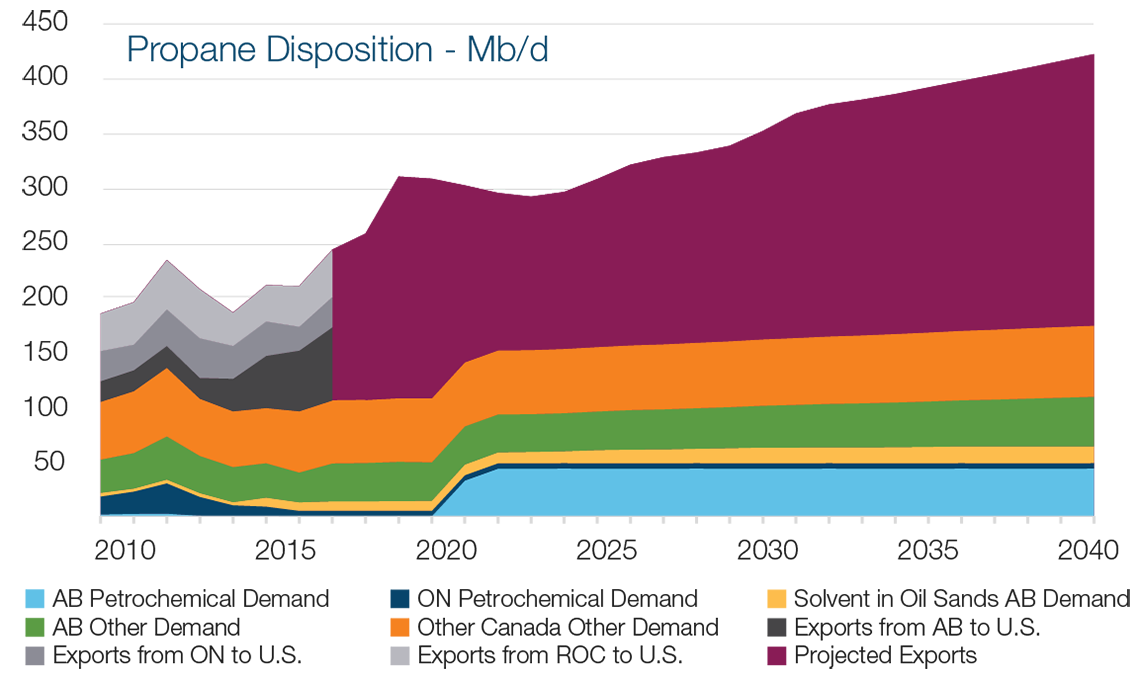
Propane Disposition – Mb/d
Description:
This chart shows the disposition of propane in Canada from 2010 to 2040. Alberta petrochemical demand grows over the projection from 2 Mb/d in 2010 to 44 Mb/d in 2040. Ontario petrochemical demand falls from 17 Mb/d in 2010 to 5 Mb/d in 2040. Demand for propane as a solvent in the oil sands grows from 3 Mb/d in 2010 to 15 Mb/d in 2040. Other Alberta demand for propane grows from 30 Mb/d in 2010 to 46 Mb/d in 2040. Similarly, other Canadian demand grow from 53 Mb/d in 2010 to 65 Mb/d in 2040. Exports of propane from Alberta to the United States grow from 19 Mb/d in 2010 to 67 in 2017. Exports of propane from Ontario to the United States remain flat at 28 Mb/d in 2010 to 28 Mb/d in 2017. Exports from the rest of Canada grow from 34 Mb/d in 2010 to 43 Mb/d in 2017. Projected exports from all of Canada grow from 152 Mb/d in 2018 to 249 Mb/d in 2040. Total disposition grows from 186 Mb/d in 2010 to 423 Mb/s in 2040.
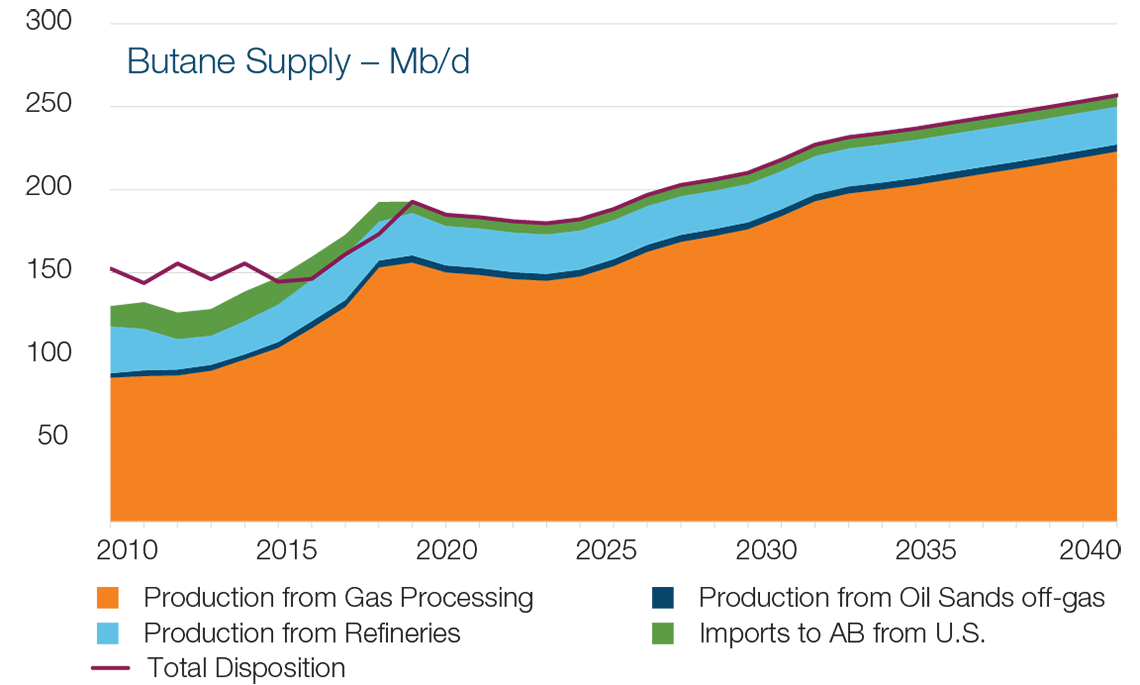
Butane Supply – Mb/d
Description:
This chart shows the supply of butane from various sources from 2010 to 2040. Butane production from gas processing grows from 87 Mb/d to 223 Mb/d in 2040. Production of butane from oil sands off-gas facilities grow from 3 Mb/d in 2010 to 4 Mb/d in 2040. Production of butane from refineries falls from 28 Mb/d in 2010 to 23 Mb/d in 2040. Imports of butane from the United States to Alberta fall from 12 Mb/d in 2010 to 7 Mb/d in 2040. Total supply grows from 130 Mb/d in 2010 to 257 Mb/d in 2040.
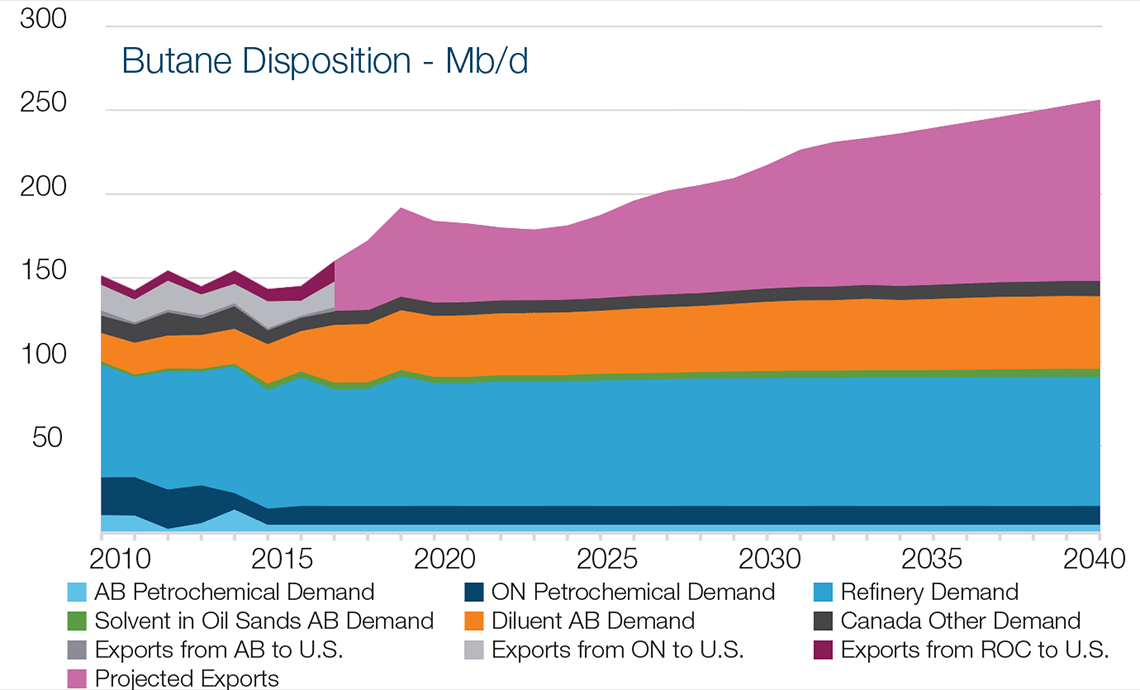
Butane Disposition – Mb/d
Description:
This chart shows the disposition of butane in Canada from 2010 to 2040. Alberta petrochemical demand falls over the projection from 11 Mb/d in 2010 to 5 Mb/d in 2040. Ontario petrochemical demand falls from 22 Mb/d in 2010 to 11 Mb/d in 2040. Refinery demand grows from 67 Mb/d in 2010 to 77 Mb/d in 2040. Demand for butane as a solvent in the oil sands grows from 2 Mb/d in 2010 to 5 Mb/d in 2040. Alberta diluent demand for butane grows from 17 Mb/d in 2010 to 43 Mb/d in 2040. Other Canadian demand remains steady at 10 Mb/d in 2010 and 9 Mb/d in 2040. Exports of butane from Alberta to the United States are steady at 3 Mb/d in 2010 to 2 in 2017. Exports of butane from Ontario to the United States remain flat at 15 Mb/d in 2010 to 15 Mb/d in 2017. Exports from the rest of Canada grow from 5 Mb/d in 2010 to 12 Mb/d in 2017. Projected exports from all of Canada grow from 41 Mb/d in 2018 to 107 Mb/d in 2040. Total disposition grows from 153 Mb/d in 2010 to 257 Mb/s in 2040.
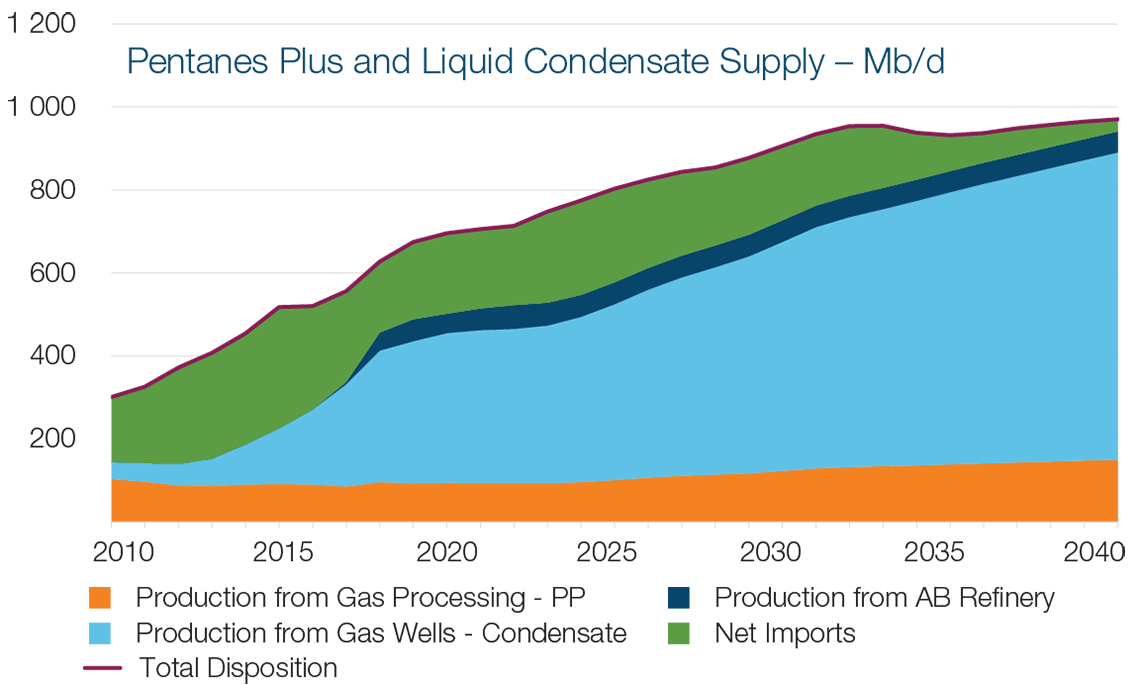
Pentanes Plus and Liquid Condensate Supply – Mb/d
Description:
This chart shows the supply of pentanes plus and condensate from various sources from 2010 to 2040. Pentanes plus production from gas processing grows from 104 Mb/d to 150 Mb/d in 2040. Condensate production from gas wells grows from 40 Mb/d in 2010 to 740 in 2040. Production from Alberta refineries grows from 0 Mb/d in 2010 to 50 Mb/d in 2040. Net imports into Canada decline from 157 Mb/d in 2010 to 30 Mb/d in 2040. Total supply grows from 301 Mb/d in 2010 to 970 Mb/d in 2040.
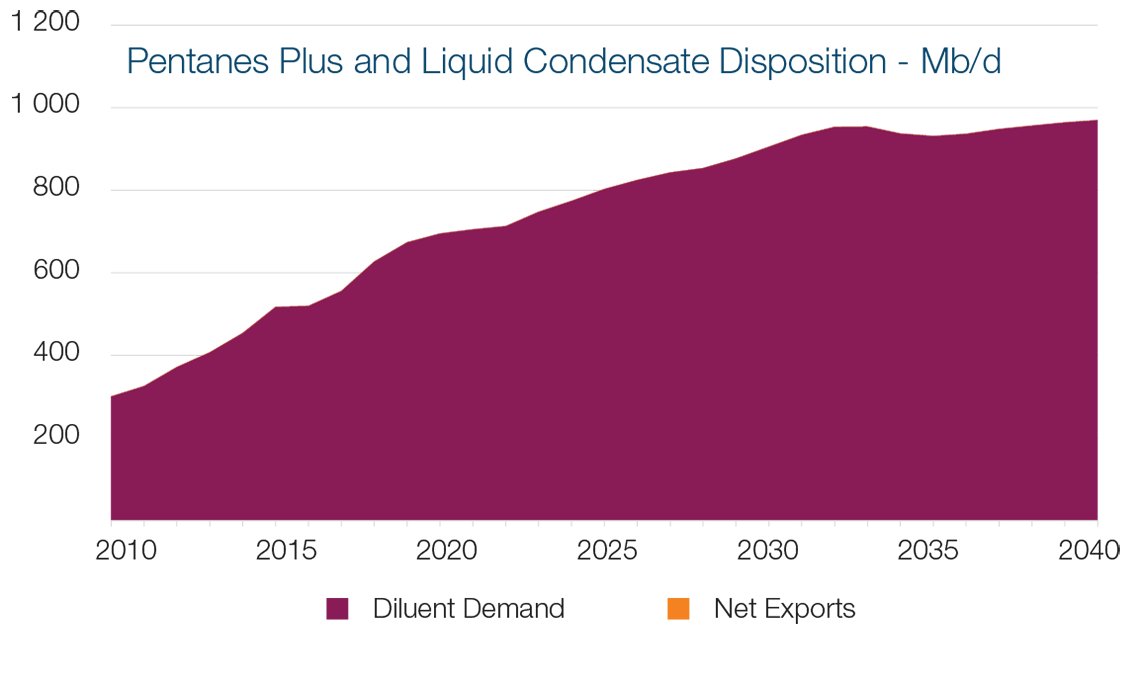
Pentanes Plus and Liquid Condensate Disposition – Mb/d
Description:
This chart shows the disposition of Pentanes plus and condensate in Canada. Diluent demand for pentanes plus and condensate grows from 301 Mb/d in 2010 to 970 Mb/d in 2040. Net exports during that time are 0 Mb/d.
- Date modified: