Back to Main

Assumptions

This page has been archived on the Web

Information identified as archived is provided for reference, research or recordkeeping purposes. It is not subject to the Government of Canada Web Standards and has not been altered or updated since it was archived. Please contact us to request a format other than those available.

EF2019 includes an update to the Reference Case projection. The Reference Case is based on a current economic outlook, a moderate view of energy prices and technological improvements, and climate and energy policies announced and sufficiently detailed for modeling at the time of analysis.

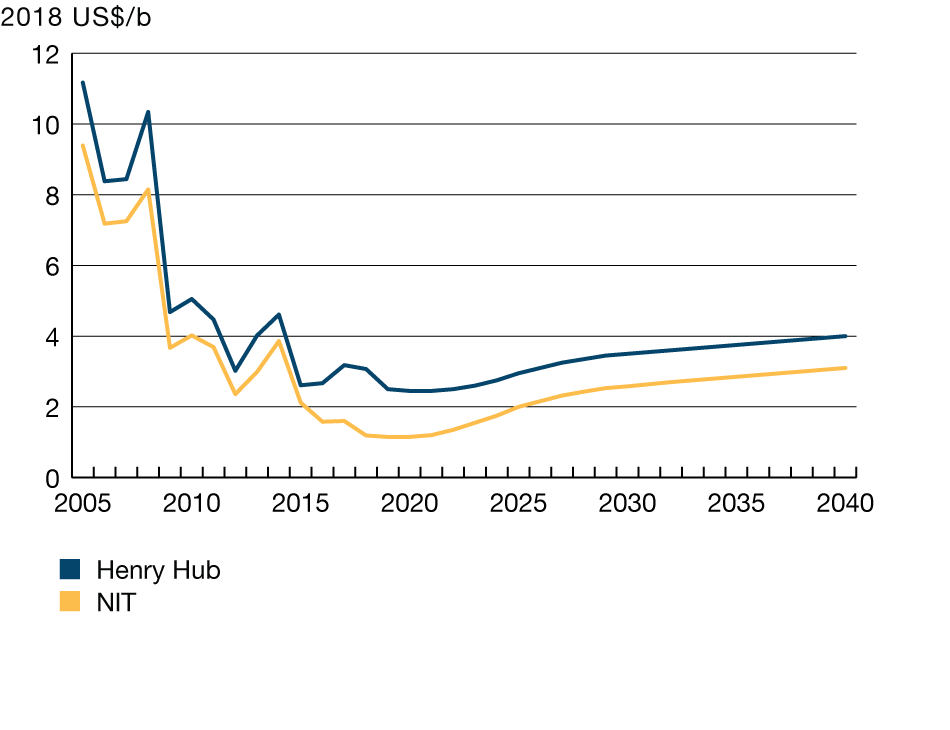
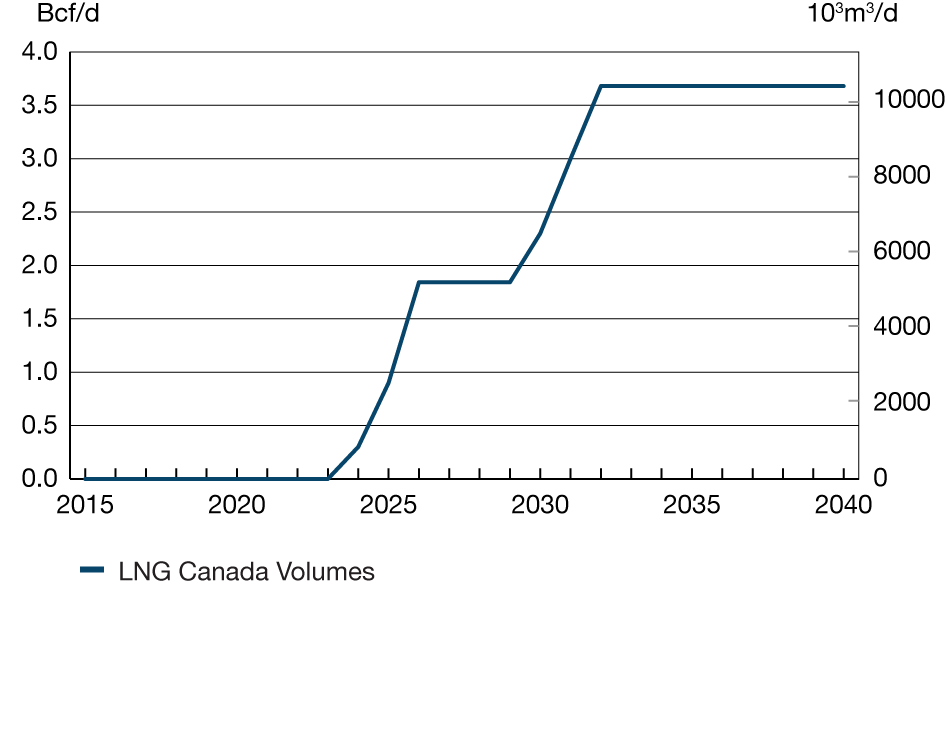
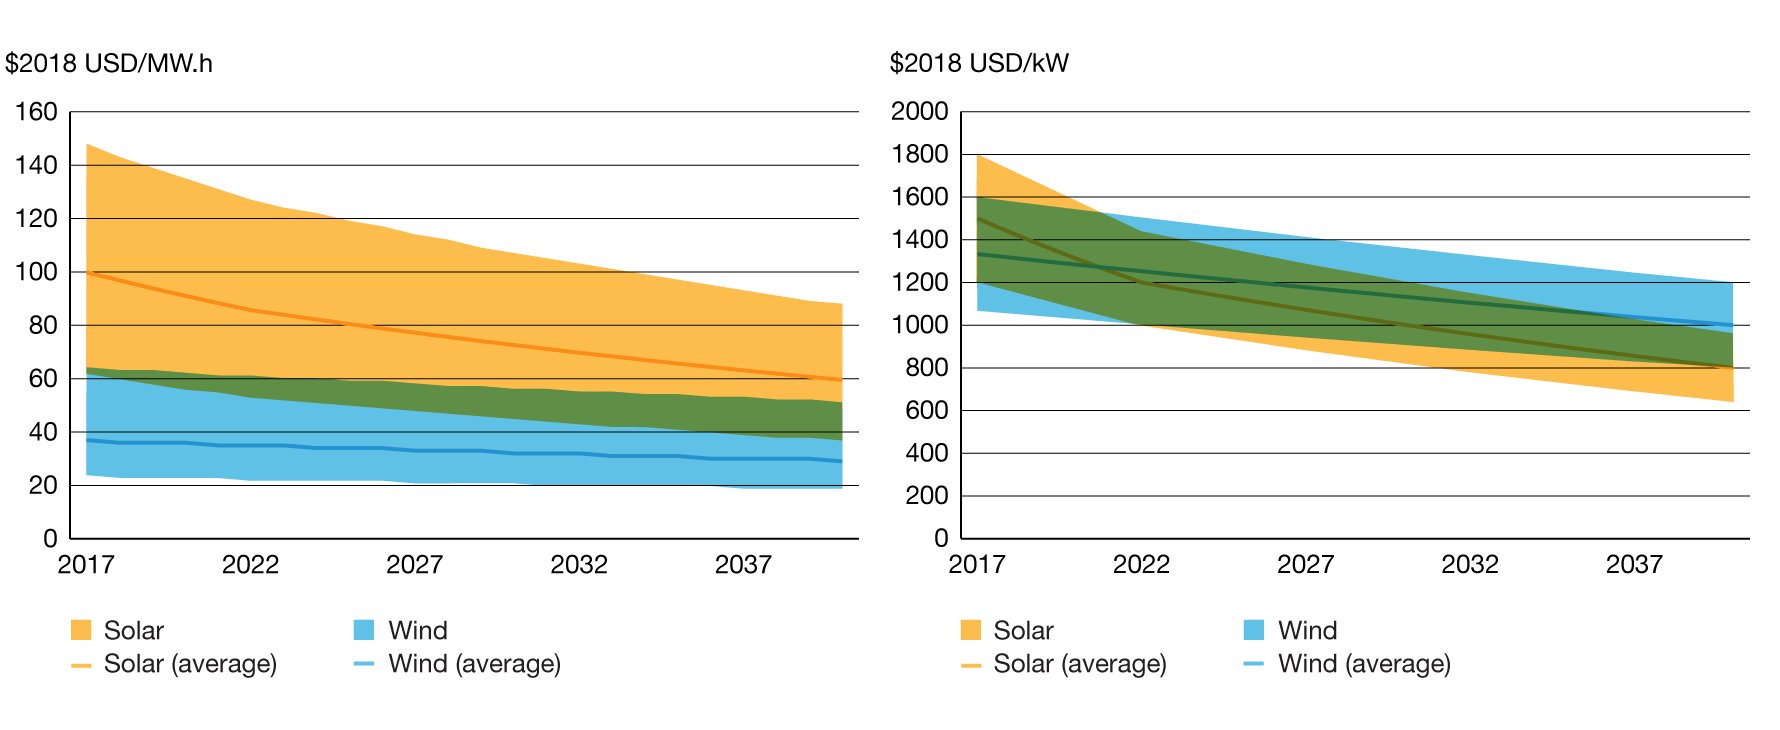
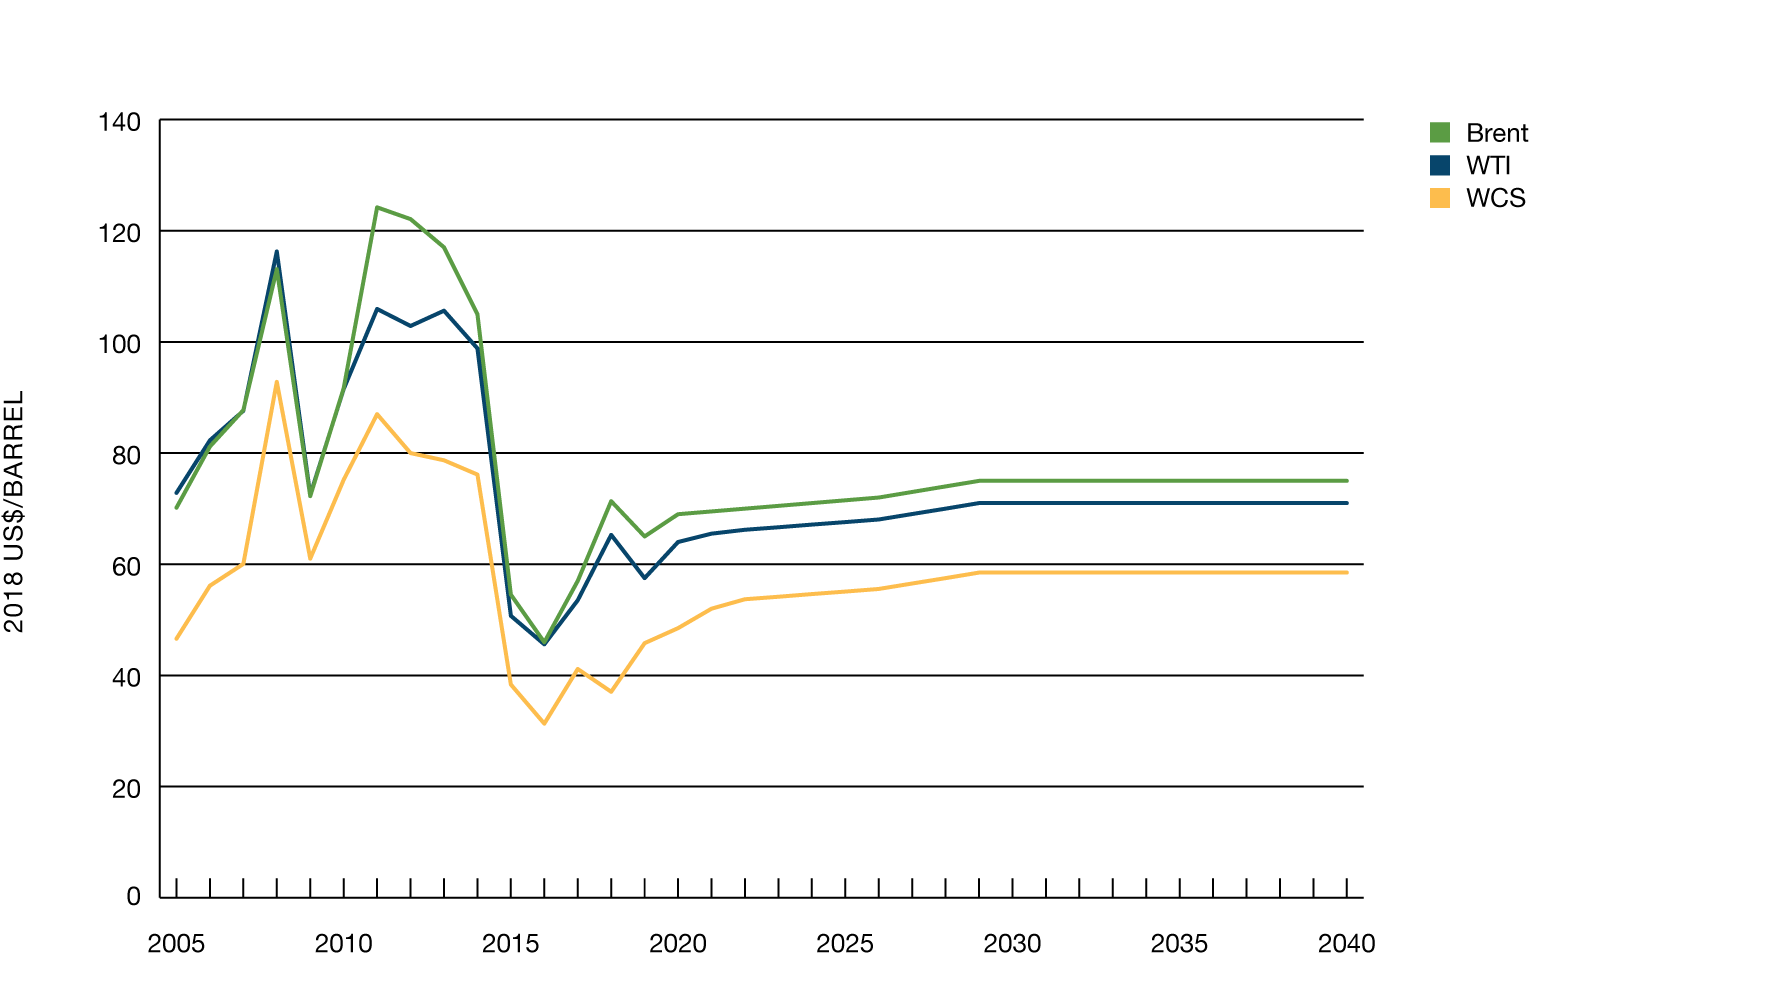
The outlook makes a variety of assumptions about future trends that are necessary to make long-term projections. These are factors such as included climate policies and regulations, rate of technological change, crude oil and natural gas markets (both domestic and global), infrastructure, major electricity projects and future costs of new generation capacity. Additional detail on the specific assumptions is below.

General Reference Case Assumptions

  • Infrastructure and markets: In the short term, infrastructure assumptions are based on existing pipeline projects and announced completion dates. This analysis should not be taken as an endorsement of, or prediction about, any particular project. Rather, these assumptions are necessary for the analysis. After 2025, infrastructure is assumed to be in place to move energy production and markets are found.

  • Energy Prices: These price assumptions are based on consensus views from other forecasting agencies, as well as CER analysis. Many factors could influence future price trends. These include development of new technologies, and the impact of international climate change policies on long-term global oil and natural gas demand.

  • Goals and targets: Unless provided with a definitive policy or regulatory framework for achieving them, climate and other related goals and targets are not explicitly modelled.

  • Policies: Climate and other related goals and targets are not explicitly modelled. Rather, policies currently in place are included in the Reference Case. Climate and other relevant policies with sufficient detail to model or make assumptions on are also included. This includes various simplifying assumptions to reflect carbon pricing systems.

  • Technological change: The Reference Case assumes moderate improvement in technology. This includes efficiency and cost reductions of renewables in line with current trends.

EF 2019 is a baseline for discussion

It is important to note that the projections presented in EF2019 are a baseline for discussing Canada’s energy future today and do not represent the CER’s predictions of what will take place in the future. EF2019 projections are based on assumptions which allow for analysis of possible outcomes. Any assumptions made about current or future energy infrastructure or market developments are theoretical and have no bearing on any regulatory proceeding that is, or will be, before the CER.

Over the projection period, it is likely that developments beyond normal expectations, such as geopolitical events or technological breakthroughs, will occur. Also, new information will become available and trends, policies, and technologies will continue to evolve. This report should not be taken as an official or definitive impact analysis of any specific policy initiative, nor does it aim to show how specific goals, such as Canada’s climate targets, will be achieved.

Back to Top

Climate Policy

EF2019 includes many recently announced and implemented climate policies. In order to determine whether a policy was included in the analysis, the following criteria were applied:

  • The policy was publically announced prior to 1 August 2019.
  • Sufficient details exist to model the policy.[3]
  • Goals and targets, including Canada’s international climate targets, are not explicitly modelled. Rather, policies that are announced, and in place, to address those targets are included in the modelling and analysis.

Key policies and regulations included in the EF2019 projections:

  • Carbon pricing: EF2019 includes provincial and territorial carbon pricing systems, as well as the Federal Carbon Pricing Backstop (Backstop). Implementation of carbon pricing systems currently vary across the country, and details on each region’s approach are available from Environment and Climate Change Canada. For provinces that have not declared their own carbon pricing system, or have priced carbon at a level below the Backstop schedule, the Backstop schedule is used. For these regions, the carbon price reaches $50 per tonne in 2022 and stays at that level for the remainder of the outlook. For provinces such as Quebec and Nova Scotia that have adopted a cap-and-trade program, the price of carbon is market-based, determined by the supply and demand of emission permits. Like crude oil and natural gas prices, EF2019 makes simplifying assumptions for the future outlook of carbon pricing. EF2019 assumes the carbon price in these provinces remains below the Federal Backstop in the early 2020s, before converging to $50 per tonne in 2025 and remaining at the level for the remainder of the outlook.

  • Coal-phase out: As per Federal regulations, coal is phased out of electricity generation by 2030. Remaining capacity is due to assumed equivalency agreements in certain provinces, or units equipped with carbon capture and storage (CCS).

  • Efficiency regulations: A variety of policies and regulations influence energy efficiency. Key regulations include current transportation vehicle emission standards for passenger vehicles and heavy duty freight vehicles, appliance standards, and building codes.

  • Support for electric vehicles: Many provinces have policies and initiatives to support low and zero emission vehicles (ZEV). This includes Quebec’s ZEV mandate, as well as B.C.’s Zero-Emission Vehicles Act. Federal action includes subsidies for electric vehicles, as well as support for charging infrastructure through the zero emission vehicle infrastructure program.

  • Support for renewable energy: The Federal Government as well as several provinces and territories provide support for renewable energy in various ways. This includes broad energy strategies and targeted renewable energy goals carried out by utilities. This has also been a dynamic area in the last couple of years. EF2019 incorporates the recent cancellation of the Renewable Electricity Program (REP) program in Alberta, as well as renewable contract terminations in Ontario.

Climate policy continues to evolve. Various policies, regulations and standards are being developed by all levels of government. Several policy initiatives that are intended to support Canada’s transition to a low carbon economy are still under development and not included in the EF2019 projections. These include the Clean Fuel Standard[4], net zero building codes, and other future federal, provincial, and territorial measures. ECCC provides information on planned policies and how they impact future emissions projections.

Back to Top

Technology

Technological changes can have large impacts on energy systems. Over the past decade, technological advancements have unlocked fossil fuel resources, dramatically reduced the cost of wind and solar power, and led to improvements in efficiency of energy use and production.

The EF2019 projections assume moderate technological progress, including incremental efficiency improvements and cost reductions for well-established technologies. However, there is a high degree of potential for further technological progress across the energy system. This includes improving performance and economics of all types of energy production, and development of new technologies to support the transition to a low carbon economy. Which emerging technologies will achieve widespread use is difficult to predict. Likewise, the nature of future breakthroughs is unknown. The adoption rate of emerging technologies is a key uncertainty to the projections in EF2019.

Key Technology Developments:

  • Falling costs of renewable energy.

  • Falling costs of battery electric vehicles and battery storage.

  • Growth in alternative fuels such as renewable natural gas and hydrogen.

  • Improved productivity of oil and gas resource extraction.

  • End-use efficiency improvements such as improving fuel economy in vehicles and efficiency of heating technologies.

Back to Top

Crude Oil and Natural Gas Markets and Infrastructure

Canada is a major crude oil and natural gas producer and prices are an important driver of future production growth. International crude oil and natural gas prices are a key driver of the Canadian energy system and are determined by supply and demand factors beyond Canada’s borders.

Recently, Canadian crude oil and natural gas benchmark prices (such as WCS for heavy crude oil and NIT for natural gas) have been influenced by transportation constraints. These constraints are a result of production growth that has outpaced the growth in pipeline capacity. This has led to Canadian benchmark prices facing higher than normal differentials to global benchmarks. In addition to planned pipeline projects currently underway, wider Canadian benchmark differentials have led to provincial policy responses. This includes Alberta’s crude oil production curtailment, which began in 2019 and has recently been extended through 2020.

Figure 1 shows the EF2019 crude oil assumptions for Brent, West Texas Intermediate (WTI), and WCS. Brent and WTI gradually increase over the projection period, as the global market is expected to increasingly require higher cost resources to meet demand. Growth in prices is gradual due to a robust supply of low cost tight oil putting downward pressure on prices, largely a result of rapid development in the Permian Basin located in the southern United States (U.S.). In the longer term, the Brent price assumption of around 2018 US$75/bbl reflects a level that should adequately balance supply and demand given the baseline Reference Case assumptions of current policy action and moderate technological progress.


Figure 1 Crude oil price assumptions to 2040Figure 1
Description

This figure shows crude oil price assumption to 2040, in 2018$ US/bbl. Brent increases from $65 in 2019 to $75 by 2029, where it remains throughout the projection period. Likewise, WTI increases from $57.5 in 2019 to $71 by 2029, where it remains until 2040. WCS increases from $45.8 in 2019 to 58.5 by 2029, where it remains until 2040

EF2019 assumes that Canadian heavy benchmark price is discounted to WTI at a level that is consistent with the historical average. In the near term, this is driven by Alberta’s curtailment policy, the impact of the International Maritime Organization’s (IMO) 2020 standards[5], and upward pressure on heavy oil prices due to recent outages in Venezuela and U.S. sanctions on Iran. EF2019 assumes that adequate pipeline capacity will become available in western Canada in the early 2020s, based on announced online dates for Enbridge’s Line 3, the TransMountain Expansion (TMX), and Keystone XL projects. The detail for these projects are listed in Table 1 below. The WTI-WCS differential is 2018 US$12.50 for most of the projection.

Table 1: Assumed announced crude oil capacity additions
Enbridge Line 3 Keystone XL TransMountain Expansion
Announced in-service date 2020 2022 2023
Expected date at full capacity 2021 2023 2024
Full capacity (Mb/d) 382 813 528

Note: Project timing assumptions were made early in the analysis phase, and may not reflect latest announcements. For example, recent announcements by Trans Mountain state that the Trans Mountain Expansion Project could be in-service as early as mid-2022.

As discussed in the crude oil results section, additional export capacity could be required as 2040 approaches. Although EF2019 assumes a constant WTI-WCS differential in the latter years of the projection, this additional requirement could put pressure on the differential for reasons discussed in that section.

Figure 2 shows the EF2019 natural gas price assumptions. Henry Hub, the North American benchmark price, declines in the near term, as the market continues to be in a state of over supply that has kept prices low in recent years. A rising long-term price is based on the assumption that demand for North American natural gas–for both domestic use and LNG exports–will bring demand and supply growth into balance. The long-term price assumption gradually rising to 2018 US$4/MMBtu reflects the large gas resources that can be produced around that level across North America.

EF2019 assumes the current wide differentials for Canadian natural gas, measured by the difference between Henry Hub and NIT, continues in the short term. This differential narrows as price signals put downward pressure on production, and capacity constraints are reduced, including potential expansions to the NOVA Gas Transmission (NGTL) system. Over the long term, the Henry Hub-NIT differential remains around 2018 US$0.90/MMBtu as the large resource of low cost natural gas in the Western Canada Sedimentary Basin (WCSB) continues to put downward pressure on prices over the projection.

EF2019 assumes LNG export volumes as shown in Figure 3. These volumes are consistent with the LNG Canada project, which announced a positive final investment decision in October 2018. Other LNG projects have been proposed for Canada, and could be included in future EF reports if more concrete plans develop.

Figure 2 Natural gas price assumptions to 2040Figure 2
Description

This figure shows natural gas price assumption to 2040, in 2018$ US/MMBtu. Henry Hub increases from $2.5 in 2019 to $4.0 by 2040. NIT increases from $1.15 in 2019 to $3.1 by 2040.

Figure 3 Canadian LNG export volume assumptions to 2040Figure 3
Description

Canadian LNG exports are expected to remain close to 0 until 2023 when exports increase to 0.3 bcf/d, reaching 1.84 bcf/d by 2026 where it remain until 2029.  In 2030, LNG exports are expected to increase to 2.3 bcf/d, reaching roughly 3.7 bcf/d by 2032 where it remains until 2040.

Back to Top

Electricity

EF2019 analysis reflects current utility and system operator expectations of future electricity developments in their respective regions, especially for major planned projects. It is also based on assumptions of the cost to add new electricity generating capacity in the future. Table 2 shows assumptions for natural gas, solar, and wind costs, including their capacity factors. The timing and magnitude of other forms of generation added over the projection period (such as hydroelectric and nuclear refurbishments) are based on current schedules and plans from utilities, companies, and system operators.

Table 2: Electricity cost assumptions for natural gas, wind, and solar to 2040
Real, US$ Capital Cost (2018US$/kilowatt(kW)) Fixed Operating and Maintenance Costs  (2018US$/kW) Variable Operating and Maintenance Costs (2018US$/megawatt hour(MW.h)) Capacity Factor (%)[6]
Gas (Combined Cycle) 1 100-1 450 16 4 70
Gas Peaking 800-1 100 14 4 20
Wind (2020) 1 284 20-45 0 35-50
Wind (2030) 1 133 20-45 0 35-50
Wind (2040) 1 000 20-45 0 35-50
Solar (2020) 1 312 16-20 0 10-20
Solar (2030) 1 000 16-20 0 10-20
Solar (2040) 800 16-20 0 10-20

Figure 4 shows additional detail on average wind and solar capital costs, as well as average levelized costs. The levelized cost includes all project costs over its lifetime (operating, fuel, financing, capital costs etc.) along with assumptions about capacity factor and project life. The ranges around the wind and solar figures highlight the variability and importance of these other factors in determining the ultimate cost of the resources.

Figure 4 Wind and solar capital costs and levelized cost[7] assumptions to 2040 Figure 4
Description

This graph shows the ranges of wind and solar capital and levelized costs from 2017 to 2040. In 2018, the average wind and solar capital costs were 1434 and 1317 $2018 USD/Kw, respectively. By 2040 the average capital costs fall to 1000 and 800 $2018 USD/Kw

In 2018, the average wind and solar levelized costs of electricity were 36 and 97 $2018 USD/MW.h, respectively. By 2040 the average levelized costs fall to 29 and 60 $2018 USD/MW.h

Back to Top
  • [3] For example, the proposed Clean Fuel Standard has been announced, but is not included as proposed regulations are currently under development.
  • [4] In June 2019, ECCC released the “Proposed Regulatory Approach for the Clean Fuel Standard.” Proposed regulations for the liquid fuel class of the Clean Fuel Standard are expected to be published for consultation in early 2020. Further details on next steps for gaseous and solid fuel class regulations are available from ECCC.
  • [5] In 2020, EF2019 assumes that the International Maritime Organizations (IMO) sulfur regulations lead to a temporary widening of the WTI-WCS differential at an additional US or C$4/bbl. This represents a global discount for all heavy sour crudes. We assume that this differential shrinks in 2021 to US or C$2/bbl, and US or C$0.5/bbl by 2022.
  • [6] Capacity factors are the actual energy produced by a generator divided by the maximum possible generation over a given period.
  • [7] The range around the capital costs is +/- 20%, which reflects the variability across different estimates of current and future wind and solar costs. The ranges around the levelized costs include the variation in capital costs shown in the figure, ranges in other costs and capacity factors shown in Table 2, as well as higher and lower project financing costs.
Date modified: