ARCHIVED – Chapter 3. Reference and High/Low Price Case Results
This page has been archived on the Web
Information identified as archived is provided for reference, research or recordkeeping purposes. It is not subject to the Government of Canada Web Standards and has not been altered or updated since it was archived. Please contact us to request a format other than those available.
Content
Overview
This chapter focuses on the results of the Reference, High and Low Price Cases. Chapter 4 describes the assumptions and results of the Technology Case.
Detailed data tables supporting the discussion in this Chapter are available in the online EF online data appendices.
Macroeconomic Drivers
The economy is a key driver of the energy system. Economic growth, industrial output, inflation, exchange rates, and population growth all influence energy supply and demand trends. Macroeconomic projections for each of the Cases were provided by Stokes Economics. Stokes Economics developed unique projections of key macroeconomic indicators such as gross domestic product, exchange rate, and industry gross output for each of the Cases, based on the price assumptions and output of the NEB’s supply and demand models.
Key economic variables are shown in Table 3.1. Economic growth averages 1.76% per year over the projection period in the Reference Case.
| Economic Indicator | Compound Average Annual Growth Rate (unless otherwise noted) | |||
|---|---|---|---|---|
| 1990-2016 | Reference Case |
High Price Case |
Low Price Case (2017-2040) |
|
| Real Gross Domestic Product | 2.28% | 1.76% | 1.84% | 1.58% |
| Population | 1.04% | 0.82% | 0.81% | 0.81% |
| Inflation | 1.92% | 1.95% | 1.97% | 1.87% |
| Exchange Rate (average) | 0.81 US/C$ | 0.82 US/C$ | 0.89 US/C$ | 0.75 US/C$ |
Compared to the past 26 years, the pace of economic growth is slower in the Reference Case. Economic growth in the High Price Case is higher than the Reference Case, largely due to an increase in the production of fossil fuels. Similarly, economic growth is lower in the Low Price Case due to lower production of fossil fuels.
Key Uncertainties
- International demand for Canadian goods: International demand for Canadian goods, the production of which can be energy intensive, impacts export-oriented industries. Faster or slower economic growth in the U.S., Canada’s largest trading partner, would affect the economic and energy demand projections.
- International trade and NAFTA: The renegotiation of the North American Free Trade Agreement (NAFTA) with the U.S. and Mexico was ongoing at the time of EF2018 writing. EF2018 does not incorporate NAFTA’s successor, the United States-Mexico-Canada Agreement, which was ratified at the end of September 2018. EF2018 is based on NAFTA-like conditions prevailing between the three countries in energy trade, energy demand and economic growth. At this time, these economic relationships continue to be the most reliable assumption for the purpose of the EF2018 report.
- Large infrastructure projects: Projects in the mining, oil, natural gas, and electricity sectors affect the macroeconomic projections in a number of provinces. The pace of these developments is uncertain and could lead to higher or lower economic growth, and impact energy trends.
Energy Demand
This section focuses mainly on end-use, or secondary energy demand. Secondary demand excludes energy used to generate electricity, which is accounted for in primary demand. Historical data is sourced primarily from Statistics Canada’s Report on Energy Supply and Demand in Canada. That data is supplemented with additional details from various federal and provincial data sources.
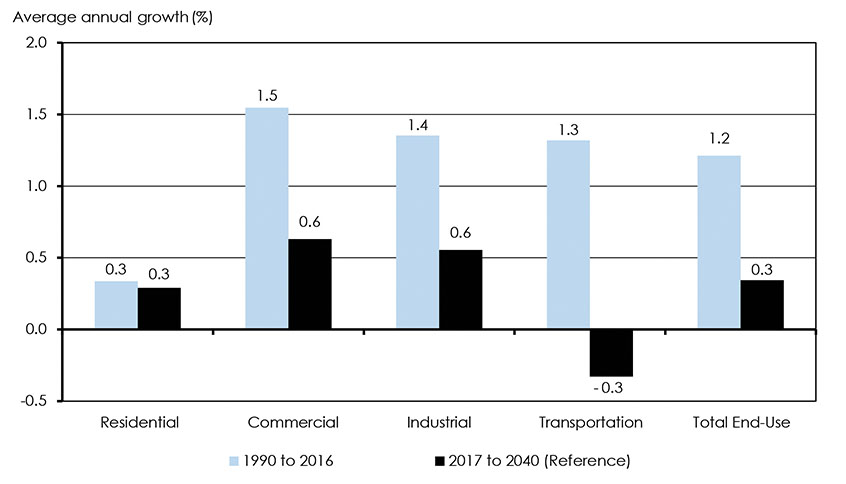
Figure 3.1 shows annual average growth rates of energy use by sector over the past 26 years, and from 2017 to 2040 in the Reference Case. Compared to the 1990-2016 period, when demand grew by an average of 1.2% per year, end-use energy demand growth in the Reference Case is considerably slower over the outlook period, averaging growth of 0.3% per year.
Key Trends: Energy Demand
- Energy use growing slower than history.
- Use of natural gas and renewables increases, coal and oil products decline.
- Energy use per $GDP and per person in Canada declines.
There are several reasons why energy use grows slower than history. Economic activity drives energy use, and as shown in Table 3.1, it is lower than historical levels. The historical trend of Canada becoming a less energy-intensive economy, as measured by energy consumed per unit of GDP, persists over the projection period. Energy efficiency continues to play a role in reducing energy demand growth because less energy is required for new buildings, devices, and equipment. Retail RPP prices, such as gasoline and diesel, continue to rise along with crude benchmark prices, dampening future demand growth. The Pan-Canadian approach for pricing carbon pollution has a downward impact on energy use trends for all fossil fuels. Several other policies, programs, and regulations affect energy use in the projection period.
Figure 3.1: Historical and Projected Average Annual Growth in End-Use Energy Demand by Sector, Reference Case
Description
This chart shows historical and projected average annual growth in end-use demands, by sector, for the Reference Case. End-use demand growth from 1990 to 2016 averaged 0.3% in the residential sector, 1.5% in the commercial sector, 1.4% in the industrial sector, and 1.3% in the transportation sector. Total historical end-use demand averaged 1.2%. End-use demand growth from 2017 to 2040 averages 0.3% in the residential sector, 0.6% in the commercial sector, 0.6% in the industrial sector, and -0.3% in the transportation sector. Total end-use demand from 2017 to 2040 averages 0.3%.
In the Reference Case, total end-use demand increases by 0.3% per year over the projection period, reaching 12 368 PJ by 2040. The price Cases see differences in demand, driven mainly by the energy needed to fuel variations in oil and gas production trends. In the High Price Case, end-use demand increases to 12 805 PJ by 2040; in the Low Price Case, it declines to 11 676 PJ by 2040.
Residential and Commercial
Residential energy use is the energy consumed by Canadian households. The commercial sector is a broad category that includes offices, stores, warehouses, government and institutional buildings, utilities and pipelines, communications, and other service industries. The residential sector made up 13% of total end-use demand in 2017, while the commercial sector consumed 12%.
Figures 3.2 and 3.3 show annual average growth rates of energy use for the residential and commercial sectors over the projection period.
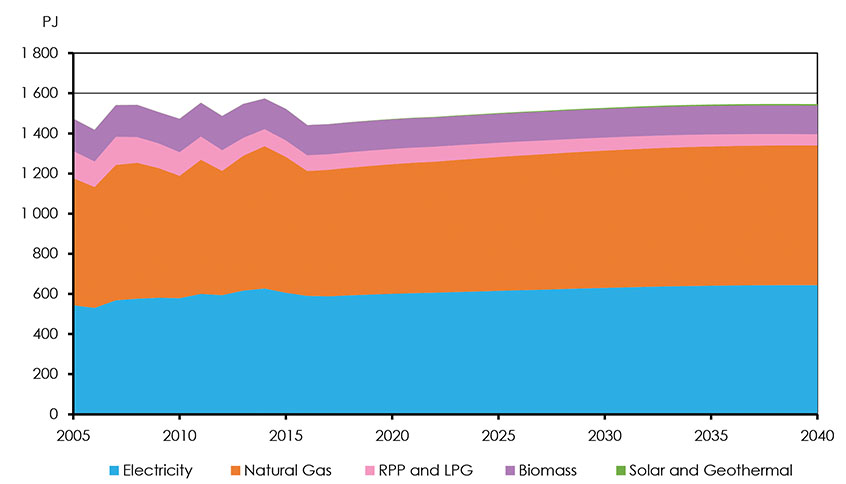
Figure 3.2: Canadian Energy Demand, Residential
Description
This chart shows Canadian energy demand growth, in PJ, for the residential sector, from 2005 to 2040. Biomass demand decreased from 160.5 PJ in 2005 to 149.6 PJ in 2017, and continues to decrease, reaching 142.2 PJ by 2040. Electricity demand increased from 543.6 PJ in 2005 to 588.1 PJ in 2017, and continues to increase, reaching 643.8 PJ by 2040. Natural Gas demand decreased from 633.2 PJ in 2005 to 630.3 PJ in 2017, but increases from 2017 level, reaching 696.2 PJ by 2040. RPP and LPG demand declined from 135.7 PJ in 2005 to 77.6 PJ in 2017, and continues to decline, reaching 56.0 PJ by 2040. Solar and Geothermal demand was 0 PJ in 2005, increasing to 0.4PJ in 2017 and continues to increase, reaching 7.3 PJ by 2040. Other energy source demands were 1.4 PJ in 2005, decreasing to 0.27PJ in 2017. By 2040, Other energy source demands increase to 0.30 PJ.
In the Reference Case, energy use in the residential sector increases from 1 445 PJ in 2017 to 1 545 PJ in 2040. This corresponds to an average growth rate of 0.3% over the projection period, similar to the historical growth. In the Reference Case, energy use in the commercial sector grows 0.6% per year on average over the projection period, a significant reduction compared to the 1.5% growth observed historically.
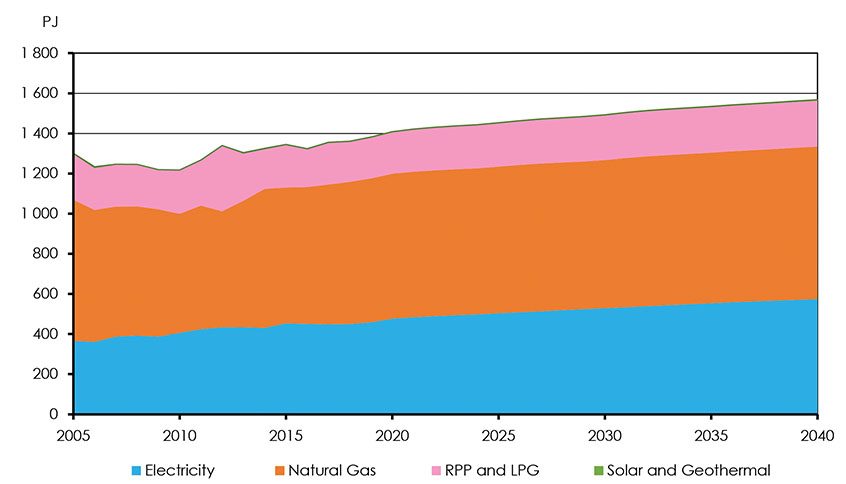
Figure 3.3: Canadian Energy Demand, Commercial
Description
This chart shows Canadian energy demand growth, in PJ, for the commercial sector, from 2005 to 2040. Biomass demand increased from 0.02 PJ in 2005 to 0.48 PJ in 2017, and continues to increase, reaching 0.50 PJ by 2040. Electricity demand increased from 366.2 PJ in 2005 to 447.7 PJ in 2017, and continues to increase, reaching 573.2 PJ by 2040. Natural Gas demand decreased from 703.0 PJ in 2005 to 696.9 PJ in 2017, but increases from 2017 level, reaching 760.3 PJ by 2040. RPP and LPG demand declined from 231.6 PJ in 2005 to 209.8 PJ in 2017, but increases from 2017 levels, reaching 228.9 PJ by 2040. Solar and Geothermal demand was 0 PJ in 2005, increasing to 0.12 PJ in 2017 and continues to increase, reaching 4.12 PJ by 2040. Other energy source demands were 0 PJ in 2005, increasing to 0.69 PJ in 2017. By 2040, Other energy source demands increase to 0.85 PJ.
Over the projection period, combined residential and commercial energy use per square foot of floor space decreases by 1.4% per year, compared to the historical decline of 1.1%. These efficiency gains further support the trend of declining energy use per household over the projection period. As a result, while population grows by 20% over the projection period, residential energy demand increases by only 6%.
Industrial
The industrial sector includes manufacturing, forestry, fisheries, agriculture, construction, mining, and oil and natural gas extraction. The industrial sector made up 53% of total end-use demand in 2017. Additionally, natural gas demand makes up almost 44% of all industrial demand in 2017.
The economic outlooks of the various industries drive industrial energy demand projections. Industrial growth is linked to the demand for goods consumed domestically, but also those exported internationally due to Canada’s trade-oriented economy.
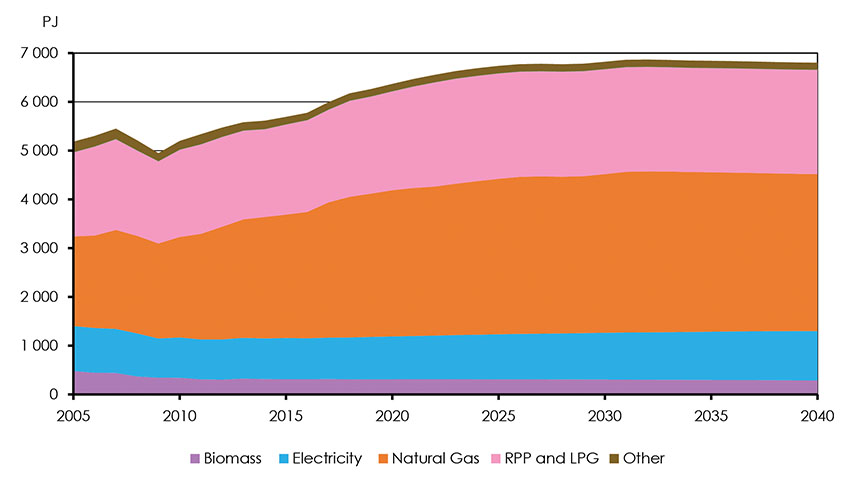
In the Reference Case, industrial demand grows steadily in the early part of the projection, driven mainly by increases in oil sands production. As this production growth slows in the 2020s, industrial demand growth flattens out, reaching 6 802 PJ in 2040, or 0.6% per year on average over its 2017 level. Figure 3.4 shows industrial energy use trends by fuel in the Reference Case.
Figure 3.4: Industrial Energy Demand by Fuel, Reference Case
Description
This chart shows Canadian energy demand growth, in PJ, for the industrial sector, from 2005 to 2040. Biomass demand decreases from 479.6 PJ in 2005 to 315.5 PJ in 2017, and continues to decrease, reaching 285.6 PJ by 2040.Electricity demand decreased from 923.0 PJ in 2005 to 850.2 PJ in 2017, but increases from 2017 levels, reaching 1015.6 PJ by 2040. Natural Gas demand increased from 1838.9 PJ in 2005 to 2773.7 PJ in 2017, and continues to increase, reaching 3216.7PJ by 2040. RPP and LPG demand increased from 1736.1 PJ in 2005 to 1913.8 PJ in 2017, and continues to increase, reaching 2151.4PJ by 2040. Solar and Geothermal demand is 0 PJ from 2005 to 2040. Other energy source demands were 205.3 PJ in 2005, decreasing to 139.6 PJ in 2017. By 2040, Other energy source demands decrease to 133.5 PJ.
In 2040, Industrial demand in the High Price Case is over 6% higher than the Reference Case, while the Low Price Case is over 10% lower than the Reference Case. These differences are largely due to the changes in the oil and gas production trends between the Cases. In the High Price Case, energy demand for these sectors is 20% higher than the Reference Case in 2040. In the Low Price Case, it is 30% lower than the Reference Case in 2040.
Figure 3.5 emphasizes how energy demand in the oil and gas sector is quite responsive to the alternate price Cases. Energy use in the other industrial sectors is less responsive to the differences in oil and natural gas price. In the other industrial sectors, higher prices put downward pressure on demand, while lower prices lead to higher levels of energy use.
Figure 3.5: Oil and Natural Gas Sector and Other Industrial Energy Demand, All Cases
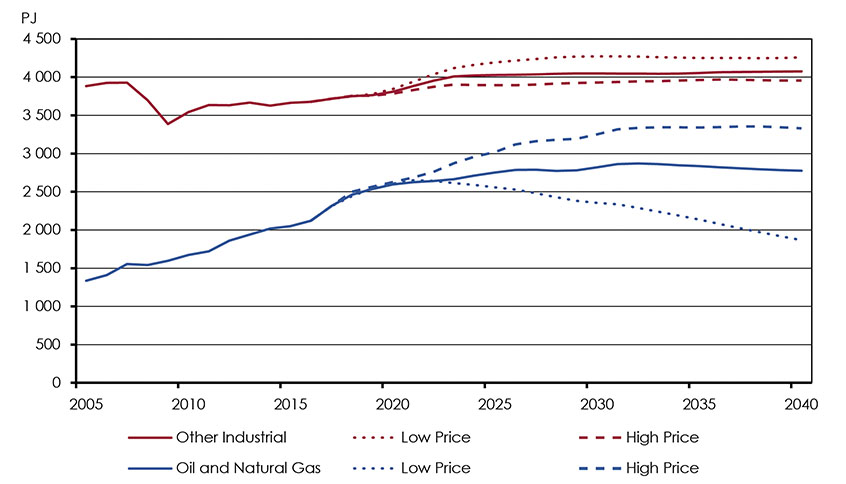
Description
This chart compares the energy demand, in PJ, of the oil and natural gas sector, to the other industrial sector, for all cases. Oil and natural gas energy demand increased from 1335 PJ in 2005 to 2312 PJ in 2017. By 2040, energy demand in the oil and natural gas sector increases to 2776 PJ in the Reference Case, while reaching 3331 PJ in the High Price Case, and decreasing to 1866 PJ in the Low Price Case. Other industrial energy demand decreased from 3884 PJ in 2005 to 3717 PJ in 2017. By 2040, energy demand in the other industrial sector increases to 4075 PJ in the Reference Case, while reaching 3955 PJ in the High Price Case, and 4258 PJ in the Low Price Case.
Transportation
The transportation sector includes passenger and freight on-road transportation, as well as air, rail, marine, and non-industrial off-road travel, such as recreational all-terrain vehicles and snowmobiles. The transportation sector made up 23% of total end-use demand in 2017. After increasing steadily for the past 26 years, transportation demand declines slowly over the projection period, from 2 620 PJ in 2017 to 2 430 PJ in 2040.
Figure 3.6 shows passenger and freight transportation demand projections to 2040. At 1 404 PJ, passenger transportation was 53% of total transportation demand in 2016 while freight made up 42% with 1 080 PJ and off-road made up 5% with 115 PJ. Passenger demand declines to 1 156 PJ in 2040. Freight transportation remains relatively flat throughout the outlook, increasing slightly to 1 130 PJ, leading the way for a convergence of passenger and freight shares of transport demand around 47%. Off-road travel demand increases to 143 PJ in 2040, where its share of transport demand rises to 6%.
Figure 3.6: Passenger and Freight Transportation Demand
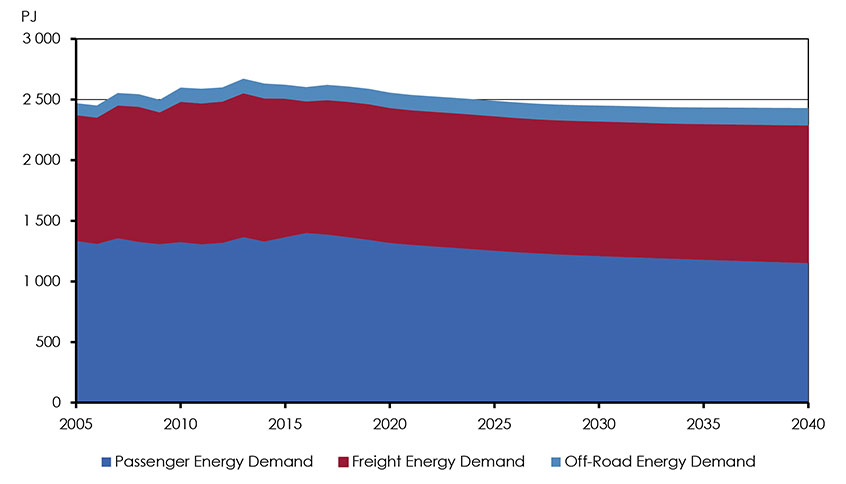
Description
This chart shows Reference Case passenger, freight, and off-road transportation demand, in PJ, from 2005 to 2040. Passenger energy demand in 2005 was 1339 PJ, increasing to 1391 PJ in 2017. By 2040, passenger energy demand declines to 1156 PJ. Freight demand was 1033 PJ in 2005, increasing to 1104 PJ in 2017. By 2040, freight demand reaches 1131 PJ. Off-Road energy demand was 99 PJ in 2005, increasing to 126 PJ in 2017. By 2040, off-read energy demand reaches 143 PJ.
In addition to the effect of rising transport costs emerging from higher carbon and energy prices, several other factors exert downward pressure on transport demand over the projection period. The primary reason is vehicle emissions standards. Canada enacted passenger vehicle GHG emission standards that extend from 2012 to 2025, and more recently GHG emission standards for medium and heavy-duty vehicles. Both standards mandate fuel economy improvements in vehicles sold in their respective periods, reducing fuel demand. Macroeconomic factors influencing transportation demand, such as GDP, population, and income, generally grow slower than historical levels, as discussed earlier. A modest uptake in electric vehicles (EVs) also contributes to demand reductions because of the relative efficiency of EVs to internal combustion engine (ICE) vehicles. The Technology Case, discussed in Chapter 4, provides an analysis of greater EV adoption.
Primary Demand
In this analysis, primary demand is the total amount of energy used in Canada. In addition to end-use demand, it includes the energy required to generate electricity. Primary demand is calculated by adding the energy used to generate electricity to total end-use (or secondary) demand, and then subtracting the end-use demand for electricity.
In the Reference Case, primary energy demand increases at an average annual rate of 0.2% over the projection period, reaching 14 201 PJ in 2040.
As shown in Figure 3.7, the share of natural gas increases the most, a result of natural gas use for power generation and in oil sands production. Coal’s share of primary demand falls considerably due to declining coal-fired power generation.
Figure 3.7: Primary Energy Demand, Reference, High Price and Low Price Cases
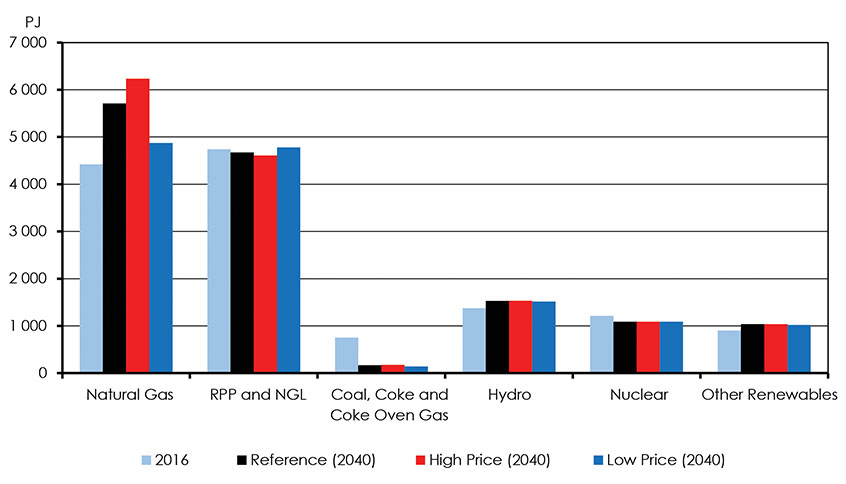
Description
This chart compares primary energy demand, in PJ, for the Reference, High Price and Low Price Cases, by fuel, for 2016 and 2040. In 2016, natural gas demand was 4420 PJ. By 2040, natural gas demand increases to 5709 PJ in the Reference Case, 6235 PJ in the High Price Case, and decreases to 4874 PJ in the Low Price Case. In 2016, RPP and NGL demand was 4742 PJ. By 2040, RPP and NGL demand decreases to 4675 PJ in the Reference Case, 4609 PJ in the High Price Case, and increases to 4779 PJ in the Low Price Case. In 2016, coal, coke and coke oven gas demand was 754 PJ. By 2040, coal, coke and coke oven gas demand decreases to 166 PJ in the Reference Case, 176 PJ in the High Price Case, and 144 PJ in the Low Price Case. In 2016, hydro demand was 1374 PJ. By 2040, hydro demand increases to 1528 PJ in the Reference Case, 1534 PJ in the High Price Case, and 1517 PJ in the Low Price Case. In 2016, nuclear demand was 1214 PJ. By 2040, nuclear demand decreases to 1087 PJ for all cases. In 2016, other renewables demand was 900 PJ. By 2040, other renewables demand increases to 1037 PJ in the Reference Case, 1039 PJ in the High Price Case, and 1022 PJ in the Low Price Case.
Differences in primary demand in the Reference and Price Cases are driven mainly by the natural gas used to fuel variable oil and gas production trends. In the High Price Case, increased oil and gas activity drives primary energy demand to 14 680 PJ, 3.3% above Reference Case levels. In the Low Price Case, lower activity reduces primary demand to 13 423 PJ, 8.6% lower than Reference Case levels. Energy intensity, measured as energy use per unit of economic activity, declines steadily in all three Cases.
Key Uncertainties
- Technological influences: The impacts of technology on the energy system can be substantial and often difficult to predict. EF2018 Reference Case assumes modest growth of emerging technologies. However, the Technology Case, discussed in Chapter 4, explores this uncertainty by analyzing the impact of a greater uptake of a selection of emerging technologies on the energy system.
- Oil and natural gas industry transformations: In recent years, the oil and natural gas industry has undergone rapid transformations in both the types of resources extracted and the technologies used to extract them. Depending on the future development of these resources and technologies, the energy used in this sector may be higher or lower than these projections. The most notable example of this would be the trend of the steam to oil ratio (SOR) for in situ oil sands development, which will have a substantial effect on future natural gas demand in Alberta.
- The mining sector: Mining introduces significant uncertainty to the energy demand projections. The development of a variety of announced projects can be uncertain due to market developments. Energy requirements for mines also vary on a project-by-project basis creating additional uncertainties, particularly for electricity demand in regions where mining is a significant portion of economic activity.
- Climate policies: Several measures are announced but are currently in initial stages of development, such as the proposed Canadian Clean Fuel Standard. These could impact energy trends as they are implemented. Likewise, small or large changes to existing policies, or changes in policy direction, could also impact the trends shown in the Reference Case projections. For example, there is potential for the Canada’s projected automobile emission standards to change as it reviews its current light duty vehicle standards and the proposed heavy duty standards, which would impact transportation demand projections .
Crude Oil Production
Canada produces crude oil for domestic refining as well as for exports. In 2017, Canadian crude oil production averaged over 4.4 million barrels per day (MMb/d) (693 thousand cubic metres per day (103m3/d)). Over the first five months of 2018, this number rose by over 6% to 4.64 MMb/d (738 103m3/d) as new oil sands facilities began producing for the first time and output from conventional oil plays continued increasing after two years of declines.
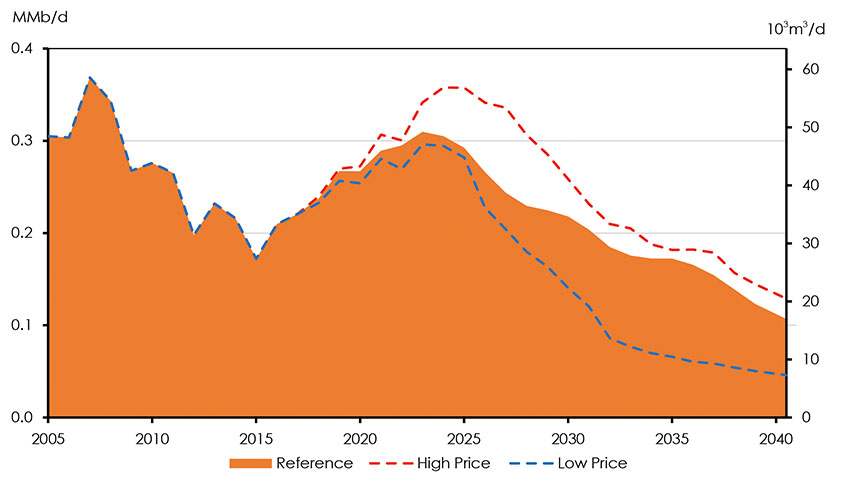
By 2040 Canadian crude oil production in the Reference Case is 6.9 MMb/d (1 098 103m3/d) . This is 58% higher than 2017 levels of 4.4 MMb/d (693 103m3/d) . Figure 3.8 shows crude oil production by type in the Reference Case and total production in High and Low Price Cases.
Key Trends: Crude Oil Production
- Crude oil production increases over 50% from 2017 by 2040.
- Growth in oil sands largely due to expansions of existing facilities.
- Global and benchmark prices, takeaway capacity, and technology are key uncertainties.
Figure 3.8: Total Canadian Crude Oil and Equivalent Production, Reference, High Price and Low Price Cases
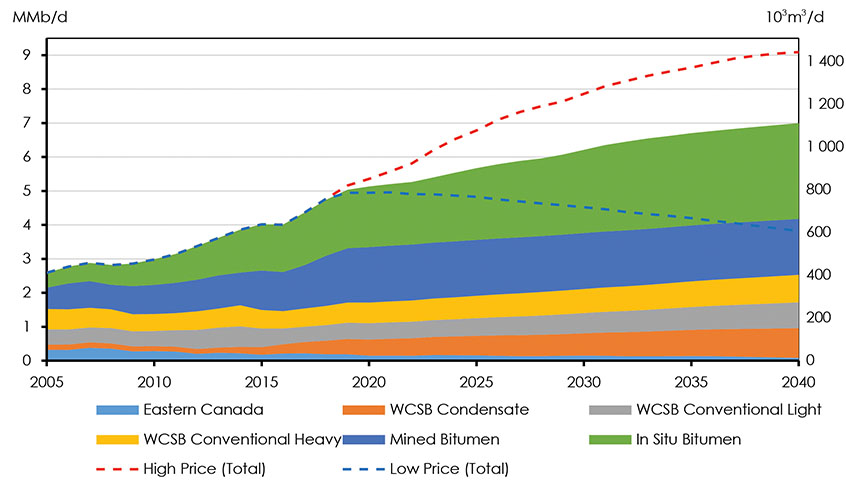
Description
This chart shows total Canadian crude oil and equivalents production, in MMb/d, for the Reference, High Price, and Low Price Cases, from 2005 to 2040. Eastern Canada production decreased from 0.3 MMb/d in 2005 to 0.2MMb/d in 2017, and continues to decline, reaching 0.08 MMb/d by 2040. WCSB condensate production increased from 0.2MMb/d in 2005 to 0.3 MMb/d in 2017, and increases to 0.9 MMb/d by 2040. WCSB conventional light production in 2005 and 2017 was 0.5 MMb/d, which increases to 0.8 MMb/d by 2040. WCSB conventional heavy production declined from 0.6 MMb/d to 0.5 MMb/d in 2017, and increases to 0.8 MMb/d by 2040. Mined bitumen production increased from 0.6 MMb/d in 2005 to 1.3 MMb/d in 2017, and increases to 1.7 MMb/d by 2040. In-situ bitumen production increased from 0.4 MMb/d in 2005 to 1.6 MMb/d in 2017, and increases to 2.8 MMb/d by 2040. Total production in the Reference Case increases to 7 MMb/d by 2040, compared to 9.1 MMb/d in the High Price Case, and production decrease to 3.8 MMb/d in the Low Price Case.
In the High Price Case, total oil production reaches 9.1 MMb/d (1 446 103m3/d) by 2040, 30% higher than in the Reference Case. Total oil production in the Low Price Case decreases over the projection period and at 3.8 MMb/d (607 103m3/d) in 2040 is 45% lower than the Reference Case.
Crude Oil Ultimate Potential and Established Reserves
Table 3.2 shows Canada’s remaining ultimate potential and established crude oil reserves. At 329 billion barrels (BBL) (52.3 billion cubic metres (109m3)), Canada’s remaining ultimate potential is considerable. Of this, 92% are found within the bitumen resources of the oil sands. The remaining share is from conventional, tight and shale oil deposits elsewhere in Canada, both onshore and offshore.
When a company can demonstrate that a resource can be recovered economically, that resource becomes a reserve. Canada’s reserves are very large, at 170 BBL (27 109m3). This is because so much of the resource is located within the oil sands, where the reservoir and extraction techniques are relatively well understood. Almost 55% of oil sands resources are considered reserves. The ratio of resources to reserves in the rest of Canada range from 32% in the western Canadian sedimentary basin (WCSB) to less than 1% in northern Canada.
| WCSBNote a | Eastern Canada | Northern Canada Note b | Oil Sands | Canada Total | |
|---|---|---|---|---|---|
| Remaining Ultimate PotentialNote c | |||||
| 106m3 | 1 358 | 1 069 | 1 644 | 48 193 | 52 264 |
| Billion Barrels | 9 | 7 | 10 | 303 | 329 |
| Remaining Established ReservesNote c | |||||
| 106m3 | 440 | 260 | 8 | 26 284 | 26 992 |
| Billion Barrels | 3 | 2 | 0 | 165 | 170 |
Oil Sands
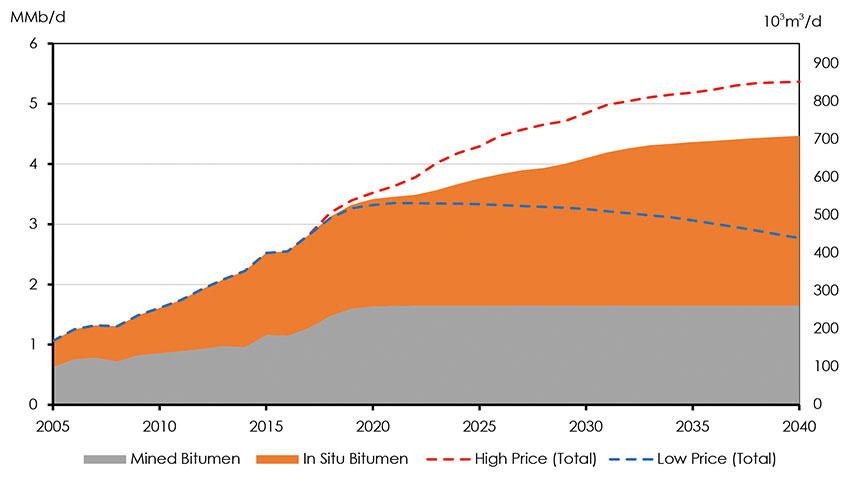
Raw bitumen production hit a record high 2.8 MMb/d (449 103m3/d) in 2017 as projects sanctioned before the 2014 to 2016 crude oil price decreased came online and other existing projects increased their output through technological and efficiency improvements. Figure 3.9 shows oil sands production for the Reference, High and Low Price Cases over the projection period. In the Reference Case, oil sands production reaches 4.5 MMb/d (710 103m3/d) by 2040 which is 58% higher than current output.
Growth in oil sands production is largely due to expansions of existing in situ facilities with comparatively less coming from new projects. Overall in situ production increases 82% by 2040 compared to 2017. While there are no new mining projects assumed to be constructed over the projection period, expansions of producing mines are expected to lead to a 29% increase in mined bitumen output by 2040.
Figure 3.9: Oil Sands Production, Reference, High Price and Low Price Cases
Description
This chart shows oil sands production for the Reference, High Price, and Low Price Cases, from 2005 to 2040. In 2005, Reference Case in-situ bitumen production was 0.4 MMb/d, increasing to 1.6 MMb/d in 2017, and 2.8 MMb/d by 2040. Mined bitumen production increases from 0.6 MMb/d in 2005 to 1.3 MMb/d in 2017, and 1.7 MMb/d by 2040. Total oil sands production in the Reference Case increases to 4.5 MMb/d by 2040, compared to 5.4 MMb/d in the High Price Case, and a decrease to 2.8 MMb/d in the Low Price Case.
In the High Price Case, total bitumen production reaches 5.4 MMb/d (853 103m3/d) by 2040. In situ production increases steadily and significantly in this Case, reaching 3.5 MMb/d (553 103m3/d) by 2040, 125% higher than in 2017. As a result of cost inflation in the oil industry that would likely be associated with the high oil prices in this Case, no new mines are constructed. Mining production, however, does increase by 48% from 2017 levels through expansion of existing facilities. Total production in the Low Price Case increases in the near term, peaking at 3.4 MMb/d (533 103m3/d) in 2021 as projects currently under construction are completed and brought online. Output in this Case falls thereafter as the low oil price is insufficient to incent companies to invest in new projects to offset declines in existing projects. Production by 2040 reaches 2.8 MMb/d (440 103m3/d), nearly identical to 2017 levels.
Gradual technological and efficiency improvements are assumed to occur at both mining and in situ projects over the course of the projection. For the Reference, High, and Low Price Cases major breakthroughs, such as the employment of steam displacement or partial upgrading technologies, are not taken into account. Impacts of improved technology are explored in Chapter 4.
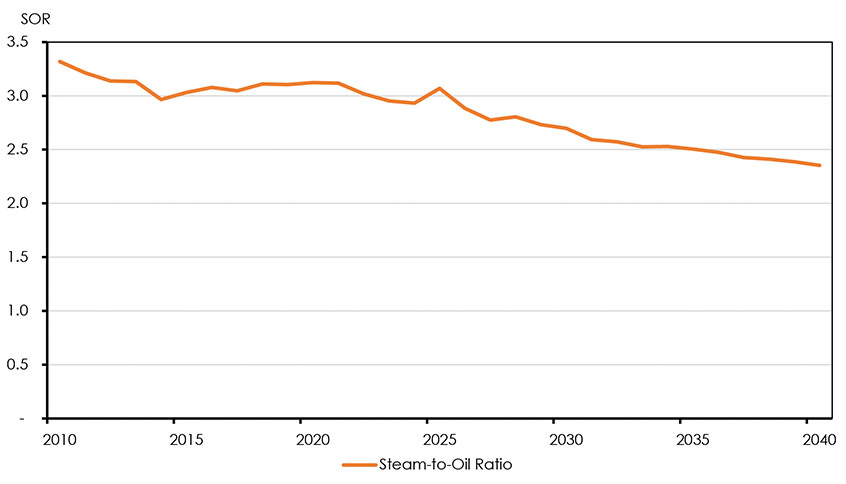
SOR represents the amount of steam required to produce one barrel of bitumen from an in situ well. SOR is a way to measure the environmental performance of oil sands projects. Figure 3.10 shows the average historical and projected SOR for all in situ projects in the Reference Case. Improvements in the way the steam is generated and the moderate adoption of steam displacement techniques over the course of the projection period lead to steady improvements in SOR. In the medium term there is a slight increase in SOR as new projects are brought online. By 2040 the industry average SOR is expected to fall 25% to 2.4.
Figure 3.10: Steam to Oil Ratios, Reference Case
Description
This chart shows the steam to oil ratios for the Reference Case from 2010 to 2040. The steam to oil ratio decreased from 3.32 in 2010 to 3.05 in 2017, and declines to 2.4 by 2040.
Western Canadian Conventional Crude Oil
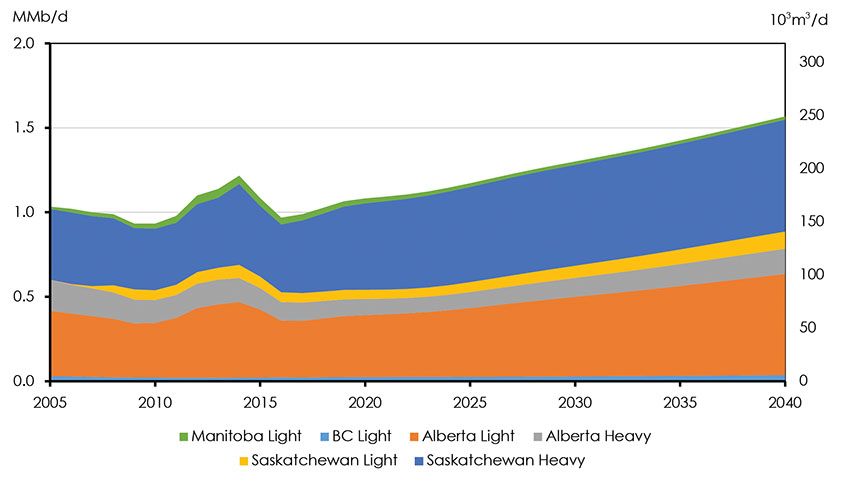
Total production of conventional oil in western Canada was 0.99 MMb/d (157 103m3/d) in 2017, accounting for 23% of all crude oil produced in Canada. Conventional production is classified as light or heavy, depending on the API gravity of the oil. In 2017, 54% of western Canadian conventional production was heavy, 46% was light. Figure 3.11 shows total conventional production in western Canada over the projection period.
Figure 3.11: Conventional Oil Production by Type, Reference Case
Description
This graph Canadian conventional oil production from 2005 to 2040 in the Reference Case. Total production in 2005 was 164.27 103m3/d and the majority of production was made up by Alberta light oil and Saskatchewan heavy oil. By 2040 total production increases to 249.20 103m3/d, with most of the increase coming from Saskatchewan heavy oil.
Alberta light and Saskatchewan heavy make up the majority of conventional production through the projection period in the Reference Case. At 0.60 MMb/d (95 103m3/d), Alberta light accounts for 29% of total western conventional crude production by 2040. Saskatchewan heavy production, reaching 0.66 MMb/d (105 103m3/d) by 2040, represents 32%. Figure 3.11 shows conventional oil production for the Reference Case over the projection period.
Heavy oil production growth in Saskatchewan is a result of the application of steam assisted gravity drainage (SAGD) production techniques to heavy oil fields. Similar to the oil sands, production from these thermal projects does not exhibit the steep decline rates typical of other conventional heavy oil wells. This contributes to the attractiveness of this type of production, leading to steady growth over the projection period.
After declining in 2016 due to low oil prices, production of light conventional oil, including condensate, rebounded to reach 0.77 MMb/d (126 103m3/d) in 2017. Lower prices over the last three years lead to essentially flat production in the first five years of the projections. After 2022, production begins to rise and by 2040 is 1.2 MMb/d (193 103m3/d) in the Reference Case.
In the High Price Case, total conventional oil production, including condensate, reaches 3.4 MMb/d (533 103m3/d) by 2040. In this case, higher crude oil prices are enough to more than offset field declines from existing wells. Conversely, in the Low Price Case cumulative production from existing wells declines faster than it can be replaced by newer wells and total production falls to 0.76 MMb/d (120 103m3/d).
Condensate
Nearly all the condensate produced in Canada comes from B.C. and Alberta. Condensate comes primarily from natural gas wells and is removed from the gas stream either at the well head or at processing plants before the gas is sent to its intended market. Once removed, the condensate is used in a number of industrial processes, most notably as a diluent for bitumen and heavy oil.
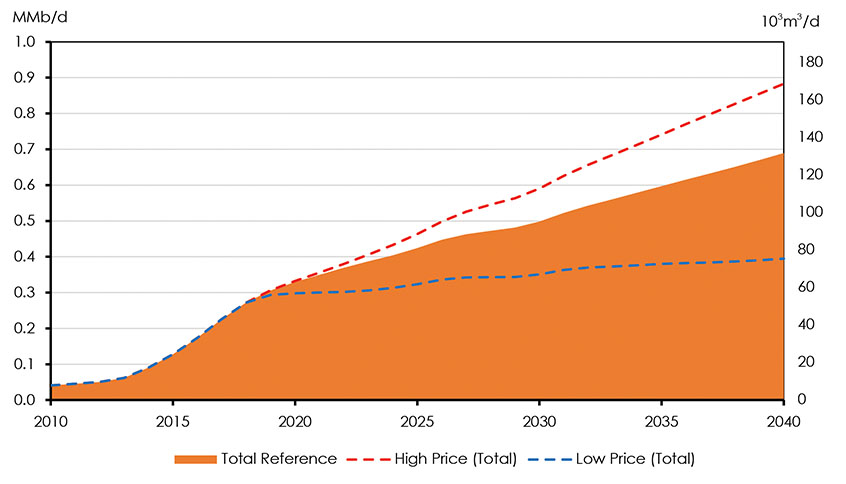
Figure 3.12 shows condensate production projections in western Canada for the three Cases. Currently, the majority of condensate production comes from Alberta with the remainder coming from B.C. Operators’ continued focus on liquids-rich natural gas plays like the Montney and Duvernay lead to substantial growth in condensate production in the projection period. Total production grows 205%, reaching 0.7 MMb/d (110 103m3/d) by 2040. Alberta continues to produce the majority of condensate over the projection period. Higher natural gas drilling in the High Price Case leads to significantly higher condensate output and production climbs to 0.9 MMb/d (140 103m3/d) by 2040, 291% higher than in 2017. In the Low Price Case, production grows 75% from current levels, reaching 0.4 MMb/d (63 103m3/d) by 2040.
Figure 3.12: Western Canada Condensate Production Reference, High Price and Low Price Cases
Description
This graph shows condensate production in British Columbia and Alberta from 2010 to 2040 under the Reference, High and Low Price Cases. In 2005 total condensate production in Alberta and British Columbia was 22.46 103m3/d and this increases to 109.62 103m3/d in 2040 in the Reference Case. In the High and Low Price Cases, condensate production in 2040 is 140.44 and 62.76 103m3/d respectively.
Newfoundland Offshore
Offshore production in the Reference Case increases in the near term as Hebron continues to ramp up and new wells from existing facilities are brought online. Production peaks at 309 Mb/d (49 103m3/d) in 2023 and declines through the projection thereafter, reaching 107 Mb/d (17 103m3/d) in 2040. A new offshore discovery is assumed to add production in 2028, with a second new discovery in 2034. Figure 3.13 shows Newfoundland’s oil production in the Reference, High and Low Price Cases over the projection period.
Hebron is the only project in Newfoundland’s offshore that produces heavy oil. Other projects produce either light or medium grade oil. The new discoveries included in the Reference and High Price Cases are assumed to be light oil. Heavy oil currently makes up 21% of Newfoundland’s production and this proportion reaches as high as 50% within the projection period.
In the High Price Case new offshore production facilities are assumed to be constructed, supported by the increased price of crude oil. There are five fields of various sizes, two in the 2020s and three in the 2030s. Production in the High Price Case peaks at 358 Mb/d (57 103m3/d) in 2024 and falls steadily thereafter reaching 129 Mb/d (21 103m3/d) in 2040. In the Low Price Case there are no new discoveries assumed and production reaches a high of 296 Mb/d (47 103m3/d) in 2023 and falls to 56 Mb/d (7 103m3/d) by 2040.
Figure 3.13: Newfoundland Oil Production, Reference, High Price and Low Price Cases
Description
This graph shows Newfoundland’s oil production from 2005 to 2040 under the Reference, High and Low Price Cases. Total production in 2005 was 48 103m3/d and by 2040 this declines to 17, 21 and 7 103m3/d under the Reference, High Price and Low Price Cases respectively.
Crude Oil Supply and Demand Balance
All non-upgraded bitumen and nearly all conventional heavy oil must be blended with lighter hydrocarbons to reduce its viscosity and allow it to flow on pipelines. Bitumen that is transported by rail is generally blended as well, although sometimes at lower levels than for pipelines. The resulting blend of produced crude oil or bitumen, after accounting for production losses and any diluent recycling, is the net oil supply available for domestic and foreign markets.
Domestic disposition is the volume of Canadian crude oil that is required for feedstock at Canadian refineries. This volume is influenced by a number of factors such as refined product demand and the amount of foreign oil that is processed within Canada. Economics at any particular refinery dictate whether that facility uses Canadian or foreign oil to produce the refined petroleum products needed to meet Canadian demand.
Exports of crude oil are the difference between the net available oil supply and the domestic disposition.
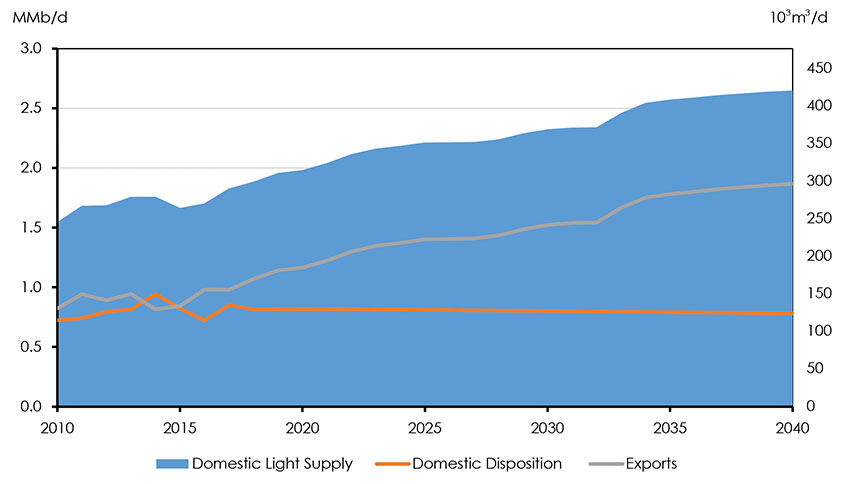
Figure 3.14: Supply and Demand Balance, Light Crude Oil, Reference Case
Description
This graph shows Canada’s light crude oil supply and demand balance in the Reference Case from 2010 to 2040. Domestic light oil supply increases from 245.74 103m3/d in 2010 to 421.04 103m3/d. Exports increase from 130.77 103m3/d in 2010 to 296.85 103m3/d in 2040. Domestic disposition increases from 114.97 103m3/d in 2010 to 124.19 103m3/d in 2040.
Exports of light crude oil grow throughout the projection period in the Reference Case, along with rising conventional light oil production. Figure 3.14 shows the supply and demand balance of light crude oil in the Reference Case over the project period. Exports reach 1.87 MMb/d (297 103m3/d) in 2040. Exports increase sharply in 2033 as a number of in situ facilities are assumed to redirect their bitumen output to be processed through upgraders instead of being marketed as diluted bitumen.
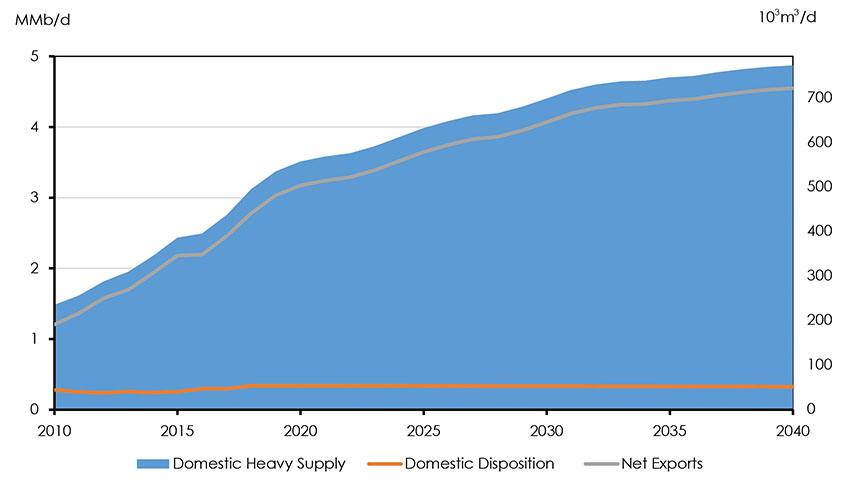
Figure 3.15: Supply and Demand Balance, Heavy Crude Oil, Reference Case
Description
This graph shows Canada’s heavy crude oil supply and demand balance in the Reference Case from 2010 to 2040. Domestic heavy oil supply increases from 235.83 103m3/d in 2010 to 774.62 103m3/d. Exports increase from 191.49 103m3/d in 2010 to 723.05 103m3/d in 2040. Domestic disposition increases from 44.34 103m3/d in 2010 to 51.57 103m3/d in 2040.
Exports of heavy crude oil rise throughout the projection period in the Reference Case, reaching 4.55 MMb/d (723 103m3/d) by 2040, 85% above 2017 levels. The increase is primarily because of increased blended bitumen production from new and expanded in situ projects and mining operations. Increases in conventional heavy oil also contribute to the increase. Figure 3.15 shows the supply and demand balance of heavy crude oil in the Reference Case over the projection period.
Key Uncertainties
- Future oil prices: Oil prices are a key driver of future Canadian oil production and a key uncertainty to the projections in EF2018. Oil prices could be higher or lower depending on demand and policy trends, technological developments, geopolitical events, and differentials between benchmark prices as discussed in Chapter 2.
- Thermal recovery techniques: The application of these techniques to Saskatchewan’s heavy oil resources is a recent trend. Though promising, the impact of these techniques on future production growth is uncertain.
- The pace of technological development in the oil sands: EF2018 assumes gradual technological improvement in the sector and a more or less rapid technology development could impact the oil sands production projections. Potential advances that could change the supply projections include solvent-based processes, other steam-reduction technologies, and electrification.
- Potential partial upgrading facilities: The Alberta government has recently announced its intention to encourage construction of partial upgrading facilities in the province. This program could affect result in higher prices for producers for a few reasons. Partially upgraded bitumen does not need to be mixed with diluent to flow in pipelines, which would reduce the costs of buying diluent like condensate. Without diluent, the total volume shipped would fall and ease congestion. Pipeline bottlenecks would improve and fewer barrels of oil would need to be shipped by rail, which is more expensive. Meanwhile, partially upgraded bitumen has a higher quality than non-upgraded bitumen, and would As such, it could receive a higher price, but it would have to compete with similar quality crudes for limited refining capacity, which potentially limits the benefits to producers.
Natural Gas Production
Canadian natural gas is produced for use domestically, as well as exported to the U.S. Canadian marketable natural gas production averaged 15.6 billion cubic feet per day (Bcf/d) or 442 million cubic metres per day (106m3/d) in 2017 and 16.2 Bcf/d (460 106m3/d) over the first half of 2018.
Natural gas production in the Reference Case declines early in the projection period, reaching a low of 15.9 Bcf/d (450 106m3/d) in 2021. After 2021, production begins to increase as gradually higher prices encourage enough drilling to offset production declines from older wells, and development associated with assumed LNG exports support increased capital spending. This leads to more natural gas wells and production in the WCSB. By 2040, production increases to 20.9 Bcf/d (593 106m3/d).
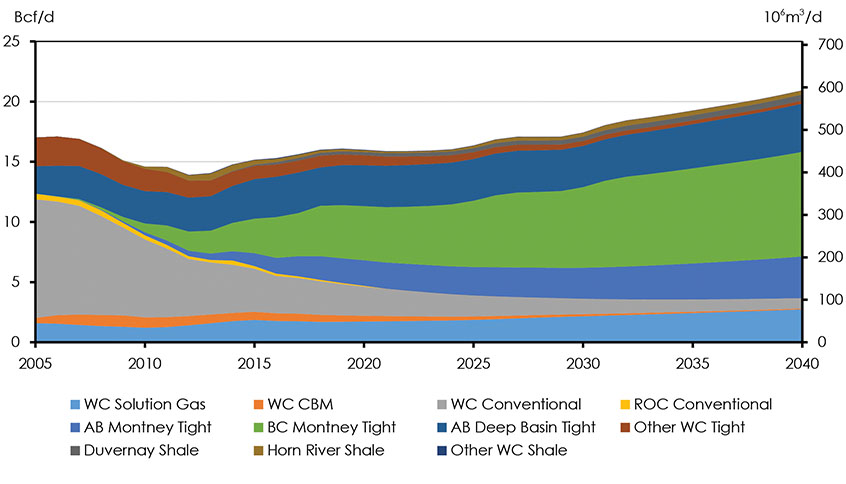
Figure 3.16 shows total Canadian natural gas production by type in the Reference Case. Production from the Montney Formation, a large resource located in northeast B.C. that extends into northwest Alberta, has grown significantly over the past five years. Production of tight gas from the Montney increased from no production prior to 2006 to 34% of total Canadian natural gas production in 2017, almost 5.3 Bcf/d (149 106m3/d). The majority of production growth over the projection period comes from the Montney, with production reaching 12.1 Bcf/d (344 106m3/d) in 2040, a 131% increase from 2017.
Key Trends: Natural Gas Production
- Natural gas production declines in the near term due to lower prices.
- Production increases in the long term with assumed price increases and LNG exports.
- Majority of the production growth comes from the Montney formation.
Figure 3.16: Natural Gas Production by Type, Reference Case
Description
This graph shows natural gas production by type from 2005 to 2040 in the Reference Case. Total production in 2005 was 473.29 106m3/d and this increases to 592.79 106m3/d in 2040.
The Alberta Deep Basin–a tight gas play which runs along the Alberta foothills–produced 3.4 Bcf/d (95 106m3/d) in 2017. Production grows modestly as natural gas and NGL prices increase, reaching 4.0 Bcf/d (114 106m3/d) by 2040 in the Reference Case.
The Duvernay and Horn River shale gas plays currently produce small amounts of natural gas, and production from both grows modestly over the projection period. The Duvernay is an emerging shale play in Alberta that contains natural gas, NGLs, and crude oil. The Horn River play lacks NGLs, reducing its attractiveness compared to other areas. Combined, production from the two plays increases from 0.5 Bcf/d (14 106m3/d) in 2017 to 0.9 Bcf/d (24 106m3/d) by 2040 in the Reference Case.
Production from conventional and coalbed methane natural gas resources–which do not rely on horizontal drilling and multi-stage hydraulic fracturing–declines steadily over the projection period as new drilling targeting these resources is not economic given the natural gas price assumptions in EF2018. Western Canadian conventional non-tight production, which made up 61% of total production in 2007 and 23% in 2017, falls to 4% in 2040 in the Reference Case.
Solution gas is steady over the projection period, following the trends in projected conventional oil production. Solution gas accounted for 11% of total production in 2017, which increases to 13% in 2040, from 1.8 Bcf/d (50 106m3/d) to 2.7 Bcf/d (78 106m3/d) in 2040 in the Reference Case.
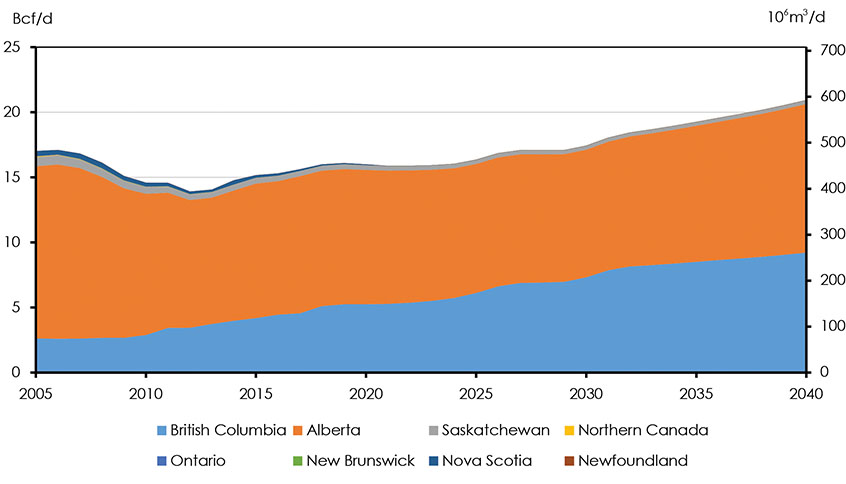
Figure 3.17: Natural Gas Production by Province, Reference Case
Description
This graph shows Canadian natural gas production by province from 2005 to 2040 in the Reference Case. Total production in 2005 was 481.96 106m3/d and this increase to 592.74 106m3/d in 2040. Nearly all of this production comes from Alberta and British Columbia, in 2040 production in these provinces reaches 323.11 and 261.16 106m3/d respectively.
Figure 3.17 shows natural gas production by province in the Reference Case. Natural gas production in eastern Canada continues to decline over the projection period. Onshore natural gas production in New Brunswick falls to near zero by 2040. Offshore natural gas production in Nova Scotia declines steadily and is terminated in December 2020 as production ceases for both the Sable and Deep Panuke, whose declining production renders them uneconomic by that time.
Figure 3.18 shows total Canadian natural gas production in the Reference, High and Low Price Cases. Natural gas production in the High Price Case averages 26.7 Bcf/d (755 106m3/d) in 2040, or 27% higher than the Reference Case. Western Canada’s significant resource base, coupled with higher prices, encourages more drilling activity throughout the projection period. Canadian production in the Low Price Case declines until 2025 when assumed LNG exports reverse this trend. After 2025, production is relatively flat, reaching 12.6 Bcf/d (355 106m3/d) by 2040, 40% lower than the Reference Case.
Figure 3.18: Canadian Natural Gas Production, Reference, High Price and Low Price Cases
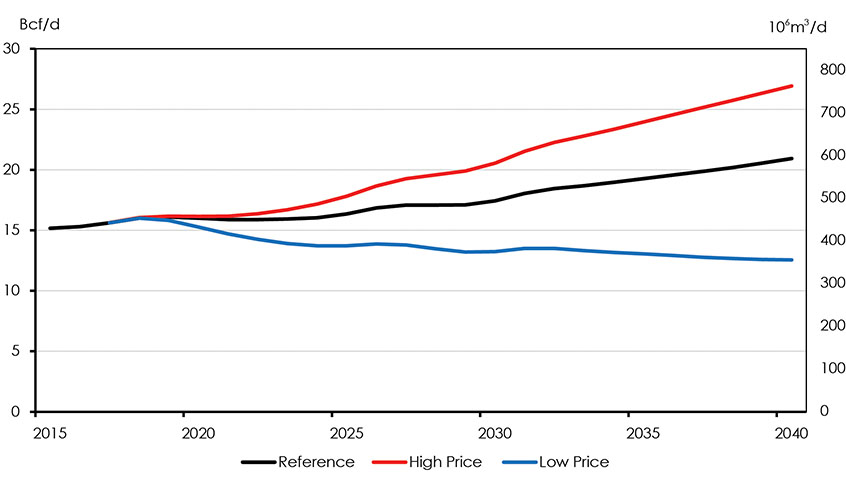
Description
This graph shows total Canadian natural gas production from 2015 to 2040 in the Reference, High Price and Low Price Cases. Total production in 2015 was 429.56 106m3/d and increases to 592.79 106m3/d in the Reference Case. In the High Price Case production increases to 762.63 106m3/d and in the Low Price Case production decreases to 355.37 106m3/d.
LNG
As outlined in Chapter 2, the analysis in EF2018 assumes LNG exports start in 2025. Exploration and development spending associated with LNG exports support higher capital expenditure above what it would otherwise be. This leads to more natural gas wells and production in the WCSB. This LNG export assumption is the same for all CasesFootnote 13.
Net Natural Gas Exports
Natural gas exports have increased over the last few years, mostly due to exports into the western U.S. going from 7.4 Bcf/d (210 106m3/d) in 2015 to 8.2 Bcf/d (233 106m3/d) in 2017. Imports have remained modest over the last decade, hovering around 2 Bcf/d (55 106m3/d). Imports could potentially rise as pipeline capacity increases out of the Appalachian Basin in the northeast U.S. into Dawn, Ontario. The difference between exports and imports is net exports, which has increased slightly over the last few years.
Projected net pipeline exports shown in Figure 3.19 is Canadian production less Canadian demand Footnote 14. Near to mid-term Canadian natural gas demand growth leads to shrinking net exports. As production ramps up after 2023, production growth starts to outpace demand growth and net exports rise. LNG exports contribute to growth in net exports beginning in 2025.
Figure 3.19: Natural Gas Production, Demand, Assumed LNG Exports and Net Pipeline Exports
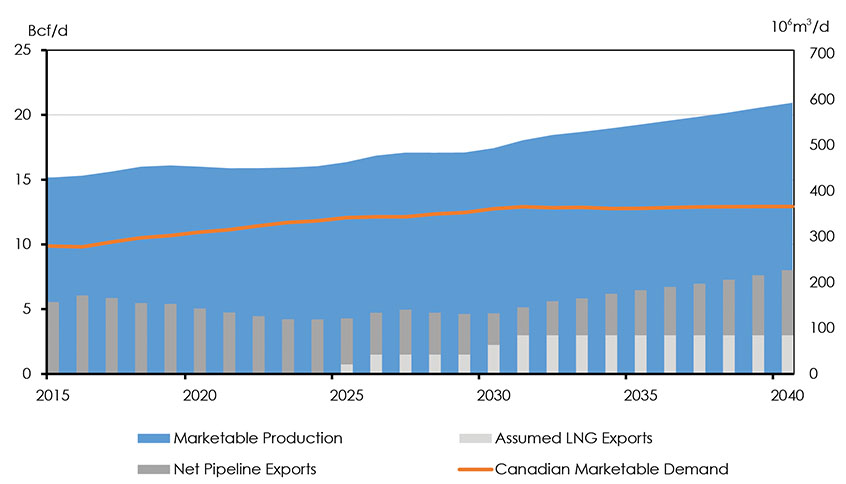
Description
This graph shows natural gas production, demand assumed LNG exports and net pipeline exports from 2015 to 2040 in the Reference Case. From 2015 to 2040 Marketable production increases from 429.56 106m3/d to 592.79 106m3/d. Demand increases from 279.66 106m3/d to 365.91 106m3/d. LNG exports increase from 0 to 84.95 106m3/d. Net exports decrease from 157.01 106m3/d to 141.93 106m3/d.
Key Uncertainties
- Future natural gas prices: The High and Low Price Cases show how production could change given large price differences from the Reference Case. Prices could be different than assumed in any of these Cases, which would lead to different production results.
- Canadian natural gas discounts: This analysis assumes that over the long term, all energy production will find markets and infrastructure will be built as needed. Extended differentials for Canadian natural gas relative to Henry Hub could reduce gas production in the longer term.
- LNG exports: It is possible that global market conditions and the costs of commissioning a new LNG export facility or phase may change in the future, influencing the future prospects of LNG exports in Canada.
Natural Gas Liquids Production
NGLs are predominantly produced from processing natural gas, but some are also produced as a by-product of oil refining or bitumen upgrading. Raw natural gas at a wellhead is comprised primarily of methane, but often contains other hydrocarbons and some contaminants. These other hydrocarbons may include ethane, propane, butanes, condensate and other pentanes. In 2017, 997 Mb/d (159 103m3/d) of NGLs were produced in Canada.
Total NGL production levels off in the near term as gas production slightly declines, but more NGLs per unit of gas produced increases as producers increasingly target areas rich with NGLs, such as the Duvernay shale and Montney tight gas play. NGL production then increases steadily throughout the projections as natural gas production increases. Aggregate NGL production increases by 75% over the projection period, to 1.7 MMb/d (278 103m3/d) in 2040. Figure 3.20 shows total NGL production in the Reference Case.
Figure 3.20: Natural Gas Liquids Production, Reference Case
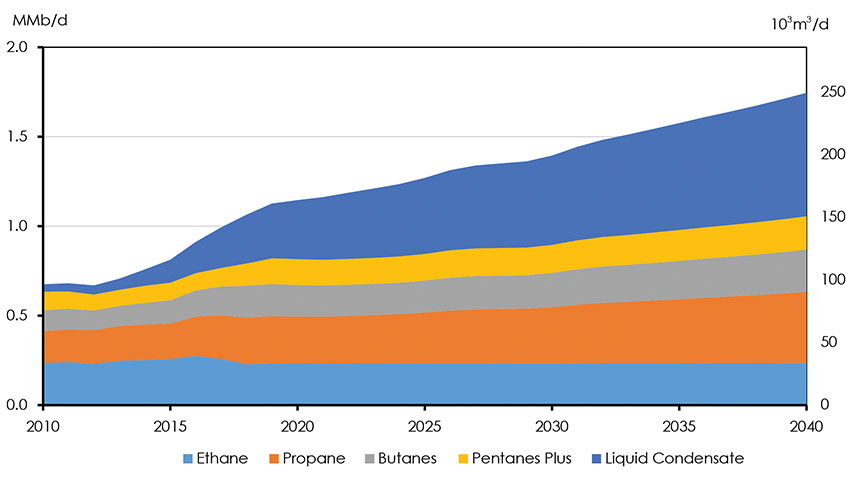
Description
This graph shows total natural gas liquids production from 2010 to 2040 in the Reference Case. Total production increases from 107.42 106m3/d in 2010 to 277.53 106m3/d in 2040. The majority of the increase in production comes from liquid condensate which increases from 6.48 106m3/d in 2010 to 109.63 106m3/d in 2040.
Ethane, the majority of which is extracted at large natural gas processing facilities located on major natural gas pipelines in Alberta and B.C., made up 26% of NGL production in 2017, at 262 Mb/d (42 103m3/d). Ethane production in the Reference Case increases slowly over the projection to 237 Mb/d (38 103m3/d) in 2040, as its recovery from the natural gas stream is assumed to be related to the capacity of petrochemical facilities in Alberta that use it as a feedstock. The remainder of the ethane is reinjected back into the gas stream and sold as natural gas.
Propane production in the Reference Case follows the natural gas production projection. As natural gas production begins to increase, propane production begins to increase steadily, and reaches 397 Mb/d (63 103m3/d) by 2040, 63% higher than 2017 levels of 244 Mb/d (39 103m3/d).
Butanes production follows a similar pattern to natural gas production; 49% higher than 2017 levels by 2040, increasing from 161 Mb/d (26 103m3/d) to 239 Mb/d (38 103m3/d).
Production of pentanes plus is assumed to occur at natural gas processing plants, and does not include liquid condensate from the wellhead. Pentanes plus increases by 79%, from 104 Mb/d (17 103m3/d) in 2017 to 186 Mb/d (30 103m3/d) in 2040.
Liquid condensate is produced at the wellhead, and its demand is growing as oil sands production continues to grow. Condensate is added to bitumen to enable it to flow in pipelines and rail cars. Condensate demand has influenced gas drilling to focus on NGL-rich plays. Condensate production increased over 265% from 2013 to 2017. Of all the NGLs, condensate production grows the most over the projection period, increasing by 205%, from 226 Mb/d (36 103m3/d) in 2017 to 689 Mb/d (110 103m3/d) in 2040.
Petrochemicals
This term refers to chemical compounds that are generally made from oil and gas. Feedstocks derived from oil and gas are used in the production of a wide range of petrochemical products, including plastics and solvents. The six most basic petrochemicals are: ethylene, benzene, propylene, toluene, butadiene, and xylene. These are then used to make petrochemical derivatives which have a wide variety of uses.
There is potential for ethane and propane recovery to increase further if petrochemical production capacity, which uses these liquids as a feedstock, is added. The second phase of the Alberta Petrochemical Diversification Program (PDP II) could provide incentive to increase capacity. This program will provide up to a total of C$500 million of funding to selected applicants announced late 2018 or early 2019.
Key Uncertainties
- Natural Gas: NGLs are a by-product of natural gas production, and as such, any uncertainty discussed in the Natural Gas section is also an uncertainty for these NGL projections.
- Oil Sands: The rate of oil sands production growth, and proportion of bitumen that is partially or fully upgraded, will affect the demand for condensate required for diluent. Likewise, the use of solvents to reduce steam requirements in the oil sands could impact demand for propane and butanes and influence the degree they are targeted by future natural gas drilling.
- LNG composition: The composition of NGLs in LNG varies throughout the world and can be specified in the contracts underpinning a liquefaction facility, the energy content required by the LNG importer, and the gas composition of the feedstock gas used by the LNG exporter. EF2018 does not speculate on the specification of future LNG exports.
- Petrochemical development: There is potential for ethane and propane recovery to increase further if there is an increase in incremental petrochemical capacity requiring either as feedstockFootnote 15. This potential looks most promising in Alberta due to the incentives included in its second phase of the PDP II.
- Global Liquefied Petroleum Gas (LPG) export market: Canada has approved several large-scale facilities to export LPG from B.C.’s coast and it is expected that propane will be the dominate liquid exported. However, these facilities would have the potential to ship butanes and future market developments could present a scenario where butanes is a viable export product. The composition of the LPG stream exported at these terminals could impact domestic NGL prices and the attractiveness of drilling for NGL-rich natural gas.
Electricity Generation
In 2016, installed electricity generation capacity in Canada reached nearly 146 GW. The electricity capacity mix varies significantly among provinces and territories, reflecting the type of energy available, economic viability, and policy choices. Hydroelectricity remains the dominant source of electricity, accounting for 55% of total capacity and 60% of total generation. Natural gas, nuclear, and coal are the most common sources of electricity generation after hydroelectricity, with non-hydro renewables such as wind, solar, and biomass making up the smallest portion of the capacity mix.
In 2016, Canadian electricity demand was 523.4 TW.h and accounted for 17% of total Canadian end-use energy demand. From 1990 to 2016, Canadian electricity demand increased by an average of 1% per year. In the Reference Case, electricity demand increases at an average annual rate of 0.8% over the projection period.
Key Trends: Electricity Generation
- Natural gas and renewable generation added, most nuclear will be refurbished.
- Coal largely phased out.
- Key uncertainties include falling costs of renewables, demand growth, and market developments.
The majority of additions to capacity in the Reference Case are natural gas, wind, and hydro facilities. Figure 3.21 shows the various capacity additions and retirements in the Reference Case. Table 3.3 provides capacity and generation levels and shares in 2017 and 2040.
Figure 3.21: Capacity Additions and Retirements by 2040, Reference Case
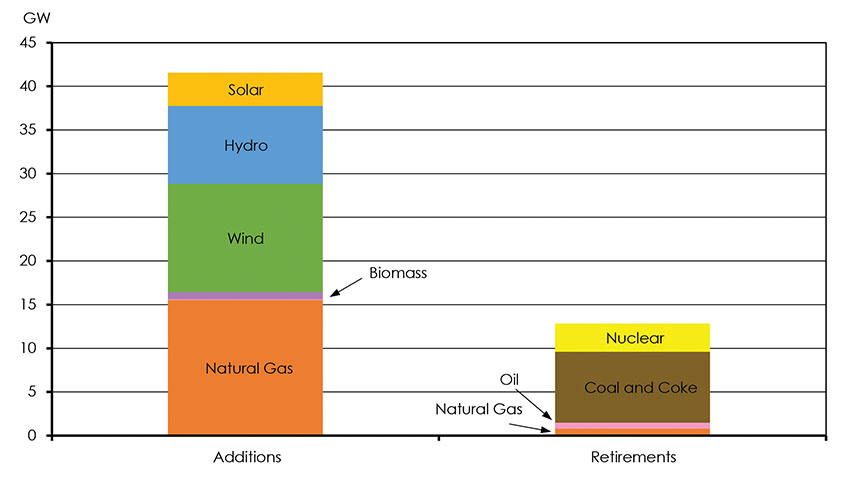
Description
This graph shows electricity generating capacity additions and retirements. From 2016 to 2040 15.52 GW of natural gas, 12.48 GW of wind, 8.9 GW of hydro and 3.83 GW of solar capacity is added. 8.13 GW of coal capacity and 3.24 GW of uranium capacity is retired over the same time period.
| Capacity in GW and % | Generation in GW.h and % | |||
|---|---|---|---|---|
| 2016 | 2040 | 2016 | 2040 | |
| Hydro | 80.4 | 89.3 | 382.0 | 424.7 |
| 55.1% | 51.2% | 59.5% | 59.0% | |
| Natural Gas | 21.5 | 35.9 | 61.4 | 113.9 |
| 14.7% | 20.6% | 9.6% | 15.8% | |
| Coal and Coke | 9.5 | 1.4 | 57.8 | 2.1 |
| 6.5% | 0.8% | 9.0% | 0.3% | |
| Nuclear | 14.3 | 11.1 | 95.4 | 88.6 |
| 9.8% | 6.4% | 14.9% | 12.3% | |
| Wind | 11.9 | 24.3 | 30.3 | 68.6 |
| 8.2% | 13.9% | 4.7% | 9.5% | |
| Solar | 2.3 | 6.1 | 3.2 | 8.5 |
| 1.6% | 3.5% | 0.5% | 1.2% | |
| Biomass | 2.5 | 3.3 | 8.1 | 12.2 |
| 1.7% | 1.9% | 1.3% | 1.7% | |
| Oil | 3.5 | 2.9 | 3.5 | 1.2 |
| 2.4% | 1.7% | 0.5% | 0.2% | |
Outlook by Sources
Hydro
Hydroelectricity remains the dominant source of electricity supply in Canada over the projection period. Hydro has numerous benefits, including flexibility, relative affordability, and lack of GHG emissions at the operation stage. Certain hydro generating stations also have the ability to store water and change their output as needed. This benefit of hydro as a backup supply can also support the development of variable renewable energy resources like wind and solar.
Hydroelectric generating capacity, including small hydro and run of river facilities, increases from 80 GW in 2016 to 89 GW in 2040. This capacity expansion stems from a number of large hydro projects either under construction or in the planning and development phase. Hydroelectric generation is expected to increase from 382 TW.h in 2016 to 425 TW.h in 2040. Over the projection period, hydroelectricity’s share of generation stays steady at about 60%.
Non – Hydro Renewables
Canada has considerable non-hydro renewable resources including wind, biomass, solar, tidal, wave, and geothermal. Over the past few years, policy incentives and declining costs have spurred significant growth in the use of renewable generating technologies. In 2016, Canada had 17 GW of wind, solar, and biomass generating capacity, more than triple the amount in 2010. Most of Canada’s installed wind capacity is located in Ontario, Quebec, and Alberta while the majority of installed solar capacity is located in Ontario.
Non-hydro renewable capacity continues to grow in the Reference Case to nearly 34 GW by 2040, as shown in Figure 3.22. Wind capacity increases from 12 GW in 2016 to 24 GW in 2040, with the majority of new capacity additions coming from Alberta and Saskatchewan. Solar capacity nearly triples from 2.3 GW in 2016 to 6.3 GW in 2040, with most of the growth coming from Ontario and Alberta. Biomass capacity increases from 2.5 GW in 2016 to 3.3 GW in 2040, with growth in Alberta, Quebec, and northern territories.
Figure 3.22: Non-Hydro Renewable Capacity, Reference Case
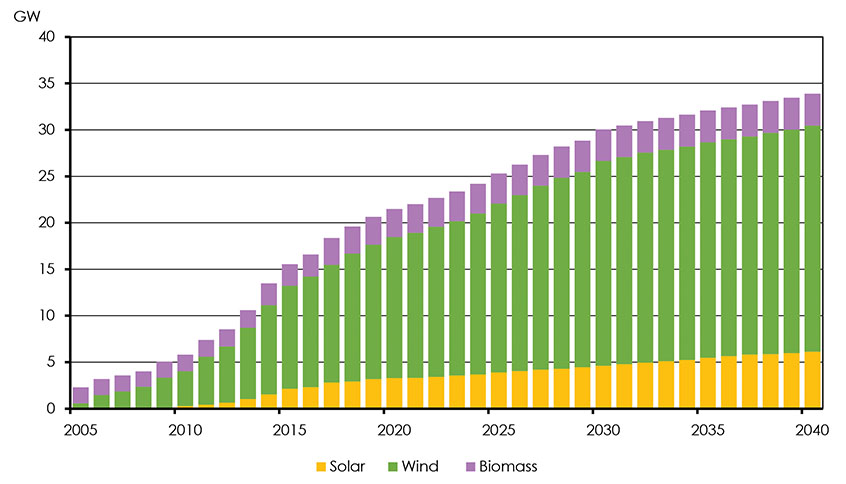
Description
This graph shows non – hydro renewable capacity from 2005 to 2040 in the Reference Case. In 2005 solar, wind and biomass capacity was 0.02, 0.56 and 1.71 GW respectively. In 2040 solar, wind and biomass capacity increases to 6.13, 24.31 and 3.33 GW respectively.
In the Reference Case, generation from renewables is projected to increase from 42 TW.h in 2016 to 89 TW.h in 2040, representing 12% of all electricity generation.
Nuclear
Nuclear power accounted for 15% of Canada’s electricity generation in 2016. Ontario’s three nuclear power plants had a combined capacity of nearly 13 GW in 2016 and generated 58% of the province’s electricity. New Brunswick’s single nuclear power plant generated a third of the province’s power in 2016Footnote 16.
Reference Case nuclear generation declines from 95 TW.h in 2016 to 89 TW.h in 2040. This is due to the shutdown of Ontario’s Pickering Nuclear facility in 2024. Throughout the projection period, nuclear generation is lower than current levels due to outages of several nuclear units in Ontario while refurbishments take place.
Non-emitting generation sources (hydro, nuclear, and renewables) contribute 84% of generation by 2040, compared to about 80% in 2016. The increase is small because large amounts of natural gas-fired generation are added over the projection period.
Coal
Coal-fired generation accounted for 7% of the installed capacity in 2016 and generated 9% of all electricity in Canada. Currently four provinces operate coal power plants: Alberta, Saskatchewan, New Brunswick and Nova Scotia.
Federal regulations apply a strict emission performance standard to units that reach the end of their useful lives, essentially requiring them to be shut down or retrofitted with CCS technology. In 2015, Alberta announced plans to accelerate the phase out of its coal fleet, requiring traditional coal plants to be phased out by 2030. In 2016 the federal government announced its intention to amend its existing coal regulations to also phase out all traditional coal plants by 2030, rather than at the end of their economic lives.
Due to the above policies, coal capacity falls considerably over the projection period. EF2018 assumes equivalency agreements are reached in Saskatchewan, New Brunswick, and Nova Scotia allowing these provinces to maintain some of their traditional coal capacity in place beyond 2030. This capacity is used sparingly over the 2030 to 2040 time frame.
Natural Gas
Natural gas-fired capacity accounted for 15% of total capacity in 2016, with 22 GW installed. Natural gas is used to generate power across all regions of Canada except Prince Edward Island and Nunavut. The majority of natural gas-fired capacity is located in Alberta and Saskatchewan.
Natural gas-fired capacity increases steadily over the projection period. Relatively low fuel prices and capital costs make natural gas a likely option to replace retiring coal units. The increase in natural gas capacity is also linked to the growth of variable renewable energy. The intermittent nature of renewable electricity requires more reliable generation to complement it, and the ability of natural gas plants to quickly increase or decrease generation make it an attractive option. In the reference Case, natural gas capacity increases from 22 GW in 2016 to 36 GW in 2040.
Oil
Oil-fired power plants accounted for 2% of Canada’s total capacity in 2016, and are an important part of the supply mix in some smaller provinces and territories. Oil-fired power plants, which run mostly on diesel, are used to generate power during peak demand periods or in areas where other generation options are not widely available.
Total oil-fired capacity declines from 3.5 GW in 2016 to 3 GW in 2040. This reflects the retirements of aging units which are being replaced by renewable power, natural gas, or LNG-fired units when possible.
Total Generation
In the Reference Case, total Canadian electricity generation increases by over 78 TW.h from 2017 to 2040, an increase of about 12%. Hydro, other renewables, and natural gas lead this growth, while coal and nuclear generation decline. Figure 3.23 shows these trends by fuel type.
Figure 3.23: Generation by Fuel Type, Reference Case
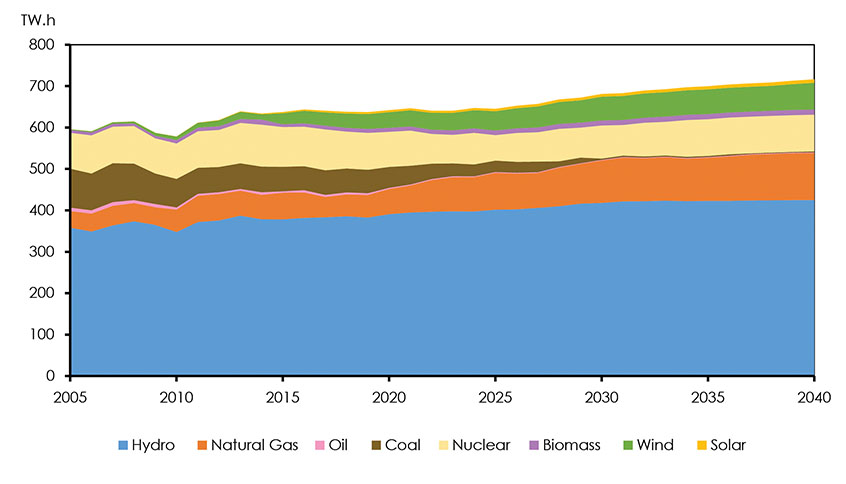
Description
This graph show electricity generation by fuel type from 2005 to 2040 in the Reference Case. In 2005 total generation was 595.8 TW.h and this increases to 719.8 TW.h in 2040. The biggest fuel type is hydro and makes up 424.7 TW.h of generation in 2040.
Electricity Trade
Canada is a net exporter of electricity to the U.S., and large amounts of electricity are also traded between provinces, mainly in eastern Canada. By connecting the electricity grids of different regions, grid operators can take advantage of regional differences in periods of peak electricity demand. Differences in peak demand occur not only on the time of day, but also on the time of year. Seasonal peaks in Canada occur primarily during the winter when demand for heating is high, while peaks in the U.S. occur mostly in the summer to meet air conditioning demand. In the Reference Case, net electricity available for export grows moderately over the projection period, reaching 56 TW.h by 2040 (Figure 3.24). Interprovincial electricity transfers are projected to rise from 47 TW.h in 2005 to 52 TW.h in 2040. EF2018 assumes excess capacity from hydro projects in Labrador, Manitoba, Quebec, and B.C. is available for transfer to meet contractual agreements and open market opportunities.
Figure 3.24: Electricity Trade, Reference Case
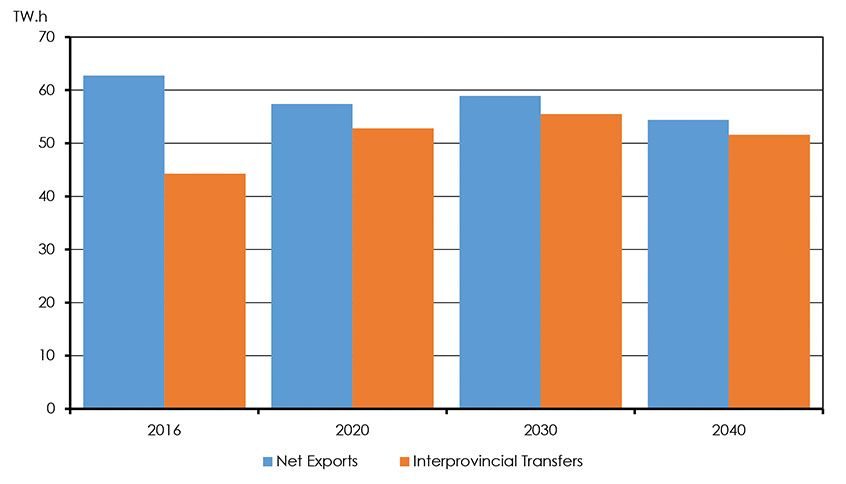
Description
This graph shows electricity trade from 2005 to 2040 in the Reference Case. In 2016 net exports and interprovincial transfers were 62.8 and 44.3 TW.h respectively. In 2040 net exports decrease 54.4 TW.h and interprovincial trade increases to 56.6 TW.h.
Key Uncertainties
- Future capital cost declines of generating facilities: The capital costs associated with different generating technologies is an important factor in determining what type of facilities are built. This is especially true with less commercially mature technologies like wind, solar, and coal with CCS.
- Electricity demand growth: This is important in determining future electricity supply. As a result, the uncertainties identified in the energy demand section are uncertainties that also apply to the electricity supply projections.
- Capacity market developments: Recent capacity market developments in Ontario and Alberta were not modeled in EF2018. At the time of writing, the final structure of the new market from the two provinces has not been announced. However, EF2018 does model electricity build-outs in the same vein as a typical capacity market.
- Future projects and developments: Climate policies, fuel prices, electrification and power sector decarbonization in export markets could impact future projects and transmission intertie developments.
Coal
Total Canadian coal production declined for the third straight year in 2017 to 60.9 million tonnes. Production has generally been trending downward due to declining thermal use in Canada and reduced global prices.
There are two main types of coal produced in Canada, thermal and metallurgical coal. Canadian thermal coal production is linked to the use of coal in the electricity sector, particularly in Alberta, Saskatchewan, and Nova Scotia. Metallurgical coal is primarily used for steel manufacturing domestically and internationally. Much of Canada’s metallurgical coal production is exported and future production trends are linked to global metallurgical coal demand and prices.
Thermal coal accounted for 88% of total Canadian coal consumption in 2017 . In the Reference Case, demand for thermal coal declines by 89% over the projection period, falling from 30.3 million tonnes in 2017 to 3.4 million tonnes in 2040. This declining trend is driven primarily by retirements of coal-fired generation capacity resulting from regulations to phase out traditional coal-fired power plants by 2030.
Domestic demand for metallurgical coal used in steel manufacturing declines from 4.4 million tonnes in 2017 to 3.9 million tonnes by 2040. Global demand for metallurgical coal grows moderately over the projection period, resulting in steady growth in net exports from Canada. Total metallurgical coal production in Canada increases from 29.5 million tonnes in 2017 to 30.5 million tonnes by 2040. Total production declines from 60.9 million tonnes in 2017 to 37.9 million tonnes in 2040.
Figure 3.25 shows Canadian production and consumption of coal in Canada in 2017 and 2040 in the Reference, High and Low Price Cases.
Figure 3.25: Canadian Coal Production and Disposition, Reference, High Price and Low Price Cases
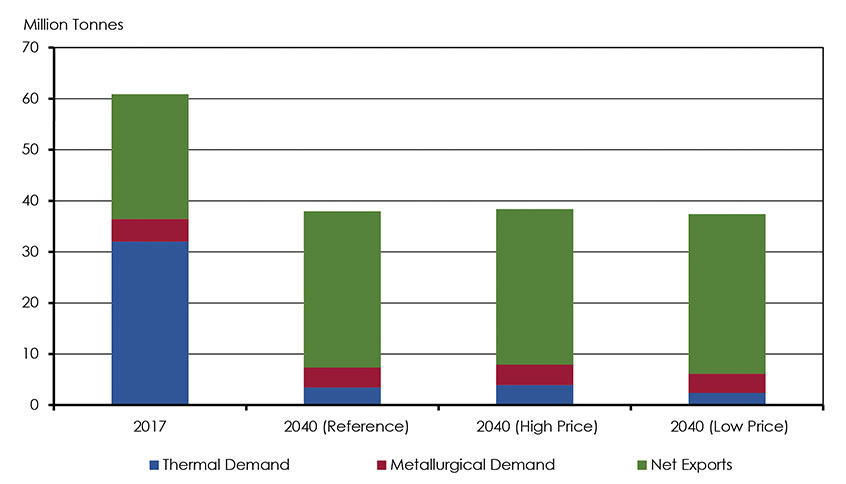
Description
This graph shows Canadian coal production and disposition in 2017 and 2040 in the Reference, High Price and Low Price Cases. In 2017, thermal demand, metallurgical demand and net exports were 32.0, 4.4 and 24.4 MT respectively. In 2040 under the Reference Case, thermal demand, metallurgical demand and net exports are 3.4, 3.9 and 30.6 MT respectively. In 2040 under the High Price Case, thermal demand, metallurgical demand and net exports are 3.9, 4.0 and 30.5 MT respectively. In 2040 under the Low Price Case, thermal demand, metallurgical demand and net exports are 2.4, 3.8 and 31.2 MT respectively.
Key Uncertainties
Prices: Future price movements in the global coal markets are a key uncertainty for Canadian coal exports.
Climate policies: Canadian climate policies, and the climate policies of coal importing countries, could have a significant impact on both Canadian thermal and metallurgical coal production.
GHG Emissions
Currently, energy use and greenhouse gas (GHG) emissions in Canada are closely related. Environment and Climate Change Canada (ECCC) most recent official GHG projections are available through Canada’s National Reports to the United Nations Framework Convention on Climate Change. Footnote 17
The majority of GHGs emitted in Canada are a result of fossil fuel combustion. Fossil fuels provide the vast majority of energy used to heat homes and businesses, transport goods and people, and power industrial equipment. Emissions from fossil fuels, including those used for the production of energy, accounted for 81% of Canadian GHG emissions in 2016. The remaining emissions are from non-energy sources such as agricultural and industrial processes, and waste handling.
In the Reference Case, fossil fuel consumption increases early in the projection period and is relatively flat through the remainder of the outlook. Fossil fuel consumption in 2040 is 4.7% higher than in 2017, and 9.7% higher than in 2005. Figure 3.26 shows the total demand for fossil fuels in the Reference Case.
Figure 3.26: Total Demand for Fossil Fuels, Reference Case
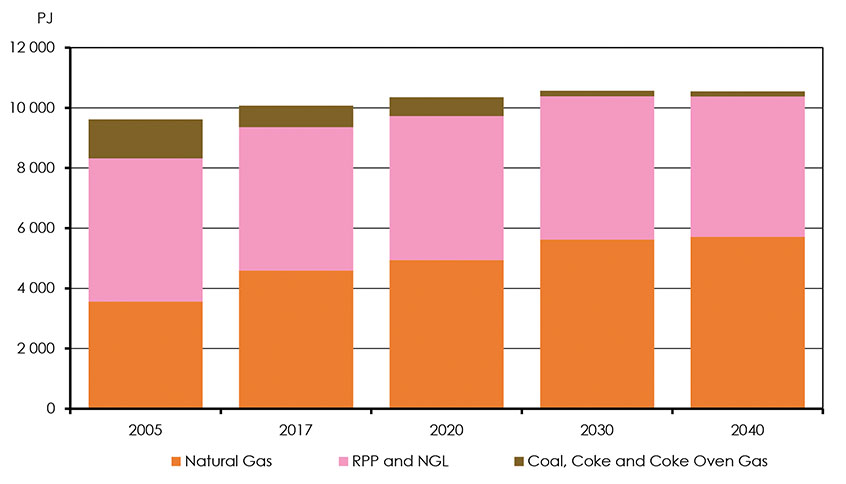
Description
This graph shows total demand for fossil fuels from 2005 to 2040 in the Reference Case. Total fossil fuel demand in 2005 was 9617 PJ and this increases to 10549 PJ in 2040. Natural gas, RPP and NGL and coal, coke and coke oven gas demand in 2040 is 5709, 4675 and 166 PJ respectively.
While total fossil fuel consumption grows in the Reference Case, a changing fuel mix leads to declining GHGs per unit of fossil fuel energy used, as shown in Figure 3.27. Growth in natural gas, coupled with a steep drop in coal, results in GHG intensity declining by 6.3% from 2017 to 2040, or 11.6% from 2005 to 2040. Deployment of CCS technology in power and industrial facilities also reduces the GHG intensity of fossil fuel use. Accounting for reductions in non-combustion emissions, such as reducing methane leaks, as well as including emission credits purchased through international trading mechanisms (like Quebec’s emission trading with California) could further decrease emission intensity.
Figure 3.27: Estimated Weighted-Average GHG Emission Intensity of Fossil Fuel Consumption, Reference Case
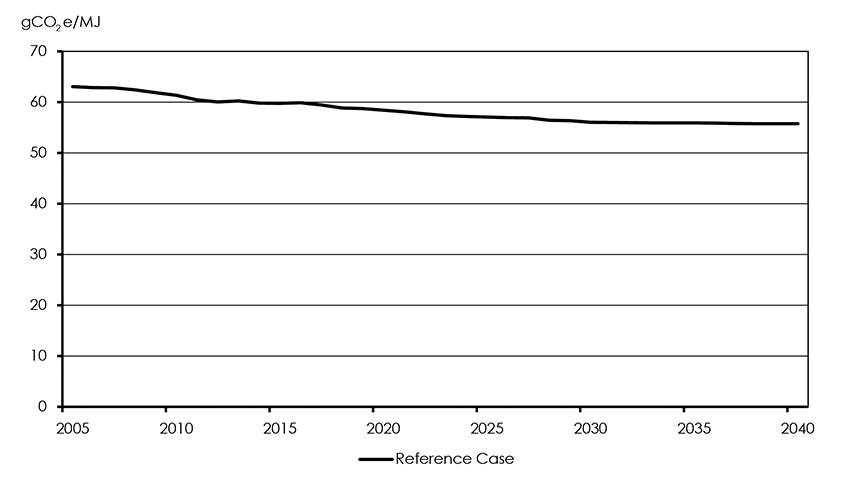
Description
This graph shows estimated weighted average GHG emissions intensity of fossil fuel consumption from 2005 to 2040 in the Reference Case. In 2005 the weighted average GHG emission intensity of fossil fuel consumption was 63.05 gCO2e/MJ. By 2040 this value decreases to 55.74 gCO2e/MJ.
Key Uncertainties
- Technology development: Future adoption of low carbon technologies could alter the course of fossil fuel demands shown here. Increased deployment of technologies such as carbon capture, use and storage, could weaken the link between fossil fuel use and future emission trends.
- Future climate policies: The evolution of climate policies in Canada will be an important factor in fossil fuel combustion trends. Future developments in policies such as carbon pricing, energy and emission regulations, and support for emerging technologies could all alter these fossil fuel projections.
- Date modified: