
Results
On this page:
- Greenhouse gas (GHG) emissions
- Energy demand
- Electricity
- Oil and natural gas production
- Hydrogen
- Negative emissions
- Macroeconomics

This chapter presents results of the EF2023 projections. These projections are not a prediction, but instead illustrate possible futures based on the scenarios and assumptions described in the previous chapter. Many factors and uncertainties will influence future trends. Key uncertainties are discussed in each section of this chapter.
The data supporting this discussion, including full data tables for all three scenarios, is available in the “Access and Explore Energy Futures Data” chapter.
All dollar figures throughout the report are in Canadian dollars unless stated otherwise.
Greenhouse gas (GHG) emissions
In December 2015, most countries in the world, including Canada, adopted the Paris Agreement. The overarching goal of the agreement is to hold “the increase in the global average temperature to well below 2°C above pre-industrial levels” and pursue efforts “to limit the temperature increase to 1.5°C above pre-industrial levels.” These efforts are because the United Nation’s Intergovernmental Panel on Climate Change indicates that crossing the 1.5°C threshold risks far more severe climate change impacts, including more frequent and severe droughts, heatwaves and rainfall. Fundamental to achieving the goal of the agreement is dramatically reducing global GHG emissions.
Canada’s long-term climate goal is reaching net-zero GHG emissions by 2050.Footnote 7 Given that reaching net-zero emissions by 2050 is the central focus of both our net-zero scenarios in EF2023, GHG emission trends are vital to our analysis. Around 80% of Canada’s total emissions are related to the production and consumption of energy, so the GHG emission and energy supply and demand projections in EF2023 are tightly linked.

Which sectors emit the most in Canada? How do emissions change over the projection?
Discover the data for yourself using our interactive visualization tool. View emissions by sector.
Canada’s GHG emission profile
From 2000 to 2019, Canada’s GHG emissions have fluctuated between just below 700 megatonnes (MT) to around 750 MT. In 2020, emissions fell 8% from 2019 levels. Much of this decrease was a result of lower energy use in response to actions to reduce the spread of COVID-19, such as travel restrictions and closing businesses. The decrease in emissions from 2019 to 2020 is the largest drop in emissions recorded over the period for which data is available (1990 to 2021).
In 2021, emissions were 653 MT, or a 1.2% increase from 2020 levels, but 7.3% lower than in 2019. Figure R.1 shows Canada’s GHG emissions in 2021,Footnote 8 categorized by economic sector.Footnote 9
Figure R.1: GHG emissions by economic sector, 2021

Description
Description: This square area chart shows the relative share of GHG emissions by economic sector in 2021. The oil and gas sector emitted 189 MT, transportation 150 MT, buildings 87 MT, heavy industry 77 MT, agriculture 69 MT, electricity 52 MT, and waste & others 47 MT.
Of the sectors in Figure R.1, GHG emissions fell in electricity (-56%), heavy industry (-13%), transportation (-4%), and waste and others (-10%) from 2005 to 2021. GHG emissions increased in oil and gas (+13%), buildings (+2%), and agriculture (+8%) over that same period. Consistent with the past 30 years, about 80% of GHG emissions in 2021 were related to the production and consumption of energy, mostly from the combustion of fossil fuels. The remaining 20% of emissions are from other activities such as agriculture, waste management, and certain industrial processes.
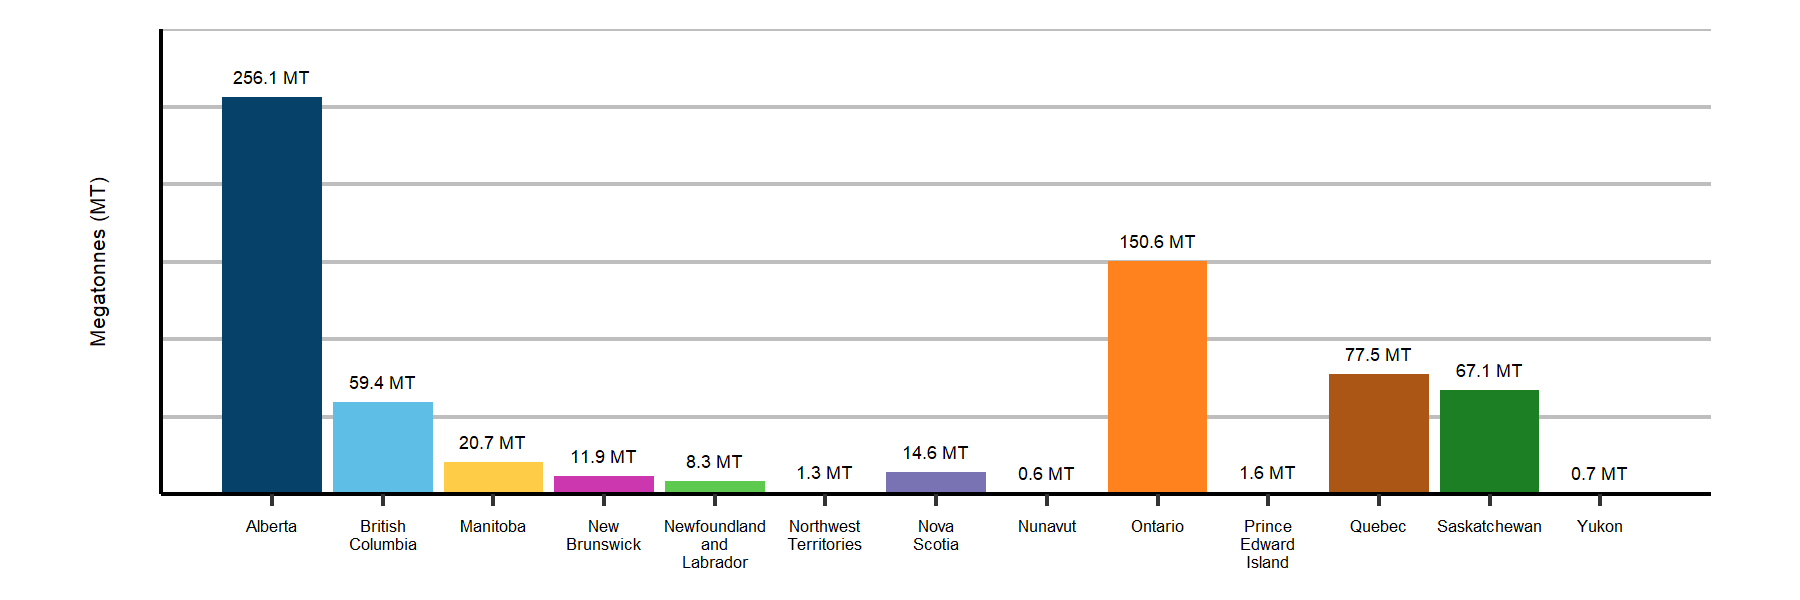
Canada’s GHG emission profile varies significantly among the provinces and territories, as shown in Figure R.2.
Figure R.2: GHG emissions by province and territory, 2021
Description
Description: This column chart shows GHG emissions by province in 2021.
Alberta emits the most, at slightly over 250 MT, followed by Ontario, Quebec, Saskatchewan, and BC.
Detailed data and a more thorough description of Canada’s GHG emission profile can be found in Canada’s National Greenhouse Gas Inventory Report, published by Environment and Climate Change Canada (ECCC).

GHG emission projections
This section provides an overview of our projections of GHG emissions in all three scenarios. The sections that follow explore the energy and GHG emissions trends for the individual segments of the energy system.
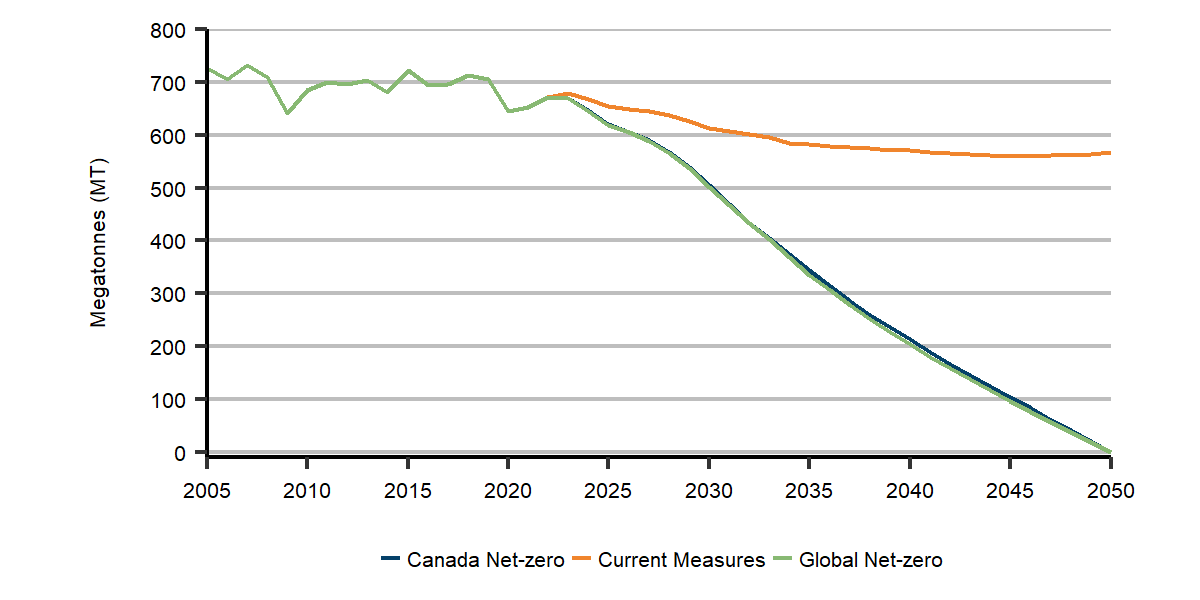
Net economy-wide GHG emissions fall to zero by 2050 in the Global and Canada Net-zero scenarios, which is a predetermined outcome due to the nature of the analysis. Total emission trends are similar in the two scenarios given they share similar climate policy assumptions. In the Current Measures Scenario, we project emissions to be 566 MT by 2050, 13% lower than 2021 levels. This projection of GHG emissions in the Current Measures Scenario only includes policies currently in place during the analysis and does not reflect recently announced policies that are in development. Figure R.3 shows total net emissions in all three scenarios and figure R.4 shows emissions by economic sector in the Global Net-zero Scenario.
Figure R.3: Total GHG emissions, all scenarios
Description
Description: This line chart shows total GHG emissions in all three scenarios.
Emissions increase from 2020 to 2023, and then gradually decline to 0 MT in both net-zero scenarios. Emissions decline modestly throughout the projection period in the Current Measures Scenario.
Figure R.4: GHG emissions by economic sector, Global Net-zero Scenario

Description
Description: This stacked column chart shows the evolution of total sectoral GHG emissions in the Global Net-zero Scenario. The sectors are electricity, hydrogen production, oil and gas, direct air capture, heavy industry, buildings, transportation, LULUCF, and other.
The figure shows that net emissions gradually decline to zero by 2050. Transportation and oil and gas show the steepest decline in the projection period. In the 2040s, electricity, hydrogen production, and direct air capture follow LULUCF in becoming increasingly significant sources of negative emissions.
Which GHG emissions are included in EF2023
Parties to the United Nations Framework Convention on Climate Change (UNFCCC) estimate and report their historical GHG emissions according to guidelines developed by the UNFCCC. This report is referred to as a country’s National Inventory Report (NIR). The UNFCC’s guidelines for calculating GHG emissions aim to make reporting by countries transparent, consistent, comparable, complete, and accurate. ECCC is responsible for preparing and submitting Canada’s national GHG inventory to the UNFCCC.
Each country’s NIR covers emissions (and removals) of GHGs, including carbon dioxide, methane, nitrous oxide, and various other gases that have heat-trapping potential. GHG emissions are calculated as those that occur within a country. For example, if country A produces and exports natural gas to country B, any GHG emissions resulting from producing that natural gas (such as the GHG emissions from facilities that process raw natural gas) are attributed to country A, while emissions related to the combustion of that natural gas are attributed to country B.
The historical GHG emissions that we report in EF2023 align with Canada’s NIR. The latest historical emissions data available is from 2021. The GHG emission projections in EF2023 are estimates resulting from the Energy Futures Modeling System, relying on inputs based on the scenario premise and assumptions we describe in the previous chapter. In various publications, such as the Emission Reduction Plan and Biennial Report to the UNFCCC, ECCC produces the official analysis of Canada’s current emissions outlook and performance against its climate commitments.
In both net-zero scenarios, all sectors have much lower emissions by 2050, compared to 2021 levels. Table R.1 shows the GHG emissions in each sector in 2050, and briefly describes the transformations that occur in each sector.
Table R.1: Change in emissions from 2021 to 2050 by economic sector, and key outcomes, Global and Canada Net-zero scenarios
| Sector | 2021 | 2050 | Key outcomes – Net-zero scenarios | |
|---|---|---|---|---|
| Global Net-zero | Canada Net-zero | |||
| Total | 653 MT | 0 MT | 0 MT |
|
| Buildings | 87 MT | 25 MT | 25 MT |
|
| Heavy industry | 77 MT | 19 MT | 19 MT |
|
| Transport | 150 MT | 15 MT | 14 MT |
|
| Electricity | 52 MT | -37 MT | -36 MT |
|
| Oil and gas | 189 MT | 17 MT | 32 MT |
|
| Low-emitting hydrogen production | 0 MT | -21 MT | -25 MT |
|
| Direct air capture (DAC)Definition* | 0 MT | -46 MT | -55 MT |
|
| Agriculture | 69 MT | 50 MT | 49 MT |
|
| Waste and others (coal production, light manufacturing, construction, and forest resources) | 47 MT | 26 MT | 26 MT |
|
| Land Use, Land-Use Change and Forestry (LULUCF)Definition* | -17 MT | -50 MT | -50 MT |
|
Energy demand
This section first discusses secondaryFootnote 10 (or “end-use”) energy demandFootnote 11 projections by reviewing energy use by sector of the economy and their associated GHG emissions. We then describe the primary energy demandFootnote 12 projections. End-use demand includes consumption of energy, including electricity and hydrogen, but not the energy used to produce electricity and hydrogen.

We make projections about energy demand by simulating the energy choices of households and businesses, including the energy technologies and fuels they use. Economic activity, population growth, technology characteristics, energy prices, and climate policies all influence the model’s outcomes.
Our energy demand projections also rely on projections about the need for energy services. Energy services are not the energy or technologies we use, but rather the things that energy enables us to do, like heat our homes, travel from place to place, or run equipment at a business. This includes projections of the output from various industries, the number of homes and businesses requiring heating and cooling, and the number of kilometres that passengers and goods move. The eventual level of energy services required may be different than in our scenarios, which would impact our projections of energy use.
In all three scenarios, energy use increases in the near term
We estimate Canadian end-use energy demand increased 4% in 2022, largely a result of increasing industrial and oil and gas activity, as well as a return to near pre-pandemic transportation levels. We project that demand growth continues in 2023 and 2024, but at a slower pace.
In the long term, energy use falls in both net-zero scenarios
While we project continuing economic and population growth, end-use demand declines by 22% from 2021 to 2050 in the Global Net-zero Scenario and 12% in the Canada Net-zero Scenario. As we describe in the following sections, this decline is largely due to switching to different technologies and fuels, more efficient use of energy, and lower activity levels in some sectors. In particular, switching from fossil fuel to electricity can reduce overall energy demand significantly because electric devices often use energy more efficiently. For example, 30% or less of the energy in gasoline is used to propel vehicles with much of the remainder being lost to heat. In an electric vehicle (EV), much more of the energy stored in the vehicle’s battery is converted to movement. The combined impact of these changes reduces Canada’s energy intensity. The energy intensity of the economy, often measured as energy use per $ of real gross domestic product, declines by 2.2% per year in the Global Net-zero Scenario, and 1.7% per year in the Canada Net-zero Scenario. Energy intensity has typically fallen about 1% per year on average in recent decades.
In the Current Measures Scenario, energy use is relatively stable
In the Current Measures Scenario, energy use is relatively stable until 2040. After 2040, energy use begins slowly increasing again. This increase is because climate policies do not strengthen beyond 2030, but the economy and population continue to grow, increasing energy use. Figure R.5 shows the changes in end-use energy demand in each scenario.
Figure R.5: Change in end-use energy demand by sector, 2021 to 2050, all scenarios

Description
Description: This column chart shows the percentage change in end-use energy demand by sector from 2021 to 2050. It compares the 1990 to 2019 historical period with the three scenarios during the 2021 to 2050 period. The sectors are residential, commercial, industrial, and transportation.
Both net-zero scenarios show declines in end-use energy demand in all sectors. Conversely, Current Measures sees an increase in all sectors, although at a slower rate than during the 1990 to 2019 period.
In all scenarios, households and businesses continue to receive the energy services much like they do today, like being able to reliably heat their homes or travel from place to place. As described in the following sections, we project considerable changes to the types of fuels and technologies that power the energy system in the future, but little change to the energy services Canadians receive.
Key trends: energy demand
Rapid adoption of devices that use electricity, like EVs and heat pumps in the net-zero scenarios.
In both net-zero scenarios, clean fuels such as hydrogen and bioenergy, along with CCUS, play an increasing role in areas that are harder to electrify.
Energy efficiency improves steadily over the projection period.
Residential and commercial

The residential sector made up 13% of Canada’s end-use energy demand, and 6% of its GHG emissions in 2021. The commercial sector, which includes buildings like offices, restaurants, and schools, made up 11% of Canada’s end-use energy demand, and 7% of its GHG emissions in 2021. Most energy use in both sectors is electricity and natural gas, and in some regions refined petroleum products (RPPs) and biomass are also key fuels. When combined, GHG emissions in both sectors are referred to as the “buildings sector” for the purposes of GHG emission reporting. GHGs in the buildings sector are primarily the result of burning natural gas and fuel oil for heating buildings and water.
In the Global and Canada Net-zero scenarios, we project that energy use patterns change considerably in both sectors. The electrification of space and water heating, along with rapid improvements in the efficiency of buildings, are core to this sector’s transformation.
In the Global Net-zero Scenario, we project that building shell efficiency (or how well buildings resist losing heated or cooled air to the outside environment) of the entire residential building stock improves by 50% from 2021 to 2050. In the commercial sector, this improvement is slightly slower at 43%. Efficiency gains are driven by energy retrofits of existing buildings and increasingly strict building codes for new buildings, with all new homes built to a “net-zero-ready” standard by 2030. Efficiency improvements are similar in the Canada Net-zero Scenario. These efficiency improvements are important because residential and commercial floorspace both grow around 50% over the projection period as new houses and buildings are built. In the Current Measures Scenario, less ambitious policy measures result in slower improvements in efficiency.
Fuel-switching is necessary to achieve net-zero

In both net-zero scenarios, efficiency improvements support achieving net-zero, but switching existing fossil fuel heating devices to non-emitting options is necessary to achieve net-zero emissions. In many regions, heating needs are currently met with natural gas or heating oil furnaces. Due to our assumptions about climate policies and technology cost reductions, electric heat pumps steadily become the device of choice when households and businesses replace their furnaces. Heat pumps also grow in regions that currently rely heavily on electric baseboard heating. Because heat pumps are very energy efficient, switching from baseboard heating to heat pumps helps limit electric demand growth in the building sector. Currently, heat pumps are gaining popularity in some regions in Canada but are used sparingly in many regions. More information about the characteristics of heat pumps is in the text box “Spotlight on Heat Pumps.” Importantly, our projections are based on parameters about the willingness of households and businesses to adopt new technologies like heat pumps. However, societal preferences change over time, which could change the adoption rates of heat pumps, or any of the other technologies we discuss in this chapter.
Heat pump use increases in both net-zero scenarios, but some gas and oil furnaces remain
In both net-zero scenarios, heat pumps provide about 50% of residential space heating needs by 2050, up from 6% in 2021, as shown in Figure R.6. This is similar in the commercial sector as heat pumps provide around half of space heating needs by 2050. While heat pumps dominate new heating technology installations by the mid-2030s, the rate of change in the residential and commercial sectors tends to be slow as most households and businesses usually replace devices near the end of their useful lives. As a result, we project that some natural gas and heating oil furnaces remain in 2050 in both net-zero scenarios. Efficiency improvements and blending fossil fuels with low-carbon fuels such as hydrogen and renewable natural gas helps reduce the emissions from these buildings. By 2050, approximately 13% of the energy used in gas-fired residential and commercial space and water heating is renewable natural gas, and 7% hydrogen.
Figure R.6: Residential space heating by technology, Global Net-zero Scenario

Description
Description: This stacked column chart shows the share of residential space heating by technology in the Global Net-zero Scenario for each decade until 2050. The technologies are biomass, heat pump, natural gas, electric, hydrogen, and others.
In 2021, natural gas made up around 50% of all residential space heating. This share decreases to less than 20% by 2050 and is largely replaced by a growing share of electric heat pumps.
Spotlight on heat pumps
Electric heat pumps are a key technology for building decarbonization in our net-zero scenarios. Heat pumps have been used globally for decades and most Canadians already have technologies that operate under the same principles in their homes: refrigerators and air conditioners. Heat pumps work by moving heat from one space (a source) to another (a sink). The two most common sources for heat pumps are the outside air and the ground. Electricity is used to transfer heat from the air or ground to a sink, either the indoor air or water of a building. This process can be reversed so that the building acts as a source and the air or ground acts as a sink, cooling the building instead of heating it. Therefore, heat pumps can be used year-round in Canada to regulate indoor temperatures.
Since heat pumps move heat instead of generating it, they can achieve efficiencies far beyond those of conventional heating methods like a natural gas furnace. Heat pumps currently on the market can achieve efficiencies of 300-550% depending on the temperature of the source and the size of the heat pump.

Air-source heat pumps are lower cost and cheaper to install than ground-source heat pumps and subsequently makeup most of the installed heat pumps across Canada, both now and in our scenarios. However, as the outside air temperature decreases, air source heat pumps become less efficient. Currently, cold climate air-source heat pumps can still achieve efficiencies of 180% at -15°C and still function well up to -25°C. Below this temperature, however, they have difficulty supplying enough heat to a home. As temperatures decrease, homes lose heat more quickly and more energy is required to extract heat from the air.
Canadians that live in climates that drop below -25°C and wish to install heat pumps have two options to heat their homes even on the coldest of days. First, when installing a heat pump, they can leave their current heating system as a backup or install a new backup at the same time. This backup can be any conventional technology used to heat a home, such as a natural gas furnace or electric resistance heating. Secondly, Canadians can choose to invest in a ground-source heat pump instead. Even in the coldest climates in Canada, the ground retains significantly more heat than the air and therefore can efficiently provide heat all winter.
Further information on heat pumps, including functionality, technical specifications, and installation is available from Natural Resources Canada’s Heating and Cooling With a Heat Pump.
Total energy use in the residential sector declines by 22% from 2021 to 2050 in the Global Net-zero and Canada Net-zero scenarios. While overall demand decreases, electricity use grows at 1.2% per year over the projection period, largely because of steady growth of electric heating with heat pumps. As more homes switch to heat pumps and electric hot water heating, demand for natural gas falls steadily. In the Global Net-zero Scenario, residential natural gas demand is 72% lower in 2050 compared to 2021, and 73% lower in the Canada Net-zero Scenario. Energy use from at-home charging of EVs is accounted for in the transportation sector, which we describe later in this chapter.
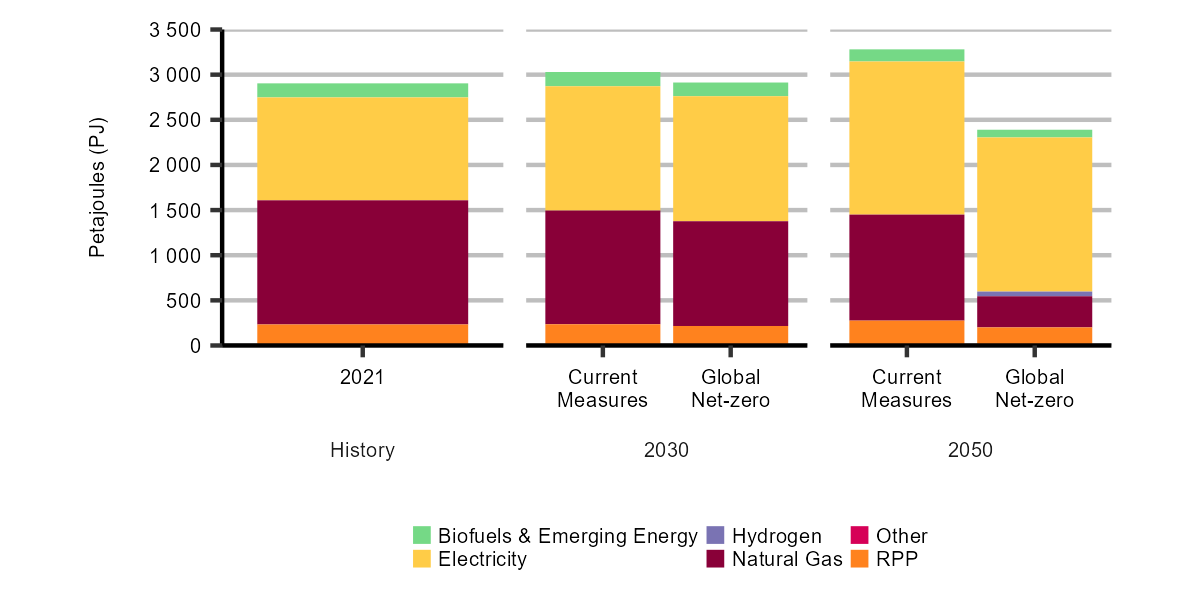
In the Current Measures Scenario, the residential and commercial sectors show steady improvements in efficiency plus some switching to electricity-based heating. However, the pace of change is much slower than in the net-zero scenarios. Natural gas demand in these sectors declines by 18% from 2021 to 2050, while electricity use also increases at a pace similar to the past two decades. Figure R.7 shows total electricity and natural gas demand in the Global Net-zero and Current Measures scenarios.
Figure R.7: Combined residential and commercial buildings energy use by fuel, Global Net-zero and Current Measures scenarios
Description
Description: This stacked column chart shows combined residential and commercial buildings' energy use by fuel in 2021 and in the Global Net-zero and Current Measures scenarios. The fuels are biofuels & emerging energy, hydrogen, electricity, natural gas, RPP, and other.
Electricity and natural gas were the main fuels in 2021, and their share remains similar in the Current Measures scenario over the projection period. The Global Net-zero Scenario sees a significant overall decrease in energy use, most of which comes from a decline in natural gas use as it is gradually replaced by electricity.
Residential and commercial GHG emissions
GHG emissions from residential and commercial buildings follow the energy demand trends we describe above. GHG emissions from the buildings sector track closely to the volume of natural gas and heating oil used. In the Global Net-zero Scenario, GHG emissions in the buildings sector fall from 87 MT in 2021 to 25 MT in 2050, a 71% decrease, with very similar reductions in the Canada Net-zero Scenario. In both net-zero scenarios, emissions from the buildings sector remain positive in 2050 but Canada overall achieves net-zero due to negative emissions occurring in other sectors. In the Current Measures Scenario, emissions decline more slowly in the buildings sector, reaching 64 MT in 2050, a 27% decline.
Industrial

The industrial sector accounted for 54% of Canada’s end-use energy demand in 2021, making it the largest in terms of energy use. The industrial sector is diverse, with several sub-sectors, including oil and natural gas, and various heavy industries like cement, pulp and paper, and iron and steel. The sector is also diverse in terms of energy use, with natural gas making up the largest share of fuel use at 49% in 2021, followed by RPPs (28%), electricity (14%), and biofuels (8%). The main use of energy in the industrial sector is to produce heat, which is used in different industrial processes. Energy commodities such as RPPs and natural gas liquids are also used as non-energy feedstockDefinition* in sectors such as chemicals and fertilizer production.

How does energy demand change over time in the industrial sector?
Discover the data for yourself using our interactive visualization tool. Check out the projected energy mix for end-use demand in the industrial sector.
Industrial GHG emissions are mainly from oil and gas and heavy industry
In 2021, the oil and natural gas sector emitted 189 MT, 29% of Canada’s total emissions. Heavy industry made up 12% of total emissions in 2021, or 77 MT.
This section focuses mostly on the energy use and GHG emission trends in heavy industry. We describe the trends for the oil and natural gas sector in the “Oil and natural gas production” section.
In both net-zero scenarios, new technology, CCUS, and fuel switching are key changes in heavy industry
In the Global and Canada Net-zero scenarios, the changes that occur in the sector to reduce GHG emissions is varied due to unique processes specific to each industrial subsector. However, the primary factors driving change are technological innovation, the application of CCUS technology, and fuel switching. In heavy industry, there are two major emissions sources: emissions from the combustion of fossil fuels to create high temperature heat and process emissions that occur from chemical or physical reactions in the production process itself.
Lower costs and stronger climate policies drive new technology deployment
New industrial technologies are adopted in the net-zero scenarios as they become more widely available at lower costs, and as producers look for options to respond to strengthening climate policies. For example, in the aluminum production sector, the use of inert anodes becomes an increasingly economic choice. Compared to carbon anodes,Definition* the benefit of inert anodesDefinition* is that carbon dioxide (CO2) is no longer released as a byproduct of the aluminum smelting process.
Another example of technology innovation occurs in the iron and steel industry. Most new steel produced in Canada occurs by reacting iron ore with coal, which creates both combustion and process emissions. In both net-zero scenarios, iron and steel producers use a mix of technologies that rely on electricity, natural gas with CCUS, and hydrogen to decarbonize the industry. Steel can also be recycled using 100% electricity and producers increasingly use this pathway where scrap steel is available.
CCUS becomes an important decarbonization option in the industrial sector
CCUS becomes an important decarbonization option where a production process requires high-temperature heat and/or has significant process related emissions. CCUS is a suite of technologies that capture CO2 from facilities to either store it in geological formations underground or use in other processes, like permanent mineralization in concrete. Instead of being permanently stored, there are also other potential uses for captured carbon, such as producing synthetic fuels.
In heavy industry, several sectors increasingly use CCUS over the projection period in both net-zero scenarios, as shown in Figure R.8. We project the heavy industry sector captures a total of 6 MT of GHG emissions in 2030, increasing to 24 MT by 2040 in the Global Net-zero Scenario, after which CCUS in the sector is relatively stable. This excludes the carbon captured in the electricity and oil and gas sectors, which we describe later in this chapter. In the Canada Net-zero Scenario, CCUS plays a similar role in heavy industry.
Figure R.8: GHG emissions captured using CCUS in heavy industry, Global Net-zero Scenario

Description
Description: This stacked column chart shows industrial CCUS in 2030, 2040, and 2050 in the Global Net-zero Scenario. It is broken down into three sectors: cement, chemicals, and iron and steel.
In 2030, most CCUS is deployed in the chemicals sector. CCUS then increases fourfold by 2040, with the cement and iron and steel sectors also becoming major adopters of CCUS.

Fuel-switching is an important trend in both net-zero scenarios
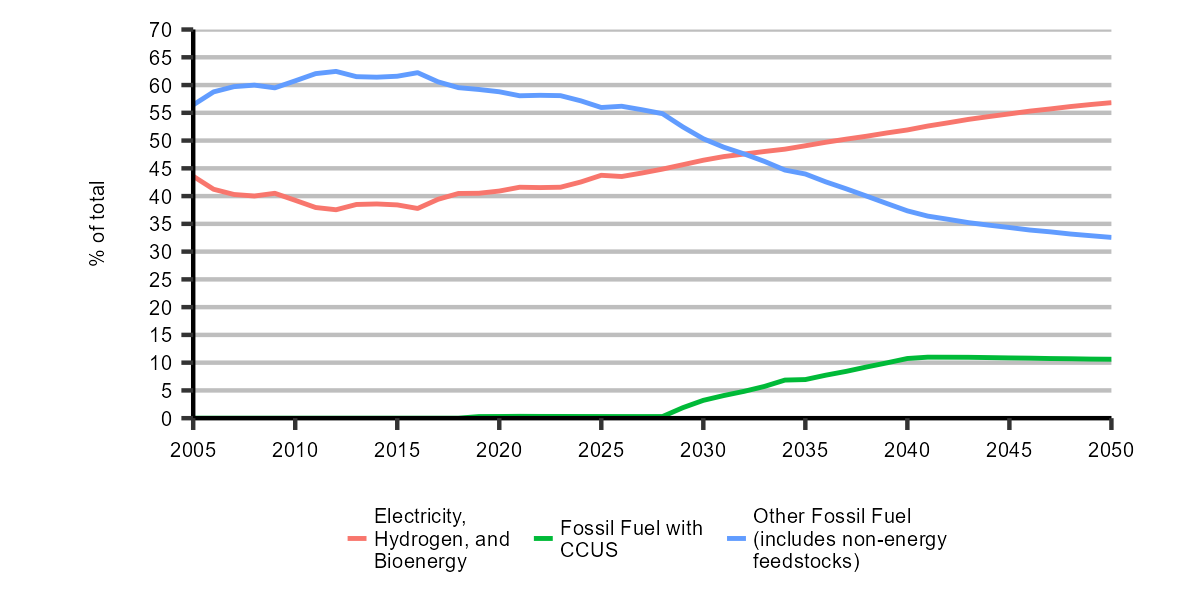
Various climate policies change the relative cost of fuels and industries respond by switching to low- or non-emitting energy sources when feasible. As shown in Figure R.9, the share of low- or no-carbon energy sources grows steadily over the projection period. The use of low-carbon hydrogen as a share of total heavy industrial energy demand increases from less than 1% in 2021 to 6% in 2050 in the Global Net-zero Scenario, and similar in the Canada Net-zero Scenario. Other energy sources, such as electricity, biomass, biofuels, and renewable natural gas, increase their share in both net-zero scenarios. These low- or no-carbon energy sources offset energy from fossil fuels, whose combined share of the heavy industrial sector’s energy use falls from around 60% of energy use in 2021 to 32% in 2050.
Figure R.9: Share of energy type in the industrial sector, excluding the oil and natural gas sector, Global Net-zero Scenario
Description
Description: This line chart shows the share of different energy categories in the projection period in the Global Net-zero Scenario. The categories are electricity, hydrogen, and bioenergy, fossil fuel with CCUS, and other fossil fuels (includes non-energy feedstock).
The share of other fossils fuel has been declining since the early 2010s, and is outpaced by electricity, hydrogen, and bioenergy by the early 2030s. Fossil fuel with CCUS starts increasing in the late 2020s, until it plateaus at slightly over 10% by the early 2040s.
Energy use changes are much slower in the Current Measures Scenario
In the Current Measures Scenario, energy use in the industrial sector undergoes some change, such as efficiency improvements and some limited applications of CCUS. However, the pace of change is much slower than in both net-zero scenarios. This is because of our assumptions about climate policies and technology costs in this scenario give less incentive for industries to change their energy use patterns.
Total industrial energy use increases less than 10% in both net-zero scenarios
We project total energy use in the heavy industry sector to be relatively flat in both net-zero scenarios, increasing less than 10% from 2021 to 2050, compared to nearly 20% in the Current Measures Scenario. New technologies and energy efficiency improvements reduce energy use in the sector.
In the Global Net-zero Scenario, total energy use in the entire industrial sector, including energy use in oil and gas, light industry, and for direct air capture processes, declines by 27% to 2050. Declining energy use for oil and natural gas production drives this trend and is partly offset by the emergence of direct air capture (DAC) facilities later in the projection period, which use large amounts of electricity and natural gas. In the Canada Net-zero Scenario, oil and natural gas production are higher and total industrial energy use is higher than the Global Net-zero Scenario, but still declines by 10% by 2050. In the Current Measures Scenario, total industrial energy use grows steadily, although somewhat slower than over the past two decades.
Figure R.10 shows total industrial demand by fuel in the Global Net-zero Scenario. By 2050, the share of electricity, clean fuels such as bioenergy and hydrogen, and fossil fuels with CCUS more than triples from current levels.
Figure R.10: Total industrial energy use by fuel, Global Net-zero Scenario

Description
Description: This stacked area chart shows industrial demand by fuel type in the Global Net-zero Scenario over the projection period. The fuel types are biofuels & emerging energy, hydrogen, other, electricity, natural gas, and RPP.
RPP has gradually been trending downwards since the early 2010s and this continues in the projection period. Similarly, industrial demand for natural gas declines starting in the mid-2020s. Hydrogen, electricity, and biofuels & emerging energy increase in the projection. Overall, industrial energy demand gradually declines until 2050.
Industrial GHG emissions
The key trends we describe in the previous section, technological innovation, CCUS, and fuel switching, result in steadily decreasing GHG emissions from the heavy industry sector in both net-zero scenarios. In both net-zero scenarios, emissions decline by nearly 75% from 2021 levels. This implies that heavy industry GHG emissions are positive in 2050, although Canada still achieves net-zero due to negative emissions occurring in other sectors. Emissions fall by 15% in the Current Measures Scenario.
DAC facilities, which we consider to be a part of the broader industrial sector, result in net-negative emissions by 2050 in both net-zero scenarios. Emissions from the oil and gas sector drop significantly in both net-zero scenarios. We describe our energy use and GHG emission results for both of these sectors later in this chapter.
Transportation
The transportation sector accounted for 21% of Canada’s end-use energy demand in 2021. This demand includes energy used to transport people and goods using a variety of modes, including on-road vehicles, rail, airplanes, and boats. Almost all energy use in this sector is RPPs derived from crude oil. Gasoline, the primary fuel for on-road passenger vehicles, made up 53% of total transportation demand in 2021. In the freight sector, diesel is the most common fuel, making up 32% of total transportation demand in 2021. Aviation fuel, biofuels, and heavy fuel oil made up much of the remaining energy use in 2021. Electricity is a small but growing portion of energy demand in the transportation sector.
The transportation sector’s GHG emissions in 2021 were 150 MT, or nearly a quarter of Canada’s total emissions. Emissions from the sector have declined by 4% since 2005. Transporting passengers accounted for 57% of GHG emissions in the transportation sector, with freight making up 33% and the remaining emissions coming from off-road vehicles.

How does energy demand change over time in the transportation sector?
Discover the data for yourself using our interactive visualization tool. Check out the projected energy mix for end-use demand in the transportation sector.
Passenger transportation
In both our net-zero scenarios, the primary change in the passenger transportation sector is the movement towards electric passenger vehicles and away from internal combustion engine (ICE) vehicles. Emissions from ICE vehicles remaining on the road also decline.
The use of EVs increases substantially in all scenarios
EV sales, including plug-in hybrid-electric vehicles (PHEVs), made up over 8% of all vehicles sales in Canada in 2022, up from 2% in 2018. We project this trend to accelerate in the Global and Canada Net-zero scenarios, with nearly all passenger vehicle sales being EVs by 2035. However, the total stock of vehicles on the road changes more slowly, as vehicles can stay on the road for 15 or more years. Though sales of new ICE vehicles are nearly zero by 2035, there are some older vehicles on the road by 2050 in both net-zero scenarios. In the Current Measures Scenario, EV sales grow at a slower rate than in the net-zero scenarios but still become a competitive choice for consumers, making up 50% of all vehicle sales by 2035, and 75% in 2050. Figure R.11 shows the share of EV sales and passenger vehicles on the road that are EVs in the Global Net-zero Scenario.
Figure R.11: EVs as a share of total vehicle sales and vehicles on the road, Global Net-zero Scenario

Description
Description: This column chart shows the share of EV sales and vehicles on the road over the projection period in the Global Net-zero Scenario.
From less than 10% of total vehicle sales in 2022, EVs make up 60% of all vehicle sales in 2030 and 100% by 2035. The share of vehicles on the road that are EVs follows to reach nearly 50% in 2035, over 80% in 2045, and nearly 100% by 2050.
The electrification of the passenger vehicle fleet is driven by the policies we assume in the net-zero scenarios. The federal mandatory zero-emission vehicle sales targets and similar policies in British Columbia (BC) and Quebec, federal and provincial EV incentives, and increasing carbon pricing all increase the availability and cost-effectiveness of EVs compared to ICE vehicles. In addition, we assume the costs of batteries, which are major component of the cost of EVs, decline over the projection period.
Emissions from the remaining ICE vehicles decrease significantly
While EVs gain an increasing market share over the projection period, emissions from ICE vehicles also decline in all three scenarios. Policies, including Canada’s light-duty vehicle GHG emissions standards and Clean Fuel Regulations, result in lower overall emissions per kilometre travelled by ICE vehicles. This includes greater blending of biofuels into the liquid fuel supply and better fuel efficiency of new ICE vehicles. Combined with wide-scale adoption of EVs, the emissions per kilometre travelled by passenger vehicles fall by around 95% in both the Global and Canada Net-zero scenarios from 2021 to 2050. In addition to the switch to EVs, public transportation continues to play a key role in moving people. Transit is increasingly powered by electricity and bioenergy in the net-zero scenarios.
Air travel emissions reduce due to aircraft efficiency improvements and use of clean fuels

In all three scenarios, demand for aviation fuel recovers to pre-pandemic levels by 2023. In the Global Net-zero Scenario, we project energy use for passenger aviation remains relatively stable after 2023 as newer, more efficient aircraft help to improve fuel efficiency of air travel, and the trends are similar in the Canada Net-zero Scenario. In the net-zero scenarios the main source of GHG emissions reductions in the sector are through increased use of biofuels and hydrogen-based fuels.
Passenger transportation energy use declines across all scenarios
Led by large-scale adoption of EVs, we project total energy use in the passenger transportation sector to decline by 43% from 2021 to 2050 in the Global Net-zero Scenario and similar levels in the Canada Net-zero Scenario. This drop in energy use is largely due to EVs being far more energy-efficient compared to ICE vehicles.Footnote 13 By 2050, electricity makes up nearly 50% of the energy use in the passenger transportation sector in both net-zero scenarios, up from below 1% in 2021. Low-carbon aviation fuel, conventional jet fuel, gasoline, and ethanol make up much of the remaining fuel mix in 2050. In the Current Measures Scenario, passenger transportation energy use declines slowly after rebounding to pre-pandemic levels in 2023. Increasing number of EVs and improving efficiency of ICE vehicles are reasons for this decline.
Freight transportation
In both net-zero scenarios, we project a few key shifts in the energy use and technologies used to transport goods. Electric trucks and vans increase significantly in some segments of the freight sector but in the heavy freight sector we project that other options are viable, including increasing use of hydrogen fuel cell technology. Biofuels also become an economically attractive fuel in the net-zero scenarios, providing a low-carbon fuel that can be used in existing diesel engines, or blended with fossil fuel-derived diesel to reduce the emission intensity of that fuel.
Light-duty freight vehicles are typically used to move smaller loads over relatively short distances. In both net-zero scenarios, electric trucks and vans gradually become the most economic choice of vehicle to serve this purpose. Nearly all light-duty freight vehicle sales are electric by 2040 in both net-zero scenarios.

Hydrogen-based vehicle use grows significantly in the heavy freight sector in the net-zero scenarios
For heavier freight, electric-powered vehicles take a share of the market in our net-zero scenarios, as do other technologies. A robust hydrogen supply develops in both net-zero scenarios, in part due the demand for hydrogen to use in trucks, rail locomotives, and marine vessels equipped with fuel cell technology. Fuel cells convert hydrogen to electricity, which then drives electric motors. Compared to batteries, compressed hydrogen paired with fuel cells is more energy-dense, which is beneficial when moving heavy goods over long distances. The use of hydrogen in the freight sector grows from nearly 0.5 MT in 2030 to almost 5 MT in 2050 in the Global Net-zero Scenario, with slightly more in the Canada Net-zero Scenario. Electricity demand for freight transportation reaches over 90 terawatt-hours (TWh) by 2050 in the Global Net-zero Scenario. Given the relatively high efficiency of EVs, this represents a large portion of freight activity. Unlike the passenger sector, where electrification of personal vehicles has significant momentum, the relative mix of technologies in the freight sector is more uncertain. Depending how technologies and markets evolve, we may see more or less hydrogen, electricity, or other clean fuels in the future. We explore this uncertainty further in the “What if” case for hydrogen supply and demand, located in the hydrogen results section.
Renewable diesel use grows to 35% of the diesel fuel supply by 2050 in the Global Net-zero Scenario

We also project steady growth of biofuel use in the freight sector. The most common biofuels used today are ethanol and biodiesel. These biofuels are often blended into petroleum-based fuels for use in ICE vehicles. However, the rate at which these fuels can be blended into the petroleum-based fuel stream is limited, usually anywhere from 5 to 20% depending on the characteristics of the engine. In the Global and Canada Net-zero scenarios, renewable diesel, often referred to as hydrogenation-derivedDefinition* renewable diesel, emerges as the leading biofuel over the projection period. Renewable diesel is chemically equivalent to diesel derived from fossil fuels. This means it is a “drop-in” biofuel and can be used as a direct replacement for petroleum-based diesel or blended at a much higher ratio than biodiesel. Renewable diesel can be derived from many different processes, allowing a diverse set of biomass feedstocks to be used. By 2030, in the Global Net-zero Scenario, we project renewable diesel’s share of the diesel fuel supply to reach 7%, then grow to 35% by 2050.
In the Current Measures Scenario, the freight sector gradually becomes more efficient, with improvements mostly focused on engine efficiency and aerodynamics. We also project much lower uptake of electric and hydrogen fuel cell vehicles, and less use of biofuels.
Freight energy use decreases in the net-zero scenarios, and increases in the Current Measures Scenario
Total energy use in the freight transportation sector increases in the near term as shipping volumes recover to pre-pandemic levels. In the longer term, demand trends downward in both net-zero scenarios. This decrease is primarily due to growth of electric and hydrogen fuel cell freight vehicles, both of which are more energy efficient compared to ICE vehicles. This effect is partially offset by steadily growing demand for freight transportation services. In the Current Measures Scenario, energy use in the freight sector increases by 25% over the projection period.
Figure R.12 shows end-use demand by fuel in the transportation sector, including passenger, freight and off-road energy use in the Global Net-zero Scenario, and total end-use demand in the other two scenarios.
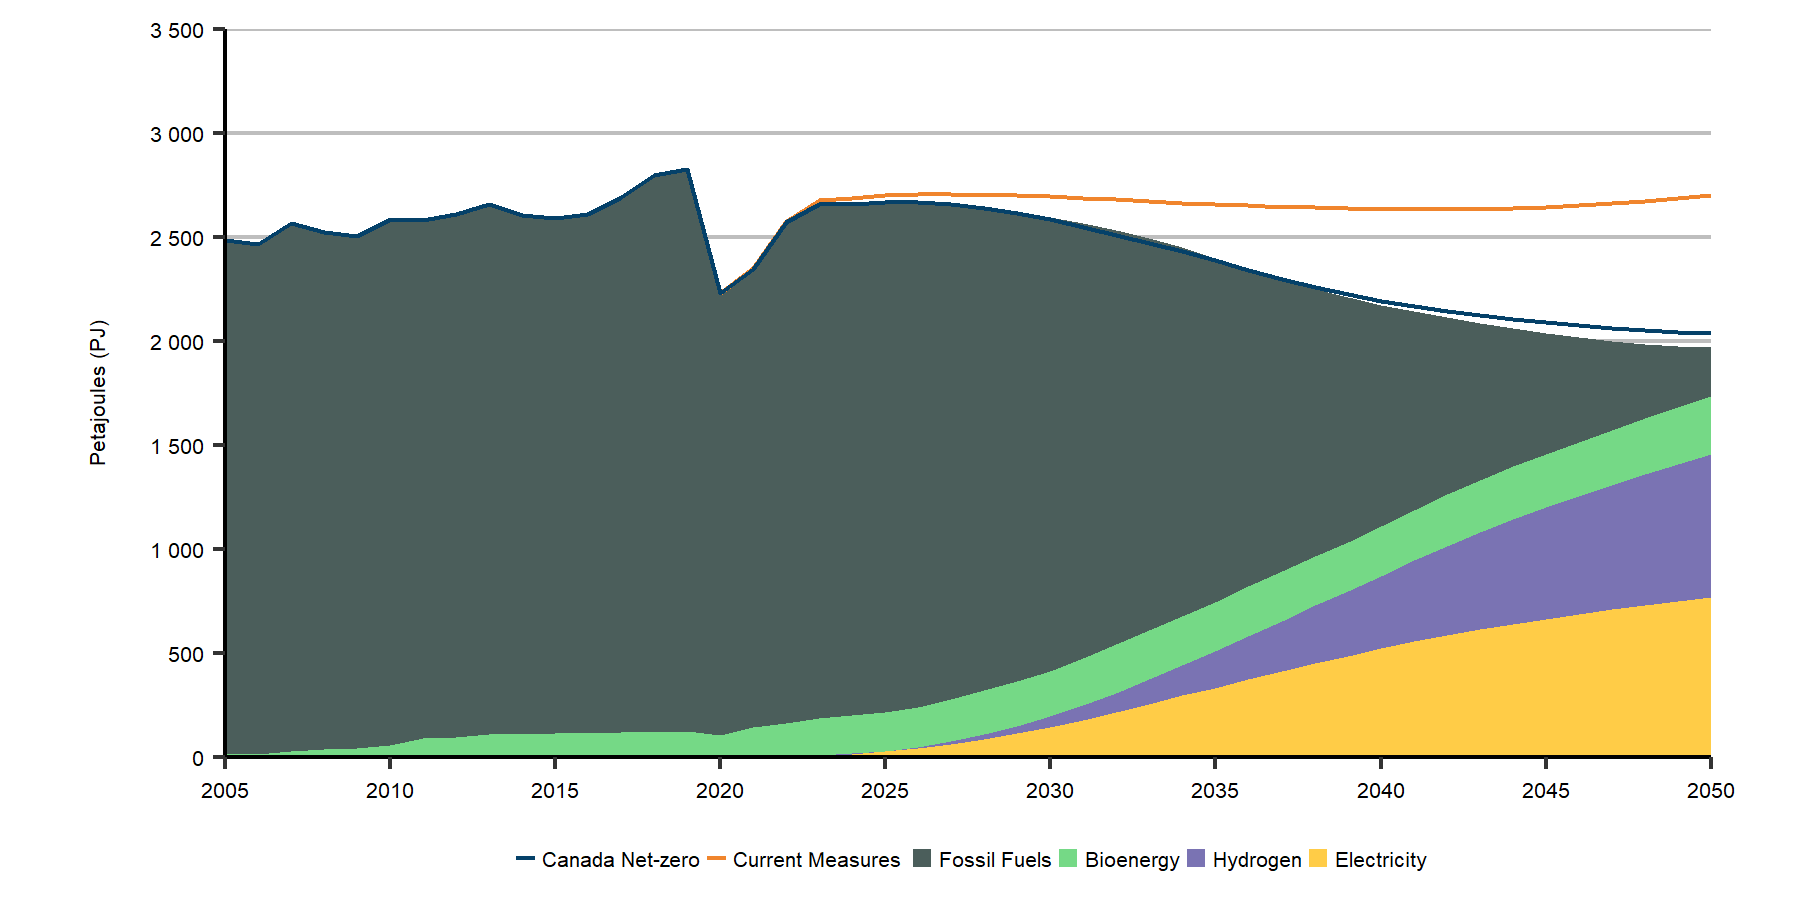
Figure R.12: Transportation sector end-use demand by fuel, Global Net-zero Scenario
Description
Description: This stacked area chart shows end-use demand by fuel from the transportation sector in the Global Net-zero Scenario. The fuels are electricity, hydrogen, bioenergy, and fossil fuels. The stacked area is compared with lines representing total transportation demand in the Canada Net-zero and Current Measures scenarios.
Fuel demand reaches a peak in the early- to mid-2020s in both net-zero scenarios, followed by a gradual decline. In these scenarios, demand for motor gasoline and diesel declines sharply, and gradually gets replaced by electricity, hydrogen, and bioenergy. Demand remains mostly flat in the Current Measures scenario in the projection period.
Transportation GHG emissions
Emissions from the transportation sector decline steeply in both net-zero scenarios while staying relatively flat in the Current Measures Scenario. We project that GHG emissions in the Global Net-zero Scenario fall by 90% from 2021 to 2050, and to a similar level in the Canada Net-zero Scenario. In both net-zero scenarios, these reductions are driven by our assumptions about policies like the federal mandatory zero-emission vehicle sales targets and steadily increasing economy-wide carbon pricing. Declining costs of certain technologies such as batteries in EVs and hydrogen vehicles also factor into our projections. While Canada achieves net-zero by 2050 in our net-zero scenarios, some emissions from the transportation sector remain in 2050, mainly in the aviation and freight sectors. In the Current Measures Scenario, emissions fall steadily after 2025, with continued emission reductions in the passenger sector offsetting growing emissions in the freight sector.
Primary energy demand

In this analysis, primary demand is the total amount of energy used in Canada. Primary demand is calculated by adding the energy used to generate electricityFootnote 14 and hydrogen to total end-use demand, and then subtracting the end-use demand for electricity and hydrogen. Primary demand is higher than end-use demand due to factors such as heat loss in thermal electric generation, and the energy required for the hydrogen production process.
In both net-zero scenarios, total primary demand falls, largely a result of declining fossil fuel use
Coal use continues its current declining trend, largely due to the phase out of coal-fired power generation. Demand for RPPs falls, largely due to much greater use of electricity in the transportation sector. One source of crude oil demand that is relatively stable over the projection period is for non-energy products such as asphalt, lubricants, and petrochemical feedstocks.
Natural gas demand declines in both net-zero scenarios, and increases in the Current Measures scenario
Natural gas demand falls due to electrification of home heating, less natural gas use in the upstream oil and natural gas sectors, and efficiency improvements in the residential and industrial sectors. The decrease in natural gas demand is less than for coal and RPPs, as we project that natural gas becomes increasingly used in the power generation sector when coupled with CCUS, and as a feedstock for hydrogen production. In the Current Measures Scenario, primary energy demand is relatively flat until 2040, before increasing in the last decade of the projection period. Figure R.13 shows primary demand by fuel for all three scenarios.
Figure R.13: Primary energy demand by fuel, all scenarios

Description
Description: These three charts show primary energy demand by fuel over time in the Global Net-zero, Canada Net-zero, and Current Measures scenarios. The fuels are natural gas, coal, coke and coke oven gas, hydro, RPP, nuclear, and other renewables.
All scenarios see a significant growth in other renewables, especially the net-zero scenarios. These scenarios also see a pronounced increase in nuclear starting in the 2030s and a gradual decline in natural gas and RPP starting in the mid-to-late 2020s.
Key uncertainties: energy demand
Energy use drivers: The need for energy in each sector is driven by our projections of activity in that sector, like economic output of various industries or population growth. Different outcomes for any of the energy use drivers could impact the long-term energy outlook.
Technology: We make assumptions about the costs of various energy technologies in the future. Costs that are different than we assume will change the decision-making of energy users and the energy use projections in our scenarios. We explore some of these uncertainties in the “What if” cases throughout this report.
Behavioural change: Energy users’ decision-making changes as societal preferences change over time. For example, preferences could evolve towards more or less dense cities, more remote work, or bigger or smaller homes, all of which can influence energy use projections.
Electricity
Canada’s electricity system is currently among the lowest emitting in the world, with 81% of the sector’s generation coming from low- or non-emitting sources. This is largely due to Canada’s hydroelectric generation resources, which supplied over 61% of Canada’s electricity in 2021. Nuclear generation and, increasingly, wind and solar, also contribute to Canada’s high proportion of non-emitting power generation.

To develop the electricity production projections in EF2023, we rely on a model that simulates the operations and the investment decisions of the electricity sector, while also ensuring reliability of the system. The model builds new generation, storage and transmission infrastructure based on minimizing the total system costs throughout the projection period. We also incorporate our assumptions about policies and the costs and operational characteristics of various generation technologies. Factors beyond these can impact the development of a wide array of energy projects, including electricity projects. Examples include concerns about air quality, safety, noise, competing land-uses, or visual impacts. Societal preferences and how they may evolve in the future, are largely beyond the scope of our analysis but have potential to impact the projections for any of the electricity generation technologies we describe in this section.
Canada’s electricity system is regionally diverse
The generation mix in each province and territory is largely determined by the resources it has available. Quebec, Manitoba, Newfoundland and Labrador, Yukon, and BC have significant amounts of hydro generation, whereas Alberta, Saskatchewan, and remote and northern communities rely more on fossil fuel generation. Ontario and New Brunswick both have diverse electricity mixes, including nuclear. This regional diversity means that the emission reduction pathways in our net-zero scenarios are unique to each region’s specific circumstances.
The electricity sector has exhibited the greatest reduction in emissions among Canada’s major sectors, cutting emissions by more than half from 2005 to 2021. Many provinces reduced emissions from this sector during that time, with the biggest reductions from Ontario and Alberta. Ontario phased out coal-fired generation by 2015 and Alberta is likely to do so by the end of 2023. In total, the electricity sector accounted for 8% of Canada’s emissions in 2021.
Electricity use increases while emissions decrease in the net-zero scenarios
In the Global and Canada Net-zero scenarios, electricity becomes the cornerstone of Canada’s energy system. In both scenarios we project the amount of electricity generated and consumed in Canada in 2050 more than doubles from current levels. While the need for electricity grows, we project the electricity system also reduces emissions to net-zero by 2035 in both scenarios. This reduction in emissions is led by growth in wind, nuclear, hydroelectric, and natural gas-fired generation with CCUS, and the phase out of coal-fired electricity generation. After 2035, GHG emissions from the electricity sector become net-negative, meaning the sector removes more emissions than it emits through deployment of bioenergy coupled with CCUS technology (BECCS)Definition*.
Key trends: electricity
Electricity use more than doubles over the projection period in both net-zero scenarios.
We project the most growth in wind generation in all scenarios, including the Current Measures Scenario, despite less ambitious climate policies and more modest technology cost improvements.
The electricity system decarbonizes and becomes net-negative by 2035 with the deployment of BECCS generation facilities.

What energy sources does your region use to generate electricity?
Discover the data for yourself using our interactive visualization tool. Check out the projected energy sources for electricity generation.
Electricity use
As described in the “Energy demand” section of this chapter, we project that electricity demand grows significantly in all end-use sectors in both net-zero scenarios. This growth is driven by wide-scale adoption of EVs and heat pumps, and electrification of some industrial activities. In addition, as we describe in more detail in the “Hydrogen” section of this chapter, hydrogen production becomes a significant source of new electricity demand in the future. Finally, we project construction of direct air capture (DAC) facilities, which become another new source of electricity demand later in the projection period. We describe the role of DAC in the “Negative emissions” section later in this chapter.
Figure R.14 shows electricity demand by sector in the Global Net-zero Scenario. Overall, we project electricity demand to grow 120% from 2021 to 2050 in the Global Net-zero Scenario, and 135% in the Canada Net-zero Scenario. In both scenarios, the annual rate of demand growth is almost triple that of the 1995 to 2019 period. In the Current Measures Scenario, electricity demand grows more slowly than in the net-zero scenarios, increasing by 62% over the projection period.
Figure R.14: Electricity use by sector, Global Net-zero Scenario

Description
Description: This stacked area chart shows projected electricity demand in the Global Net-zero Scenario in the residential, commercial, industrial, transportation, and hydrogen sectors.
Electricity demand grows steadily in the residential, commercial, and industrial sectors. Transportation and hydrogen production, which are near zero in 2021 become major drivers of growth in the projection.
Our electricity projections are also influenced by changes in day-to-day and seasonal electricity use patterns. As new uses of electricity emerge, the annual peak in electricity demand in a system will likely change. This change will influence how electricity systems evolve as utilities and system operators need to reliably meet the annual peak in electricity demand, which might occur for only an hour or two in a year.
In both net-zero scenarios, the annual hourly peak of electricity demand grows in all regions
This increase is because of growing electricity use overall, but also growing use of devices that increase electricity use more during a certain period during the day or in a particular season. For example, EVs typically draw relatively large amounts of electricity over a short period when owners plug them in. Similarly, greater use of heat pumps means that overall electricity demand is more sensitive to weather than it is now.
What if electricity vehicle charging patterns result in higher peak electricity demand?
Sales of EVs in Canada have quickly increased in recent years, reaching over 8% of total vehicle sales in 2022. While ICE vehicles rely on RPPs like gasoline and diesel as their source of energy, EVs are powered by electricity stored in large batteries, which drive electric motors, propelling the vehicle. EV batteries are charged using the same electricity grid we use to power other aspects of our daily lives.
EVs need more electricity than most other household devices
Most currently available EVs consume about 3,000 to 6,000 kilowatt-hours (kWh) in a year based on 20,000 km of driving. A new refrigerator uses about 500 kWh per year. Currently, most EV charging occurs through a charger installed in a garage or at a dedicated public charging station. Most EV charging occurs at a fairly high rate of power transfer in order to charge batteries quickly. Most home chargers can charge a depleted battery in 4 to 12 hours. Many public EV charging stations are much quicker than home chargers.
EV owners tend to plug their vehicles into chargers when they arrive home. For many drivers, this is often in the late afternoon when they return from work. Residential electricity demand is often already high during these hours, including higher use of stoves and electronics. It is also often the hottest part of the day in the summer, meaning more air conditioning units may be running. If charging patterns are not managed as the share of EVs grows, EV charging could contribute to much higher electricity use during peak times. The level of peak electricity demand throughout the day and over the year affects how electricity systems develop. Utilities and system operators need to continually meet the electricity needs of users, but also have sufficient capacity to meet annual peak electricity demand, which might be for only a few hours in a year.
How EV charging patterns affect peak electricity demand largely depends on how much utilities and grid operators can more evenly spread charging out across the hours of the day. Charging patterns can be influenced through market mechanisms, such as offering consumers lower electricity prices during certain hours of the day when demand is lower. Most home chargers can be controlled by consumers or grid operators to delay charging to lower demand hours.
“What if” EV charging during peak hours is not managed?
In the Global Net-zero Scenario, we assume that a combination of price signals, technologies, and behavioural changes result in charging that is more evenly spread across the hours of the day. In this “What if” analysis, we explore how uncoordinated EV charging might impact the electricity system and ultimately the total amount of electricity generating capacity required. This analysis, the Uncoordinated Charging Case, models an outcome where more drivers charge their EVs during peak hours.
Peak electricity demand in each province and territory increases throughout the projection period in the Global Net-zero Scenario as total electricity demand increases and electricity use patterns change. For example, peak electricity demand in Ontario was 22.2 gigawatts (GW) in 2021. In the Global Net-zero Scenario, peak demand is 177% higher by 2050, reaching 61 GW. This increase in peak demand is similar in magnitude in many other provinces and territories.
However, while total electricity use is identical in both cases, peak demands by 2050 in most provinces and territories in the Uncoordinated Charging Case are between 1 and 5% higher than in the Global Net-zero Scenario. Despite this higher peak in demand, the overall impact on system-wide needs for new capacity is relatively small, as we project some changes to the generation mix compared to the Global Net-zero Scenario, as well as changes to the operations of the electricity system.
Energy systems become more flexible, potentially accounting for uncoordinated charging
Figure R.15 shows an example winter day in 2050, showing hourly electricity demand in BC with coordinated and uncoordinated EV charging. The emergence of hydrogen as a new source of electricity demand requires building more electricity generation capacity. However, hydrogen production is a flexible source of electricity demand. During periods of high demand, hydrogen production using electricity can be reduced to accommodate the needs of the electricity system. That flexibility allows the electricity systems in several regions to accommodate the higher peak demand in the Uncoordinated Charging Case without significant additional investment in generating capacity.
We project that many provinces utilize this flexibility in both the Global Net-zero Scenario and Uncoordinated Charging Case to offset peak periods of demand. Without this demand flexibility, the difference in peak demand in the two scenarios would have been higher, requiring more investment in new generation in the Uncoordinated Charging Case.
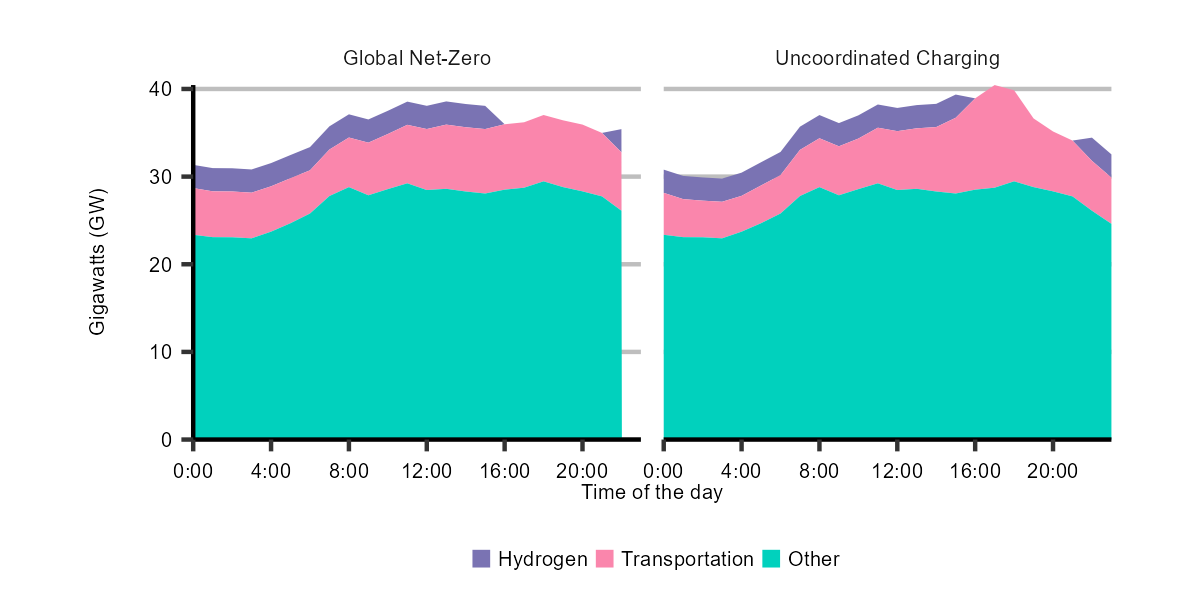
Figure R.15: Example daily hourly electricity demand in British Columbia by use, winter of 2050, Global Net-zero Scenario and Uncoordinated Charging Case
Description
Description: These stacked area charts show a hypothetical example of what hourly electricity demand could look like in British Columbia in the winter of 2050. The charts are broken down by demand from the hydrogen, transportation, and other sectors. The first chart is from the Global Net-zero Scenario. The second chart shows demand with uncoordinated charging.
Demand from the transportation sector sees a significant peak starting at 16:00 in the Uncoordinated Charging chart and remains more stable during the day in the Global Net-zero Scenario. Demand for hydrogen drops to zero in both scenarios during the peak demand times of around 16:00 to 20:00.
Wind generation increases while solar decreases in the Uncoordinated Charging Case
As shown in Figure R.16, compared to the Global Net-zero Scenario, we project more wind and less solar generation in the Uncoordinated Charging Case. In this case, electricity use is higher during the early evening and lower during the day. Because solar generates more during the day than in the evening, solar generation is less valuable in the Uncoordinated Charging Case relative to the Global Net-zero Scenario and less solar generation is built. Conversely, wind tends to blow more during the evening period, so becomes a more valuable asset to the electricity system in the Uncoordinated Charging Case. By 2050, wind generation is 4% higher in the Uncoordinated Charging Case compared to the Global Net-zero Scenario, while solar generation is 32% lower.
Natural gas without CCUS is used more often in the Uncoordinated Charging Case
Finally, in some provinces, we project higher generation from natural gas with and without CCUS. To accommodate the highest peaks in generation throughout the year, some provinces have natural gas-generating facilities without CCUS that are utilized very rarely in the Global Net-zero Scenario. In the Uncoordinated Charging Case these assets are utilized more often in order to meet higher and more frequent peaks in electricity demand. As a result of more frequent natural gas use, there are slightly higher GHG emissions from the electricity sector in the Uncoordinated Charging Case.
Figure R.16: Difference in generation between the Global Net-zero Scenario and the Uncoordinated Charging Case in 2050, by select fuel

Description
Description: This column chart shows the difference in electricity generation between the Global Net-zero Scenario and the Uncoordinated Charging Case in 2050.
In the second scenario, solar generation decreases by around 20 TWh and is compensated by an increase in generation from wind, natural gas with CCUS, and natural gas (unabated).
Greater use of EVs, along with greater electricity use across the energy system, would likely require investments in local distribution system infrastructure to ensure sufficient capacity to deliver electricity during high demand periods. This need for additional infrastructure could be increased by uncoordinated EV charging, but this is beyond the scope of this analysis. The analysis in EF2023, and in this “What if,” focuses on the bulk power system and does not model local electricity distribution systems.
Electricity production
To meet rapidly growing electricity demand while also decarbonizing electricity production, we project significant changes to Canada’s electricity system in both net-zero scenarios. Our assumptions about policies like carbon pricing and the proposed Clean Electricity Regulations mean that almost all electricity-generating facilities built over the projection period are low- or non-emitting, or even net-negative in terms of GHG emissions. Given the diversity of Canada’s electricity system today, there is considerable variety in how each region’s electricity system evolves in our net-zero scenarios. Technologies deployed include wind, solar, hydro, nuclear, fossil fuel with CCUS, and BECCS. Meanwhile, power generation from coal and natural gas not equipped with CCUS drops quickly over the first decade of the projection and is near zero after 2035. Figure R.17 shows the difference in capacity, by fuel, from 2021 to 2050 in the Global Net-zero Scenario.
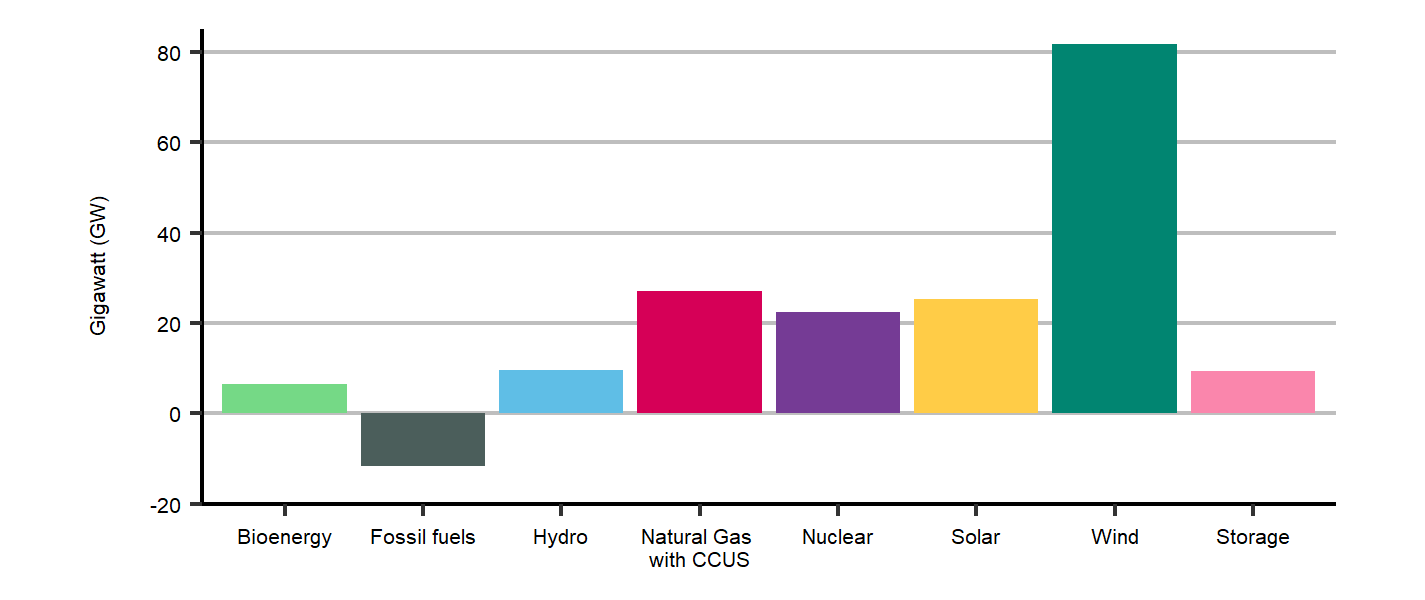
Figure R.17: Change in electricity capacity from 2021 to 2050, by fuel, Global Net-zero Scenario
Description
Description: This column chart shows the change in electricity capacity in the Global Net-zero Scenario compared to 2021 levels by source. The sources are bioenergy, fossil fuels, hydro, natural gas with CCUS, nuclear, solar, and wind.
Wind sees the most significant increase in capacity, at nearly 80 GW. It is followed by natural gas with CCUS, solar, nuclear, hydro, and bioenergy. Fossil fuels see a decline in electricity generation capacity.
We project that electricity production grows more slowly in the Current Measures Scenario when compared to the net-zero scenarios. There are also fewer policies aimed at reducing the sector’s GHG emissions. Still, while not as dramatic as in the net-zero scenarios, in-place policies, along with our assumptions of modest technology cost improvements, result in strong growth in low-emitting generation sources. Figure R.18 shows electricity generation by fuel in each scenario.
Figure R.18: Electricity generation by fuel, all scenarios

Description
Description: This stacked column chart shows electricity generation by fuel in 2021 and in 2050 in all three scenarios. The fuel types are biomass / geothermal, hydro, oil, uranium, coal and coke, natural gas, solar, and wind.
Wind sees the most significant growth in all scenarios. Uranium sees a significant growth in the net-zero scenarios.
Wind and solar
In all three of the scenarios in EF2023, we project substantial growth of wind generation and steady growth of solar. Our modeling suggests that the low capital and operating costs of both resources make them among the most attractive options for utilities and power producers to increase electricity generation to meet growing demand while also reducing GHG emissions.
Onshore wind generation increases significantly in all scenarios

Electricity generation from onshore wind increases the most among all generation technologies considered in our analysis. We project that wind generation grows ninefold in both the Global and Canada Net-zero scenarios, making up over a quarter of all electricity produced in Canada by 2050. In the Current Measures Scenario, wind generation does not grow as quickly as in the net-zero scenarios, but still increases substantially from current levels, and seven times higher by 2050.
Onshore wind generation grows the most in Alberta, Saskatchewan, and Ontario. This is in part due to strong wind resources in these provinces. In addition, wind generation often matches periods of high electricity demand in these regions, making the energy it generates particularly valuable. For example, in Alberta, it is often windier during the winter, coinciding with periods when demand from electric heat pumps is also high.
Offshore wind grows in both net-zero scenarios
This technology currently not deployed in Canada, but increasingly used in Europe and Asia. Grid-connected offshore generation reaches 23 TWh by 2050. All of that generation comes from offshore wind facilitiesFootnote 15 built off the coast of Nova Scotia. As we discuss in the hydrogen section, additional offshore wind capacity is built off the coast of Nova Scotia and Newfoundland & Labrador and is directly connected to hydrogen electrolysis facilities aiming to export hydrogen to international markets.
Solar generation grows steadily in all three scenarios
Like wind, solar generation becomes one of the most economic choices for utilities and power producers in most regions. In the Global Net-zero Scenario, utility-scaleDefinition* solar generation becomes an important aspect of the electricity system in many provinces, with total Canadian generation growing from 2.5 TWh of generation in 2021 to 50 TWh in 2050. By 2050, solar generation makes up around 5% of total electricity generation in both the Global and Canada Net-zero scenarios. In the Current Measures Scenario, solar generation grows at a similar rate as in the net-zero scenarios.
We also project steady growth of distributedDefinition* solar generation installed primarily on rooftops of residential and commercial buildings. The growth is driven by declining costs and supporting policies such as net-zero building policies and voluntary actions by companies to reduce their environmental footprint. Total installed rooftop capacity reaches 8.2 GW by 2050, meeting 2.5% of residential and commercial electricity demand in the Global Net-zero Scenario. Figure R.19 shows generation from wind and solar in the Global Net-zero Scenario.
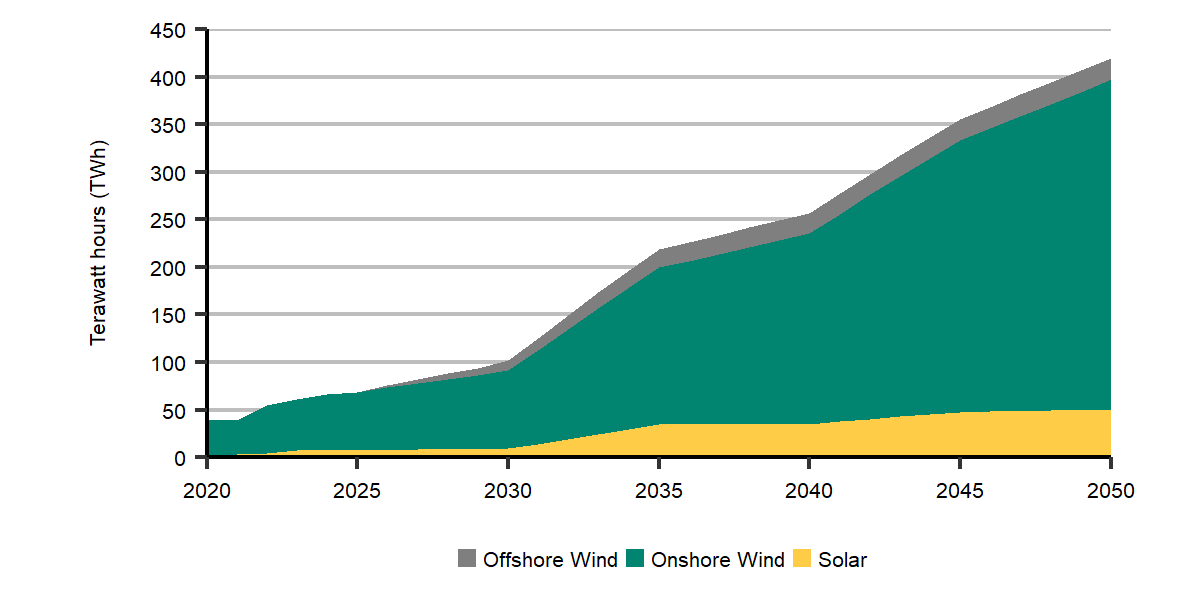
Figure R.19: Generation from onshore wind, offshore wind, and solar, Global Net-zero Scenario
Description
Description: This stacked area chart shows generation from onshore wind, offshore wind, and solar over time in the Global Net-zero Scenario.
Generation from offshore wind becomes noticeable starting in the late 2020s. Onshore wind sees a significant growth starting in the 2020s that continues until the end of the projection period. Solar starts seeing significant growth in the early 2030s.
Matching electricity supply and demand
Compared to most power generation technologies, wind and solar are unique in that their power output is tied to weather patterns, specifically wind speeds and sunlight. Other generating technologies, like hydroelectric or fossil fuel-based generation, can usually adjust their output, although different resources can adjust more quickly and cost effectively than others. This adjustment is important, because electricity systems must constantly balance electricity production and consumption in real time.
Electricity consumption can vary significantly over a day and from season to season in response to factors like the patterns of daily life and weather conditions. Wind and solar become important sources of bulk power in all our scenarios but adjustable sources of power remain critical to balancing electricity systems. Our modeling takes this necessity into account, ensuring the electricity needs of users are met, and regional electricity demand and supply are in balance on an hourly basis. Figure R.20 shows our projections of hourly electricity demand and generation on two typical days in Alberta in the summer and the winter of 2050.
Figure R.20: Example hourly electricity supply and demand in Alberta for a day in summer and winter, 2050, Global Net-zero Scenario

Description
Description: These two stacked area charts show an example of a hypothetical hourly electricity supply and demand load in summer and winter in Alberta, by energy source. The energy sources are natural gas, natural gas with CCUS, solar, wind, hydro, nuclear, and bioenergy. Each chart has a line representing Alberta electricity demand to compare to the stacked area.
The summer chart shows significant generation from solar from around 8:00 to 18:00. Solar generation is reduced in terms of length and quantity in the winter chart. Conversely, wind generation is lowest during the day in the summer and increases at night and in the early morning. Wind generation is highest in winter, especially at night and in the early morning. Natural gas and nuclear SMR generation vary to account for changing demand and variable generation levels.
Hydroelectricity

Hydroelectricity is currently the core of many provincial electricity systems, making up 90% or more of generation in Newfoundland and Labrador, Manitoba, Quebec, and BC. Hydroelectric generation is emission-free, and most facilities can vary power generation to help grids balance electricity supply and demand.
Hydroelectric generation grows steadily and at a similar rate in all three scenarios
Hydroelectric generation increases around 26% from 2021 to 2050 in each scenario. Total hydroelectric generation as a share of total Canadian generation falls from 61% in 2021 to 38% in 2050 in the Global Net-zero Scenario, as other generation sources increase more quickly. Our projections of hydroelectric power include the Site C project in BC, which is currently under construction. Our technology cost assumptions indicate that building a new hydroelectric facility is relatively expensive compared to many other options.
Most growth in hydroelectric power occurs in provinces with existing hydroelectric facilities
The geography of those regions presents more opportunities for additional hydroelectric projects or expansions. In both net-zero scenarios, hydroelectric generating capacity increases the most in Quebec (+11% from 2021 to 2050) and Manitoba (+40%). Most hydroelectricity growth comes from projects that are currently under construction and projected new developments. The remainder comes from upgrades to existing hydroelectricity units.

Nuclear
Nuclear power is a key component of Ontario and New Brunswick’s electricity systems. Nationally, nuclear power generation made up 14% of total electricity generation in 2021.
In all three scenarios, we project nuclear generation to vary over time as some of the large nuclear facilities are refurbished, meaning the units are modernized to extend their usable life. We assume Ontario’s nuclear fleet is refurbished as per the schedule laid out by the Ontario Independent System Operator in its 2022 Annual Planning Outlook.
Small modular reactors (SMRs) increase significantly in both net-zero scenarios
In all three scenarios, we do not project any new large-scale nuclear facilities are built over the projection period, as other generation technologies more cost-effectively meet growing electricity demand given our assumptions. However, in both net-zero scenarios, we project considerable growth for small modular reactors (SMRs), particularly in the 2035 to 2050 period. Along with renewable technologies, these nuclear SMR units play a pivotal role in Canada’s electricity system in the net-zero scenarios. By 2050, generation from SMRs make up 12% of total electricity generation by 2050 in both net-zero scenarios, with large additions in Ontario, Alberta, and BC. In the Current Measures Scenario, nuclear generation remains close to current levels through much of the projection period, with very limited growth in SMRs. Figure R.21 shows nuclear generation over the projection period in the Global Net-zero Scenario.
Figure R.21: Nuclear generation by technology, Global Net-zero Scenario
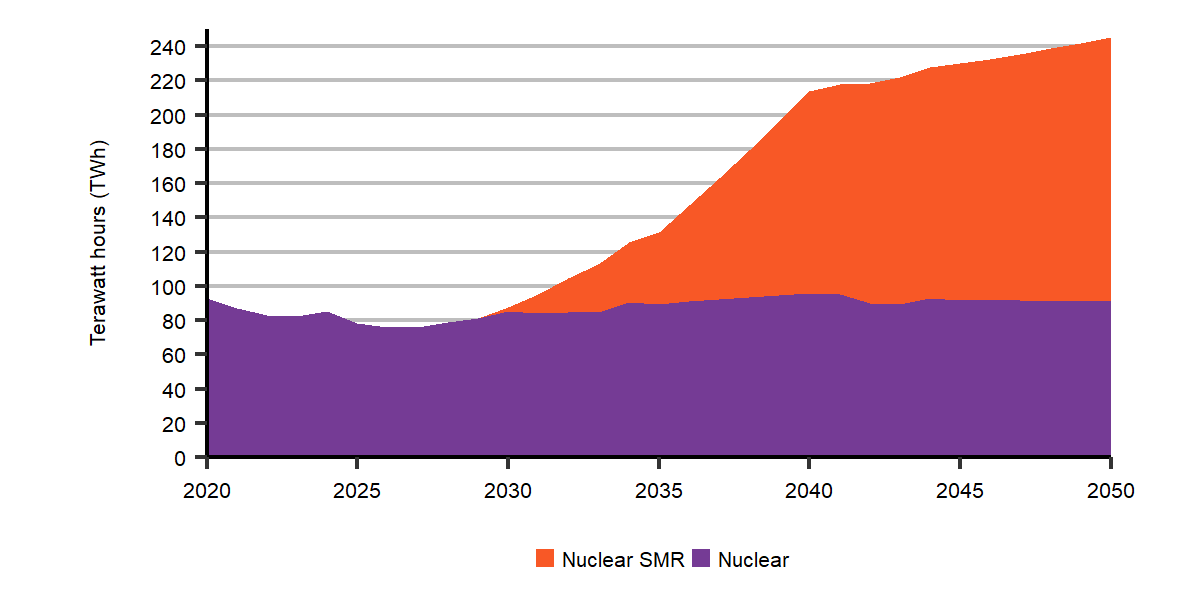
Description
Description: This stacked area chart compares nuclear and nuclear SMR electricity over the projection period in the Global Net-zero Scenario. Nuclear generation increases modestly over the projection period, and nuclear SMR grows significantly starting in the 2030s to make up most of total nuclear generation in 2050.
What if small modular reactor (SMR) technology matures less quickly and is more costly?
Canada has a long history with nuclear power, with three large-scale power facilities operating in Ontario, and one in New Brunswick. About 14%, or 82 TWh, of Canada’s electricity came from nuclear power in 2021. Recently, some governments, utilities, and power producers have focused on SMRs as a potential way to meet future electricity demand growth with a carbon-free generation option. In 2020, the Government of Canada released its SMR Action Plan, and in 2022 the governments of Ontario, Saskatchewan, New Brunswick, and Alberta released A Strategic Plan for the Deployment of SMRs. In the fall of 2022, Ontario Power Generation began site preparation activities and applied to the Canada Canadian Nuclear Safety Commission for a license to construct an SMR at the existing Darlington nuclear site.
SMRs are an emerging class of nuclear reactors that are smaller than conventional nuclear power plants in terms of size and power output. The modular aspect of SMRs means many components of a facility are factory-built, shortening plant construction times. SMRs can be used to generate electricity and to produce steam for some industrial applications such as in-situ oil sands operations.
SMR building costs fall and generation increases in the Global Net-zero Scenario
In EF2023, our electricity sector analysis relies on assumptions about the costs of various technologies. The electricity model then projects the future electricity generating mix based on the demand for electricity and the costs and characteristics of a wide range of options to generate electricity. In the Global Net-zero Scenario, we assume the capital cost of building and connecting a new SMR to the grid is 2022$9,180 per installed kilowatt (kW) of capacity in 2030, falling to 2022$7,080/kW in 2050.
Given these assumptions, and the costs and characteristics of other generating facilities, we project nuclear power generation to more than double from current levels by 2050 in the Global Net-zero Scenario. All of that growth is from SMRs, which are almost all built in the post-2035 period. About 52% of this growth occurs in Ontario, where the nuclear industry is already well-established, along with notable additions of SMRs in Quebec, BC, and Alberta.
Low SMR Case: “What if” SMR building costs remain high?

As SMRs are an emerging technology, there is considerable uncertainty as to how much the technology will ultimately cost, especially 25 years or more in the future. To explore this uncertainty, we modeled the Low SMR Case, where we assume higher capital costs for SMRs than in the Global Net-zero Scenario. In the Low SMR Case, we assume that the capital cost of building a new SMR is 2022$10,170/kW in 2030, falling to 2022$9,173/kW in 2050.
The results of this analysis suggest that higher costs for SMRs translates into less investment in SMRs and greater deployment of a variety of other generating technologies. Generation from SMRs is 34% lower in the Low SMR Case than in the Global Net-zero Scenario. The share of generation from SMRs by 2050 in the Low SMR Case is 9% of total generation in Canada, compared to 12% in the Global Net-zero Scenario.
Other types of electricity generation increase in the Low SMR Case
Lower use of SMRs to meet electricity demand affects the broader electricity mix. Compared to the Global Net-zero Scenario, the installed capacity and generation of almost all other forms of generation increase in the Low SMR Case, with the largest increases in wind and natural gas with CCUS, as shown in Figure R.22. In the Global Net-zero Scenario, SMRs played a role in supporting the electricity system as a flexible source of electricity production. In the Low SMR Case, more of this flexible generation comes from natural gas with CCUS.
Figure R.22: Difference in generation between the Global Net-zero Scenario and the Low SMR Case in 2050, by select fuel

Description
Description: This column chart shows the difference in generation in the Global Net-zero Scenario versus the Low SMR Case. The generation sources are nuclear SMR, natural gas (unabated), natural gas with CCUS, solar, and wind.
Nuclear SMR sees a significant decline in the Low SMR Case versus the Global Net-zero scenario. This decline is compensated by higher wind, natural gas with CCUS, solar, and natural gas (unabated) generation.
Given the emerging nature of SMRs, there is uncertainty in the role they will play in achieving net-zero emissions by 2050. This “What if” analysis shows that lower use of SMRs results in an increased capacity and generation from a diverse mix of technologies. However, the overall GHG emissions from Canada's electricity sector in the Low SMR Case still remain close to the Global Net-Zero Scenario.
Fossil fuels
All provinces and territories have some fossil fuels in their electricity generation mix, and in 2021, 18% of all electricity generated in Canada came from facilities powered by fossil fuels, including coal, natural gas, and RPPs. The majority of generation in Nova Scotia, Alberta, Saskatchewan, Nunavut, and the Northwest Territories was fossil fuel based.
Unabated fossil fuels remain only for emergencies in the net-zero scenarios
In both net-zero scenarios, we project that generation from coal is completely phased out by 2030. This phase-out, along with steady growth in electricity use, means natural gas-fired electricity generation increases early in our projections. We also project unabated fossil fuel generation, meaning no CCUS is used to capture emissions, is nearly zero after 2030. Our assumptions about policies and costs of other technologies mean low- and non-emitting power sources are the most cost-effective option for generating electricity. Some unabated generation facilities remain online throughout the projection period, providing an option for emergency generation if required. The share of unabated fossil fuel generation falls from 18% in 2021 to 2% by 2035, and further decline to less than 1% of generation in 2050. An exception is the Territories and other remote and northern regions, where many communities rely solely on diesel-fired generation.
Natural gas with CCUS is a flexible power source in the net-zero scenarios
While unabated fossil fuel generation is largely phased-out in the net-zero scenarios, natural gas-fired generation combined with CCUS becomes an important part of the generation mix in some regions. Natural gas with CCUS is first deployed in 2030 and grows steadily throughout the projection period, reaching 69 TWh by 2050. While more expensive compared to wind and solar per unit of electricity generated, natural gas with CCUS is a flexible source of power, meaning it plays an important role in balancing electricity systems, particularly those that do not have many other flexible options. Most additions of natural gas with CCUS are in Alberta, Saskatchewan, and Ontario. Figure R.23 shows fossil fuel generation by fuel in the Global Net-zero Scenario.
Figure R.23: Fossil fuel generation by fuel, Global Net-zero Scenario

Description
Description: This stacked area chart shows power generation from fossil fuels by in the Global Net-zero Scenario. The fossil fuel types are oil, coal, natural gas, and natural gas with CCUS.
Coal declines sharply to reach 0 TWh in 2030, and natural gas sees a gradual increase until it reaches a plateau in 2030 and starts declining until 2040. Natural gas with CCUS starts growing in the late 2030s until it makes up most of fossil fuel generation in 2050.
In the Current Measures Scenario, unabated natural gas-fired generation increases steadily. Natural gas-fired generation grows by 38% from 2021 to 2050, making up 11% of total generation at the end of the projection period. We do not project any natural gas generating units with CCUS in the Current Measures Scenario.
Biomass
In 2021, just over 2% of Canada’s electricity is generated from biomass, much of which is in BC. Biomass and biofuel combustion releases CO2 that was originally captured and stored in plant matter. Plants release this stored CO2 when they die naturally. As a result, we consider biomass and bioenergy a low-carbon source of energy when well managed. In both net-zero scenarios, bioenergy with carbon capture and storage (BECCS), becomes a key technology that supports decarbonization of the electricity sector and Canada as a whole. Generating electricity using BECSS can result in negative GHG emissions by permanently storing carbon that would otherwise be temporarily stored in plants. As a result, BECCS generation serves a dual purpose in the energy system, providing electricity to the grid and offering a source of negative emissions. We assume those negative emissions can then be sold to other power producers or industries outside of the power sector aiming to offset their GHG emissions.
Negative emissions from BECCS plays an important role in both net-zero scenarios
In the Global Net-zero Scenario, BECCS generation begins in 2035 and grows to reach 51 TWh in 2050, or 4% of total generation. The negative emissions resulting from BECCS are 9 MT in 2035, and 41 MT by 2050 in both net-zero scenarios. We discuss total GHG emissions from the electricity sector later in this section.
In both net-zero scenarios, bioenergy plays an increasingly important role, in electricity as well as in the entire energy system. However, the annual availability of sustainable biomass feedstocks is limited by biological constraints and competition with other economic sectors like forestry and agriculture. An analysis of available biomass resources and our projections of its usage within Canada's energy system shows that the bioenergy used for electricity generation is well within the total resource supply.
Hydrogen
Hydrogen can be used to generate non-emitting electricity. The hydrogen is combusted to turn a turbine, much like a natural gas-fired facility. Currently there is no hydrogen-powered electricity generation in Canada.
In the Global Net-zero Scenario, we do not project any hydrogen use in the power sector as other generating technologies meet the power system’s needs at a lower cost. However, in the Canada Net-zero Scenario, we project a small amount of hydrogen-fueled electricity generation in Alberta late in the projection period. The higher cost of carbon pollution in that scenario makes hydrogen an attractive power generation option in Alberta during peak demand periods. In addition, electricity demand is higher in Alberta in the Canada Net-zero Scenario compared to the Global Net-zero Scenario due to higher oil and natural gas production, increasing electricity demand. Hydrogen generation in Alberta reaches 1.4 TWh, or just less than 1% of total Albertan generation in 2050.
Storage
Storage of electricity, either directly in batteries or other forms like compressed air or pumped hydro storage, can help balance electricity supply and demand. It allows electricity to be stored during times of high production or low use, and then be used when production is low, or use is high. Storage provides a source of complimentary electricity to renewable power sources like wind and solar. Currently, a number of provinces have grid-connected battery storage systems including about 90 MW in Alberta and 50 MW in Ontario.

In both net-zero scenarios, we project growth in battery storage, while other forms of storage are not built. By 2030, we project 1.5 GW of battery storage in the Global Net-zero Scenario, reaching 9 GW by 2050. There is no battery storage built in the Current Measures Scenario.
In EF2023, our electricity modeling focuses primarily on electricity supply and demand. As a result, the incentive to build battery storage facilities is based on storing inexpensive power and then discharging it later at a higher price. Batteries can also provide other functions that support the electricity system, like short-term reliability services. The potential for additional revenue from these services could increase the attractiveness of battery storage beyond what we model in EF2023. In addition, hydrogen production using electricity is an important source of flexible demand in our net-zero scenarios. This source of flexibility provides similar grid-balancing functionality as other storage options. Lower hydrogen production using electricity would mean there is more need for grid-balancing options and could result in greater need for battery and other storage options.
Trade and transmission
Canada is a net exporter of electricity to the U.S., and electricity is also traded between provinces, mainly in eastern Canada. In 2021, Canada exported 60 TWh of electricity and imported 13 TWh. The total aggregated interprovincial electricity flows in 2021 was 47 TWh.
In both net-zero scenarios, net exports of electricity to the U.S. fall modestly from current levels
This decline is in response to growing Canadian electricity demand. Meanwhile, we project the aggregate interprovincial trade increases by about 16% in 2050 compared to 2021 levels, facilitated by some additional transmission capacity between provinces. By connecting the electricity grids of different regions, grid operators can take advantage of regional differences in electricity mixes, available variable renewable energy, and periods of peak electricity demand. Without additional transmission capacity, some individual provinces could need to install more generation or storage capacity than we project in both net-zero scenarios. In the Current Measures Scenario, interprovincial electricity trade grows more slowly. Figure R.24 shows our projections of net exports out of Canada and aggregate interprovincial trade volumes in the Global Net-zero Scenario. International and interprovincial trade remains relatively small when compared to total generation.
Electricity market developments in the U.S. may evolve differently than our projections. More, or less, exports could increase or decrease the incentive to build additional generation capacity in Canada. Likewise, the extent to which additional interprovincial electricity capacity is built would influence the extent provinces can benefit from trade with neighboring provinces and alter how much generation must be built in those provinces to meet growing electricity demand.
Figure R.24: Net exports of electricity and interprovincial trade, Global Net-zero Scenario
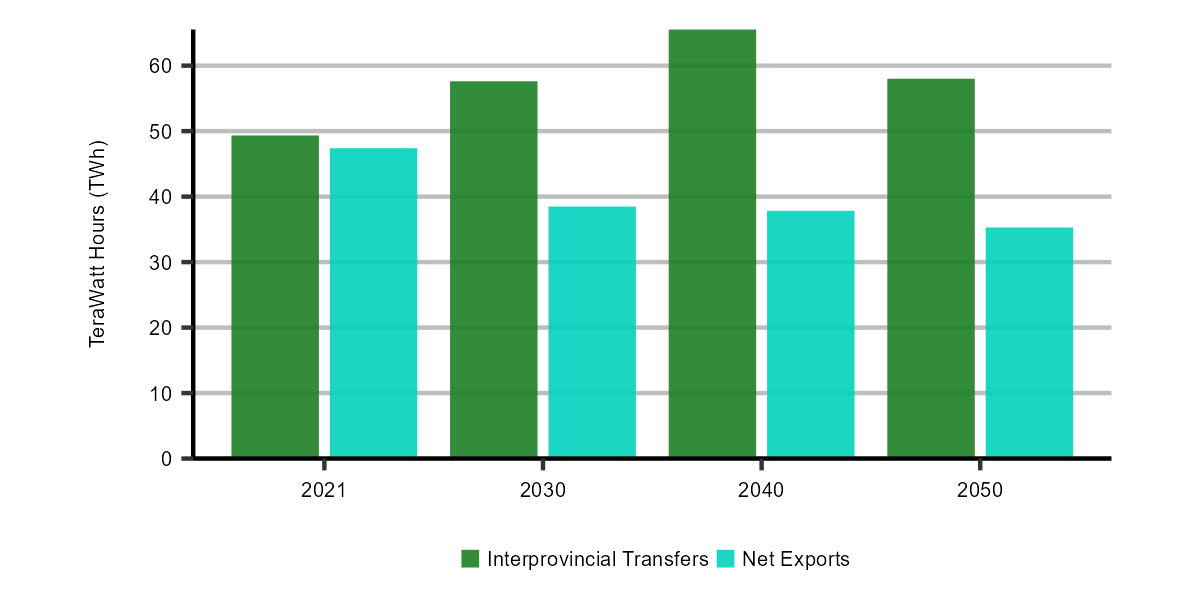
Description
Description: This column chart shows electricity trade in the Global Net-zero Scenario in 2021, 2030, 2040, and 2050. It shows interprovincial transfers and net exports.
Net exports see a gradual decline over the projection period, while interprovincial transfers grow until the peak in 2040, and then decline modestly in 2050.

Electricity production in the Territories and other remote and northern regions
Electricity systems in the Territories and remote and northern regions of some provinces are unique. These regions are not connected to the North American electricity grid, and in many communities, electricity is generated from small diesel-fired stations.
Diesel remains the main fuel source for the Territories in both net-zero scenarios
Electricity generation in Yukon and Northwest Territories is a mix of hydro, natural gas, and diesel-fired generation, and in Nunavut, diesel generation is the sole source of electricity. Combined, the Territories make up less than 1% of Canada’s total electricity generation. In both net-zero scenarios, we project that the current forms of electricity in each territory remain the main sources over the projection period. Currently, diesel is often relied upon in remote communities because it is transportable, energy-dense, and readily available. However, the remoteness of communities can create supply security issues and high transportation costs for fuel. Diesel is also often used for space heating in addition to electricity generation in many of those regions.
Some diesel consumption is offset with wind and solar generation built over the projection period. Combined, the Territories add 86 MW of wind over the projection period, and 118 MW of solar.Footnote 16 Together these represent 18% of generation in the territories by 2050.
Energy use associated with electricity generation
Energy used to generate electricity made up a quarter of total primary energy use in Canada in 2021. We project energy use by the electricity sector to increase nearly 90% by 2050 in the Global Net-zero Scenario, 100% in the Canada Net-zero Scenario, and 30% Current Measures Scenario. Figure R.25 shows our projection of energy use to generate electricity in the Global Net-zero Scenario.
Figure R.25: Energy use to generate electricity by fuel, Global Net-zero Scenario

Description
Description: This stacked area chart shows energy use to generate electricity in the Global Net-zero Scenario over the projection period. The fuel types are biomass, hydro, oil, uranium, coal, natural gas, solar, and wind.
Biomass, hydro, solar, uranium, and wind all see significant growth over time. Coal declines to zero in 2030, and natural gas sees a gradual decline in the 2030s until growing slightly again in the 2040s.
GHG emissions associated with electricity generation

We project that GHG emissions from the electricity sector, which made up 8% of Canada’s emissions in 2021, reaches net-zero by 2035 in both net-zero scenarios. After 2035, the electricity sector becomes a net-negative emitter, resulting in net-negative emissions of 36 MT by 2050 in the Global Net-zero Scenario, and 35 MT in the Canada Net-zero Scenario. Some types of generation result in positive emissions throughout the projection period, including the fraction of emissions CCUS does not capture, diesel generation in remote and northern communities, and limited amounts of unabated natural gas-fired generation. Figure R.26 shows GHG emissions of the electricity sector by fuel in the Global Net-zero Scenario.
Figure R.26: GHG emissions from electricity generation, by fuel, Global Net-zero Scenario

Description
Description: This stacked area chart shows GHG emissions from electricity generation in the Global Net-zero Scenario over the projection period. The fuel sources are bioenergy, coal, natural gas with CCUS, oil, and unabated natural gas.
Coal and unabated natural gas emissions decline sharply until 2030 and 2035, respectively. Bioenergy starts becomes a net-negative GHG emitter starting in the early 2030s, and makes the whole electricity generation sector net-negative by 2050.
Key uncertainties: electricity
Export markets: Electricity market developments in the U.S. will impact the development of Canada’s electricity system. Higher or lower integration with the U.S. power system than we project could impact the amount and type of new electricity generation built in Canada.
Electricity transmission: While our projections suggest building electricity transmission between provinces results in lower total system costs in both net-zero scenarios, building large-scale electricity transmission will be influenced by a diverse range of factors. Less transmission would change the electricity investment outcomes in our scenarios.
Societal preferences: Electricity generation can have positive and negative impacts on the communities around them, including particulate emissions, safety concerns, visual impacts, and competition with other land uses. These factors will influence future electricity outcomes, but are beyond the scope of EF2023.
Oil and natural gas production
Crude oil, natural gas, and natural gas liquids (NGLs) are produced in Canada for domestic use as well as for export. Most of Canada’s crude oil is produced in Alberta, along with significant volumes from Saskatchewan and offshore Newfoundland and Labrador. Nearly all of Canada’s natural gas production is from Alberta and BC.
In this analysis, we project crude oil, natural gas, and NGL production by simulating investment and operational decisions of producers based on our assumptions about international and domestic crude oil and natural gas prices, applicable policies, resource characteristics, and the costs of production, including the costs of various technologies to reduce emissions. The prices of crude oil and natural gas that we assume account for the global supply and demand balance in each scenario. We assume that if Canadian producers can earn a profit, they choose to produce oil and gas.
Crude oil

Canadian crude oil production has been growing steadily for many years, increasing 87% from 2005 to 2019. Production declined by 5% in 2020, largely due to the COVID-19 pandemic. In 2021, production started increasing again and averaged 4.9 million barrels per day (MMb/d) (781 thousand cubic metres per day (10³m³/d)). Production grew again in 2022 and reached its highest level ever at 5.0 MMb/d (800 10³m³/d).
Crude oil production declines in the long term in both net-zero scenarios
Total crude oil production continues to increase after 2022 in all three scenarios in the near term, because of relatively high prices over that period. However, each scenario evolves very differently in the medium and long term. Figure R.27 shows total crude oil production in all three scenarios.
Figure R.27: Crude oil production (including condensate and pentanes plus), all scenarios

Description
Description: This line chart shows the evolution of total crude oil production in million barrels per day in all three scenarios.
Production plateaus in the mid-to-late 2020s and then drops sharply in the Global Net-zero Scenario. Production plateaus a few years later and at a slightly higher level in the Canada Net-zero Scenario. Production plateaus in the mid-2030s at the highest level of all scenarios in the Current Measures Scenario, and then declines modestly in the 2040s.
In the Global Net-zero Scenario, we project that crude oil production peaks in 2026, and then declines steadily thereafter, reaching 1.22 MMb/d (194 10³m³/d) in 2050, a 76% decrease from 2022 levels. In the Canada Net-zero Scenario, production continues to grow until near the end of the decade before beginning to decline, falling to 3.92 MMb/d (623 10³m³/d) by 2050. In the Current Measures Scenario, we project production grows to a peak of 6.20 MMb/d (986 10³m³/d) by 2035, and remains just below that level for the remainder of the projection period.
The differences between these scenarios are mostly explained by the different assumptions we make about the price of crude oil. We describe these assumptions in detail in the previous chapter, Scenarios and Assumptions. In the Global and Canada Net-zero scenarios, we align our assumptions with crude oil prices from the IEA’s WEO2022 scenarios. In the Global Net-zero Scenario, we take the global crude oil price from the IEA’s Net Zero Emissions by 2050 Scenario and in the Canada Net-zero Scenario, we use prices from the IEA’s Announced Pledges Scenario. The prices we assume in the Current Measures Scenario are based on a review of price projections by various other organizations. Table R.2 shows our crude oil price assumptions.
Table R.2: Brent crude oil price assumptions, all scenarios
| 2030 | 2050 | |
|---|---|---|
| Scenario | 2022US$ per barrel | 2022US$ per barrel |
| Global Net-zero | 35 | 24 |
| Canada Net-zero | 64 | 60 |
| Current Measures | 75 | 75 |
Our assumptions about climate policies also affect our projections of crude oil production. All scenarios include all policies currently in place. In the net-zero scenarios, we include any announced but not-yet-implemented climate policies to the extent feasible. These policies include the federal methane regulations, which aim to reduce methane emissions by 75% by 2030, and the oil and gas emissions cap. In both instances, the final policy design was not available before our modeling was complete. As a result, we relied on simplifying assumptions to include these policies in our analysis. Further details on those assumptions are available in Appendix 1: Domestic Climate Policy Assumptions.
Key trends: crude oil production
In the Global Net-zero Scenario, oil production falls by 76% from 2022 to 2050 to 1.22 MMb/d (194 10³m³/d) because global oil demand falls to very low levels, resulting low crude oil prices that challenge the economic viability of many Canadian producers.
In the Canada Net-zero Scenario, production falls 22% from 2022 to 2050 to 3.92 MMb/d (623 10³m³/d), because oil prices are high enough to sustain more production.
CCUS capacity in the oil sands peaks at 27 MT in 2033 in the Global Net-zero Scenario and 49 MT in 2035 in the Canada Net-zero Scenario.
Oil sands emissions fall 94% from 2005 levels by 2050 in Global Net-zero Scenario and 76% from 2005 levels by 2050 in Canada Net-zero Scenario.

How does crude oil production change throughout the projection period?
Discover the data for yourself using our interactive visualization tool. View projected crude oil production.
Canadian crude oil production includes three main types of production: oil sands, conventional, and offshore.
Oil sands production
Oil sands production comes from bitumen deposits located in Alberta, where bitumen is mined in surface pits or produced using wells and steam (called in-situ production). The oil sands made up nearly two-thirds of Canadian production in 2022.
Oil sands production grows at a similar pace in the near term in all three scenarios
Production is between 4 to 7% higher by 2030 compared to 2022 levels depending on the scenario. Most of this growth is from a small number of existing projects who expand their facilities. We project that oil sands production in each of the three scenarios differs considerably after 2030. These differences are mainly driven by our assumptions about global crude oil prices, which are lowest in the Global Net-zero Scenario, higher in the Canada Net-zero Scenario, and highest in the Current Measures Scenario. In addition, climate policies in each scenario influence investment decisions, including how producers use technology to reduce emissions. Figure R.28 shows oil sands production by facility type in all scenarios.
Figure R.28: Oil sands production by type, all scenarios

Description
Description: This stacked area chart shows oil sands production by type over the project period for each scenario. The types are in situ and mined.
Production peaks in the late 2020s in the Global Net-zero Scenario and then declines rapidly. It peaks and the early to mid 2030s in the Canada Net-zero Scenario and then declines modestly. The Current Measures Scenario sees a peak in production in the mid 2030s, followed by stable production over the projection period.
Oil sands production falls after 2030 in the Global Net-zero Scenario
After 2030, oil sands production in the Global Net-zero Scenario begins to steadily decline. This decline is largely because oil prices fall to 2022US$35 per barrel in 2030 and continue to decrease thereafter. Oil prices fall because of much lower global demand for oil as more stringent climate policies are implemented globally, as demonstrated in the IEA’s WEO2022 Net Zero Emissions by 2050 Scenario. In other words, oil producers around the globe are facing a rapidly shrinking market. Though falling prices are the dominant factor, our projections also factor in increasingly strong climate policies in Canada, which reduce emissions but also increase the costs of production.
Only the most efficient projects produce in 2050 in the Global Net-zero Scenario
Over the projection period, falling prices make it increasingly difficult for oil sands producers to recover their operating costs and keep projects running. Operating costs include fuel, maintenance, royalties paid to provincial governments, carbon pollution costs (including any remaining carbon pollution after CCUS is installed, as we assume CCUS captures 90% of emissions from large point sources), and, when necessary, the cost of diluent so bitumen can be diluted and shipped on pipelines. In our analysis, shortly after the total operating costs of a facility exceeds its revenue, it shuts down for the remainder of the projection period. Oil sands facilities that have the highest operating costs begin shutting down early in the 2030s. As oil prices continue to drop, more and more facilities shut down production, and only the lowest-cost projects are still producing in 2050. Oil sands production falls to 1.59 MMb/d (252 10³m³/d) in 2040 and 0.58 MMb/d (91 10³m³/d) in 2050, or 83% lower than in 2022. In-situ production falls faster than mining production because in-situ projects are more emissions-intensive, meaning they have higher carbon costs than oil sands mines.
Production declines less and more slowly in the Canada Net-zero scenario
In the Canada Net-zero Scenario, oil sands production also declines after 2030, but at a slower rate compared to the Global Net-zero Scenario. While global demand for oil falls in the IEA’s WEO2022 Announced Pledges Scenario, demand is still much higher than in their Net Zero Emissions by 2050 Scenario, meaning oil prices are much higher. In the Canada Net-zero Scenario, oil sands production decreases in line with the gradual natural declines in production exhibited by oil sands projects, which become more mature over the projection period. Production in the Canada Net-zero Scenario falls from a peak of nearly 3.64 MMb/d (579 10³m³/d) in 2030 to 2.30 MMb/d (366 10³m³/d) by 2050, or 30% lower than 2022. Like in the Global Net-zero Scenario, in-situ production falls faster than mining production.
Oil sands production grows steadily in the Current Measures Scenario
In the Current Measures Scenario, we project that higher global prices and less stringent future climate policies result in continued growth in oil sands production over the projection period. Expansions of existing projects leads to much of the growth, with some greenfield projects also coming online. Oil sands production rises from 3.29 MMb/d (523 10³m³/d) in 2022 to 3.73 MMb/d (593 10³m³/d) in 2030 and largely holds steady, reaching 3.59 MMb/d (571 10³m³/d) by 2050.
Oil sands producers significantly reduce emissions in both net-zero scenarios
This is due to increasingly strong climate policies, which cause oil sands producers to deploy emission-reduction technology. The primary source of GHG emissions from the oil sands is from burning natural gas, which is used to boil water to create steam for in-situ production and to create hydrogen to upgrade bitumen into synthetic crude oil.
Our modeling projects that CCUS is the most economic choice for many oil sands producers to reduce emissions. We project that oil sands producers retrofit existing projects with CCUS early in the projection period in both net-zero scenarios and install it on any new projects. In the Current Measures Scenario, only a small amount of CCUS is installed. Other decarbonization technologies have potential, like using solvents to help with bitumen recovery or SMRs to generate heat without using natural gas. Given our assumptions about the costs and characteristics of different technologies, CCUS is the primary choice for oil sands producers in both net-zero scenarios. However, our projections could show different decarbonization pathways if these technologies proved less costly or more effective than we assume.
In the Global Net-zero Scenario, we project that 12.5 MT of CO2 is captured annually by 2030, increasing to a peak of 22.5 MT by 2036, as shown in Figure R.29. In the Canada Net-zero Scenario, producers rely even more on CCUS, mostly because oil sands production remains higher, reaching 15.0 MT of emissions captured in 2030 and 45.0 MT in 2037.
Figure R.29: GHGs captured and permanently stored from the oil sands using CCUS, Global and Canada Net-zero scenarios

Description
Description: This stacked column chart shows captured emissions from the oil sands in both net-zero scenarios from 2030 to 2050 in five-year increments. The chart shows captured emissions from in situ and mining & upgrading.
In the Global Net-zero Scenario, GHGs captured peaks around 20 MT in 2035, and then gradually declines until 2050. In the Canada Net-zero Scenario, captured emissions go from around 15 MT in 2030 to over 40 MT by 2040, after which it declines to around 25 MT by 2050.
Overall, GHG emissions in the oil sands peak at 87 MT per year in 2023 in the Global Net-zero Scenario before falling to 61 MT per year in 2030 and 4 MT per year in 2050, a 94% drop from 2005 levels. GHG emissions peak at 88 MT per year in 2023 in the Canada Net-zero Scenario before falling to 55 MT per year in 2030 and to 8 MT per year in 2050. Some producers in the Global Net-zero Scenario choose not to add CCUS because oil prices are too low for them to install it and recover invested capital, and instead produce what bitumen they can before they shut down later in the projection period.
What if carbon capture, utilization and storage (CCUS) technology is more expensive?
CCUS is a suite of technologies that capture CO2, typically from the exhaust of industrial or power facilities. The captured CO2 can then be permanently stored in geological formations deep underground or permanently mineralized in cement. CO2 can also be potentially used to make products like synthetic fuels, rather than storing it. In this “What if” analysis, we focus on the application of CCUS in the oil sands.
Many modeling exercises have identified CCUS as a key technology for reducing emissions from sectors where reducing emissions through other methods like electrification or alternative fuels may be too difficult or costly. In its Net Zero Emissions by 2050 Scenario, the IEA projects CCUS will capture 6.2 gigatonnes of CO2 by 2050, or nearly 17% of global CO2 emissions in 2021. In that scenario, CCUS is mostly used in industry, power generation, and for hydrogen production.
Canada is currently adding more CCUS projects
In Canada, crude oil producers have been injecting captured CO2 into oil wells to enhance recovery rates since the early 1980s. Saskatchewan’s coal-fired Boundary Dam Generating Station added CCUS to one of its units in 2014 and has captured more than 5 MT of GHG emissions since. In Alberta, two carbon capture projects, Quest and Alberta Carbon Trunk Line, were commissioned in 2015 and 2020, respectively, increasing Alberta’s annual carbon storage capacity to 3 MT by the end of 2022. Many new projects proposed in Alberta are described in detail in the CER Market Snapshot: New projects in Alberta could add significant carbon storage capacity by 2030. To encourage CCUS deployment, the federal government announced investment tax credits for CCUS projects that permanently store captured CO2. We include these tax credits in our analysis.
CCUS deployment will depend on costs
In EF2023, we make assumptions about the costs of various technologies, including CCUS, in our oil sands analysis. The model then simulates the operational and investment decisions of oil sands producers based on those assumptions as well as other factors. However, the actual deployment of CCUS will strongly depend on its eventual costs. The costs we assume could be optimistic. In this “What if” analysis, we consider what oil sands production and CCUS deployment in the sector might look like if costs of CCUS are higher and deployment of CCUS is lower. Table R.3 shows the lifecycle costs we assume for the construction and operation of a CCUS facility, including the cost of transporting CO2 in a pipeline, in both net-zero scenarios and for this “What if” analysis.
Table R.3: Lifecycle cost of construction and operation of CCUS facilities in the oil sands, including transportation, Net-zero scenarios and Low CCUS cases
| 2030 | 2050 | |||
|---|---|---|---|---|
| 2022$ per tonne | 2022$ per tonne | 2022$ per tonne | 2022$ per tonne | |
| In-situ | Upgrading | In-situ | Upgrading | |
| Global Net-zero and Canada Net zero Scenario | 117 | 93 | 95 | 76 |
| Global Net-zero and Canada Net-zero Low CCUS cases | 233 | 186 | 191 | 152 |
In this “What if” analysis, the only assumption we change is the cost of CCUS, to see how sensitive oil sands production and emissions are to changes in CCUS cost. We keep our assumptions about policies and crude oil prices the same as in the main net-zero scenarios.
In the Global Net-zero Scenario, higher CCUS costs significantly reduce the use of CCUS
As shown in Figure R.30, producers build much less CCUS in the Global Net-zero Low CCUS Case than in the original scenario. However, as shown in Figure R.31, oil sands production is about the same in 2030. From 2030 to 2050, on the other hand, production falls faster than in the original Global Net-zero Scenario. More producers choose not to build CCUS and face higher operating costs as they pay for increasing costs for carbon pollution. Once those operating costs exceed revenues, projects begin to shut down, and production is 0.47 MMb/d (74 10³m³/d) lower in 2050 in the Global Net-zero Scenario Low CCUS Case. Emissions are 27% higher than in the original scenario in 2030, because less CCUS is installed by then, though are 7% lower in 2050, as production is lower.
Figure R.30: GHG emissions from the oil sands captured using CCUS, Global Net-zero and Canada Net-zero Scenarios and Low CCUS cases

Description
Description: This line chart shows captured emissions from the oil sands in the Oil Sands “What if” Case, for both the net-zero scenarios.
In the two “What if” cases, emissions captured are much lower than in the main scenarios.
Producers delay building CCUS in the Canada Net-zero Scenario Low CCUS Case
In the Canada Net-zero Scenario Low CCUS Case, producers delay adding CCUS because of higher costs, but still build similar amounts by 2050 as in the original scenario as CCUS costs decrease over time. Production from the oil sands is slightly lower in the original scenario, because while oil prices are high enough to keep existing projects running, there is somewhat lower investment in expanding production. Emissions are 33% higher in 2030 than in the original scenario, while they are roughly the same by 2050.
Figure R.31: Oil sands production by type, Global and Canada Net-zero scenario, and total oil sands production, Low CCUS cases

Description
Description: This line chart shows oil sands production in the Oil Sands “What if” Case, for both the Canada Net-zero and Global Net-zero scenarios.
Production peaks in the late 2020s in both net-zero scenarios and “What if” cases. It then drops for the rest of the projection period, slowly in the Canada Net-zero Scenario and significantly in the Global Net-zero Scenario. In the Oil Sands “What if” cases, production follows similar patterns, but the production is slightly lower.
Conventional onshore oil production
Alberta and Saskatchewan produce most onshore, conventional crude oil in Canada, with smaller amounts of production from Manitoba, BC, Northwest Territories, and Ontario. Conventional production was 1.01 MMb/d (160 10³m³/d) in 2022. Conventional crude oil can be classified as light or heavy, depending on the density of the oil. Western Canadian conventional crude oil production is roughly half light and half heavy. Figure R.32 shows conventional crude oil production in all three scenarios, and production by type in the Global Net-zero Scenario.
Figure R.32: Conventional onshore oil production by province and type, Global Net-zero Scenario

Description
Description: This chart shows conventional onshore crude oil production for the Global Net-zero Scenario. Production is broken down by region and type in a stacked area chart. Those regions are Alberta light, Alberta heavy, British Columbia light, Manitoba light, Saskatchewan light, and Saskatchewan heavy. The stacked area chart is compared with line charts representing total production for the Canada Net-zero and Current Measures scenarios.
After peaking in the mid-to-late 2020s in both net-zero scenarios, production declines in Global Net-zero and increases modestly in the Canada Net-zero Scenario until it plateaus in the 2040s. Production keeps growing in the Current Measures Scenario, until it plateaus in the late 2040s.
In all three scenarios, conventional crude oil production increases toward 2025 as relatively high prices sustain drilling activity and production. Much of this growth is from tight oil in Alberta and Saskatchewan, and heavy oil production in Saskatchewan, particularly from thermal oil projects.
Conventional oil production declines after 2026 in the Global Net-zero Scenario
We project production to peak relatively soon in the Global Net-zero Scenario, reaching 1.18 MMb/d (188 10³m³/d) by 2026. After 2026, production declines steadily through the remainder of the projection period. Steadily declining crude oil prices reduces revenues for oil producers and results in less drilling for new production in following years, meaning not enough new production comes online to replace production declines in existing wells. By 2050, conventional crude oil production is 0.47 MMb/d (74 10³m³/d), 54% lower than in 2022. Most of the remaining production in 2050 is light crude oil, mainly because of declines in heavy oil production.
Production remains steady in the Canada Net-zero Scenario, and grows in the Current Measures Scenario
Conventional production continues to increase in the medium term in the Canada Net-zero Scenario, largely due to higher crude oil prices. Production increases gradually, reaching 1.22 MMb/d (195 10³m³/d) 2030 and staying near those levels until 2050. Conventional crude oil production grows the most in Current Measures Scenario, rising to 1.60 MMb/d (255 10³m³/d) in 2050.
Conventional oil is more resilient compared with the oil sands in the Canada Net-zero Scenario
Overall, in the Canada Net Zero Scenario, conventional production remains relatively resilient when compared to oil sands production, which falls. This is largely because the two sectors have very different cost structures and produce oil very differently. Projects in the oil sands have very high up-front costs and take years to build. In addition, oil sands production rates tend to decline slowly over the multi-decade life of a project, though this decline can be slowed if additional capital is invested. These factors mean that oil sands projects are built on the basis of recovering their upfront investments over a long period of time, and project proponents must consider the long-term uncertainty about global oil demand and crude oil prices in their investment decisions. Conventional producers, on the other hand, have a shorter time horizon to consider in their investment decisions. This is because tight oil wells, which make up most conventional wells being drilled today and over the projection period, produce most of their oil in the first few years after being drilled. In the Canada Net Zero Scenario, conventional producers respond to relatively high prices by drilling enough new wells to maintain relatively flat production through most of the projection period.
In both net-zero scenarios, conventional oil producers reduce emissions in response to the climate policies that we assume like regulations to reduce methane emissions and the oil and gas emissions cap.
Compared to the oil sands, conventional oil production burns relatively little fuel, although it has higher methane emissions. The exception is Saskatchewan’s thermal-heavy oil projects, which use natural gas much like Alberta’s in-situ oil sands projects. In both net-zero scenarios, producers make technological and process changes, like restricting venting levels from devices like compressors and implementing leak detection and repair programs. We also project that, where feasible, the sector uses more electricity for production and processing.
Availability of crude oil export pipeline and rail capacity
A key issue for Canada’s energy system over the last ten years has been export capacity of western Canadian oil export pipelines and crude-by-rail. When total export capacity is full, price differences between Canadian oil markets and our export markets expand, particularly during unexpected outages, which causes western Canadian oil producers to earn less revenue than they otherwise would. Figure R.33 is a simplified, illustrative comparison of our projected western Canadian crude oil supply available to export and an illustrative level of total export capacity from pipelines, planned pipeline expansions, and structural rail.Footnote 17 Available capacity on existing pipeline systems could be higher or lower than reflected in Figure R.33, because pipeline systems evolve over time. The level of structural crude-by-rail could also be higher or lower than reflected in this figure.
Comparing oil available for export and the amount of export capacity helps us to understand whether pipeline constraints might affect crude oil production. We do not, however, adjust projected crude oil production or what we assume for western Canadian oil prices based on potential constraints. That said, our near-term oil sands projections are largely based on publicly available producer investment plans, which could include expectations about future export capacity.
Crude oil available for export stays below export capacity in both net-zero scenarios

In the Global Net-zero Scenario, western Canadian crude oil available for export rises in the near term before falling after 2030, staying below the total export capacity throughout the projection period.
In the Canada Net-zero Scenario, western Canadian crude oil available for export rises more in the near term and remains higher than in the Global Net-zero Scenario after 2030, though still remains below export capacity. Declining demand for RPPs in western Canada reduces demand for oil at local refineries, which leaves more production available for export. In the Current Measures Scenario, supply comes close to, but does not exceed, export capacity for much of the projection period, peaking in 2035, and declining gradually thereafter.
EF2023 does not explore the complex interactions between pipelines, energy supply, and energy demand
For example, some spare pipeline capacity can benefit crude oil producers by increasing flexibility as it could help producers more easily switch where they ship their oil, and therefore find higher values for their production. Spare capacity can also help ship oil that might otherwise back up into western Canada during pipeline maintenance or unplanned outages. On the other hand, excess capacity and long-term underutilization of pipelines could result in higher pipeline tolls for crude oil producers. Analysis of these considerations is beyond the scope of EF2023. We caution readers from drawing definitive conclusions from the illustrative comparison shown Figure R.33.
It is also important to note that estimates of total available pipeline capacity and the level of structural rail is uncertain and the result of many key assumptions. Table R.4 describes the assumptions underpinning Figure R.33.
Figure R.33: Illustrative export capacity from pipelines and structural rail, crude oil pipeline capacity vs. total supply available for export, all scenarios

Description
Description: This line chart shows total oil supply available for export in the three scenarios, and compares it with total pipeline capacity and structural rail as an area chart behind the lines.
The chart shows that total supply available for export does not exceed total pipeline capacity and structural rail, despite being close in the Canada Net-zero and Current Measures scenarios in the mid-2030s. After the mid-2030s, total supply available for export begins to decline in all three scenarios, with the fastest decline in the Global Net-zero Scenario, moderate declines in the Canada Net-zero Scenario, and gradual declines in the Current Measures Scenario.
Table R.4: Pipeline capacity assumptions for Figure R.33
| Name | Takeaway capacity (current or timing as noted) (Mb/d) | Capacity assumptions |
|---|---|---|
| Enbridge Mainline | 3,290 | Stated capacity includes the fully completed Line 3 Replacement Project which added 370 Mb/d of capacity to the Enbridge Mainline in late 2021. |
| Keystone | 590 | Capacity held fixed over the projection period. The cancelled Keystone XL project is not included in Figure R.33. |
| Trans Mountain | 300 | Capacity is held fixed over the projection period. |
| Trans Mountain Expansion | 590 | The Trans Mountain Expansion Project adds capacity starting in the first quarter of 2024 and increases to full capacity a few months later. This includes use of drag-reducing agents, which increase the capacity of the existing Trans Mountain line by 50 Mb/d. |
| Express | 310 | Capacity held fixed over the projection period. |
| Milk River | 97 | Capacity held fixed over the projection period. |
| Aurora/Rangeland | 44 | Capacity held fixed over the projection period. |
| Structural Rail | 120 | Capacity held fixed over the projection period. |
| Total | 5,363 |
Offshore oil production
Offshore oil production comes from wells drilled in Canada’s offshore areas. Currently only Newfoundland and Labrador produces offshore oil. Offshore production was 0.23 MMb/d (37 10³m³/d) in 2022. While some production currently comes from Hibernia and other nearby fields, most offshore production now comes from the Hebron field, which came online in late 2017.
In all three scenarios, the Bay du Nord offshore project comes online in the late 2020s, increasing Newfoundland and Labrador’s oil production. As shown in Figure R.34, the amount of production we project from the Bay du Nord facility varies by scenario, with the least amount of new production coming online in the Global Net-zero Scenario and the most coming online in the Current Measures Scenario. This is because oil prices in 2030 and later are lowest in the Global Net-zero Scenario and highest in the Current Measures Scenario.
Figure R.34: Offshore oil production, all scenarios
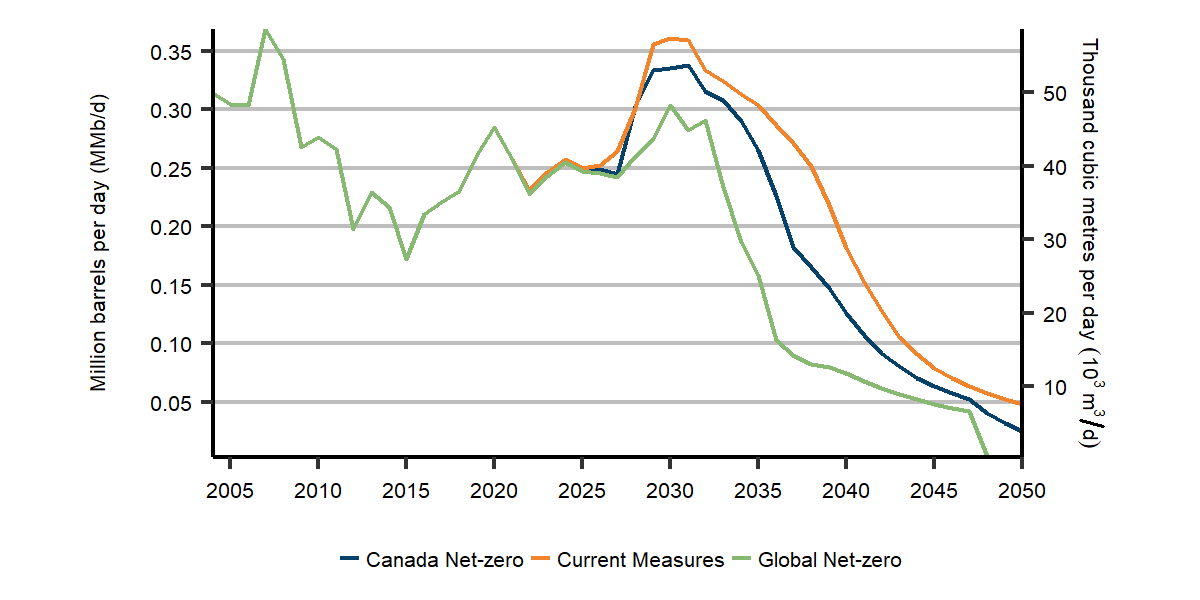
Description
Description: This line chart shows Newfoundland offshore crude oil production in the three scenarios.
Production increases in the three scenarios starting in the mid-2020s, especially in the Current Measures and Canada Net-zero scenarios. Production declines in the early 2030s until reaching zero in the Global Net-zero Scenario in the late 2040s and around 0.05 MMb/d in the Current Measures Scenario in 2050.
GHG emissions from offshore oil production peak around 2030 in all three scenarios, and then decrease toward 2050. In particular, GHG emissions decline faster than production in all three scenarios. This decrease is because older projects in Newfoundland and Labrador’s offshore tend to have higher emission intensities and shut down before newer projects, which have lower emission intensities. This means the average emission intensity for a barrel of offshore oil falls over time, accelerating the decline in total emissions. Emissions fall to less than 5% of 2019 levels by 2050 in both net-zero scenarios.
Key uncertainties: crude oil
The pace of global climate action: Canada exports most of its oil production, meaning our producers depend on markets outside of Canada to buy most of our oil supply. Demand for Canadian oil depends very strongly on how aggressively the world pursues emission reductions.
Technology used to decarbonize the oil sands: In EF2023, the oil sands mainly use CCUS to decarbonize. However, if CCUS costs, and the costs of other emission-reduction technology, like solvents and SMRs, do not significantly fall, or these technologies turn out to be inadequate, the oil sands may find decarbonization even more challenging. In a rush to decarbonize the sector, constraints on labour and supplies might prevent costs from falling as much as we assume.
Western Canadian export capacity: Export capacity from western Canada consists of several pipelines, as well as rail and marine vessels. Interruptions or reductions to pipeline capacity, temporary or permanent, can affect western Canadian prices and production.

How do crude oil prices change over the projection?
Discover the data for yourself using our interactive visualization tool. View projected crude oil production and prices.
Natural gas
Alberta and BC produce most of the natural gas in Canada, with smaller amounts of production from Saskatchewan, Ontario, Northwest Territories, and New Brunswick. Natural gas production grew from 13.9 billion cubic feet per day (Bcf/d) (394 million cubic metres per day (106m³/d)) in 2012 to 16.1 Bcf/d (456 106m³/d) in 2021, and to 17.3 Bcf/d (490 106m³/d) in 2022, because natural gas and natural gas liquid (NGL) prices rose significantly in 2021 after Russia invaded Ukraine.
Most natural gas in Canada comes from tight gas, which is from reservoirs that need to be hydraulically fracturedDefinition* to flow at economic rates. Most tight gas in Canada comes from the Montney Formation of BC and Alberta. In 2022, the Montney Formation produced 8.1 Bcf/d (228 106m³/d), just less than half of Canada’s gas production and up from 0.8 Bcf/d (23 106m³/d) in 2010.
Key trends: natural gas production
In the Global Net-zero Scenario, gas production falls by over two thirds from 2022 to 2050, mostly because natural gas prices fall to much lower levels.
In the Canada Net-zero Scenario, production falls 24% from 2022 to 2050, declining less than in the Global Net-zero Scenario due to somewhat higher prices for natural gas and higher liquified natural gas (LNG) export assumptions.
The Montney Formation produces more than half of Canada’s total gas production in all three scenarios starting in 2025, and more than 60% in 2050.

How does gas production change throughout the projection period?
Discover the data for yourself using our interactive visualization tool. View projected gas production.
Our projections for natural gas production largely depend on price
Prices determine producer revenues and capital available to potentially invest in drilling new wells from year to year. Like crude oil prices, our natural gas price assumptions in both net-zero scenarios are from the IEA’s WEO2022 scenarios, and the assumptions in the Current Measures Scenario are based on a review of price projections by various other organizations. Table R.5 shows our natural gas price assumptions. A related factor that influences our projections is the difference, or differential, between the Henry Hub gas price and local prices in western Canada. Factors such as bottlenecks on Canadian pipeline systems have affected this differential in the past. Differentials that vary from what we assume could cause production to differ from our projections.
Table R.5: Henry Hub natural gas price assumptions, all scenarios
| 2030 | 2050 | |
|---|---|---|
| Scenario | 2022US$ per MMBtu | 2022US$ per MMBtu |
| Global Net-zero | 2.00 | 1.80 |
| Canada Net-zero | 3.70 | 2.60 |
| Current Measures | 3.75 | 4.40 |
Our natural gas projections depend on our assumptions about LNG exports. We describe our assumptions about LNG in detail in the Scenarios and Assumption chapter. In the Global Net-zero Scenario, we assume LNG exports begin in 2025, reaching 2.0 Bcf/d (57 106m³/d) by 2029, and then dropping to 0.3 Bcf/d (8 106m³/d) by 2046 in response to falling LNG demand globally. In the Canada Net-zero Scenario, LNG exports reach 3.8 Bcf/d (108 106m³/d) by 2030. In the Current Measures Scenario, LNG exports are the highest, reaching 4.6 Bcf/d (131 106m³/d) by 2034.
In the Global Net-zero Scenario, Canadian production peaks at 17.4 Bcf/d (492 106m³/d) in 2023, because of relatively high gas prices in 2021 and 2022. After staying near those levels until 2026, production steadily falls to 5.5 Bcf/d (156 106m³/d) in 2050, because of lower investment in drilling new wells. Producer revenues decrease, largely because of lower natural gas prices, but also higher costs related to reducing emissions and complying with various climate policies.
Natural gas production declines in the net-zero scenarios, and rises in the Current Measures Scenario
In the Canada Net-zero Scenario, production rises to 17.7 Bcf/d (500 106m³/d) in 2030, because natural gas prices and LNG exports are higher than in the Global Net-zero Scenario. Production then falls to 11.0 Bcf/d (310 106m³/d) in 2050, largely because of falling gas prices which reduces producer revenue and investment in drilling new gas wells. In the Current Measures Scenario, as gas prices grow from 2023 to 2050, LNG exports are higher than in the other two scenarios, and climate policies are less stringent than in the two net-zero scenarios, and production rises to 21.5 Bcf/d (607 106m³/d) in 2050.
Montney Formation production grows and then falls by 2050 in both net-zero scenarios
In all scenarios, the geographic location of production shifts over the projection period. BC has grown its share of total Canadian natural gas production over the past several years and this continues over the projection period, as shown in Figure R.35. A key driver of this is the growth of production from the Montney Formation, located in northwest BC and northeast Alberta. Most of the production from Montney is currently from within BC, and we project that this continues to be the case over the projection period in all three scenarios. As shown in Figure R.36, production from the Montney increased from 0.8 Bcf/d (23 106m³/d, or 6% of Canadian production) in 2010 to 8.1 Bcf/d (228 106m³/d, or 47% of Canadian production) in 2022. In all three scenarios, the Montney Formation’s share of production increases steadily, meaning that Canada’s natural gas production is becoming more concentrated in one area. Production from the Montney Formation falls to 3.4 Bcf/d (98 106m³/d) in 2050 in the Global Net-zero Scenario, 6.8 Bcf/d (194 106m³/d) in the Canada Net-zero Scenario, and increases to 14.8 Bcf/d (420 106m³/d) in the Current Measures Scenario.
Figure R.35: Natural gas production by province, Global Net-zero Scenario, and total production, Canada Net-zero and Current Measures scenarios
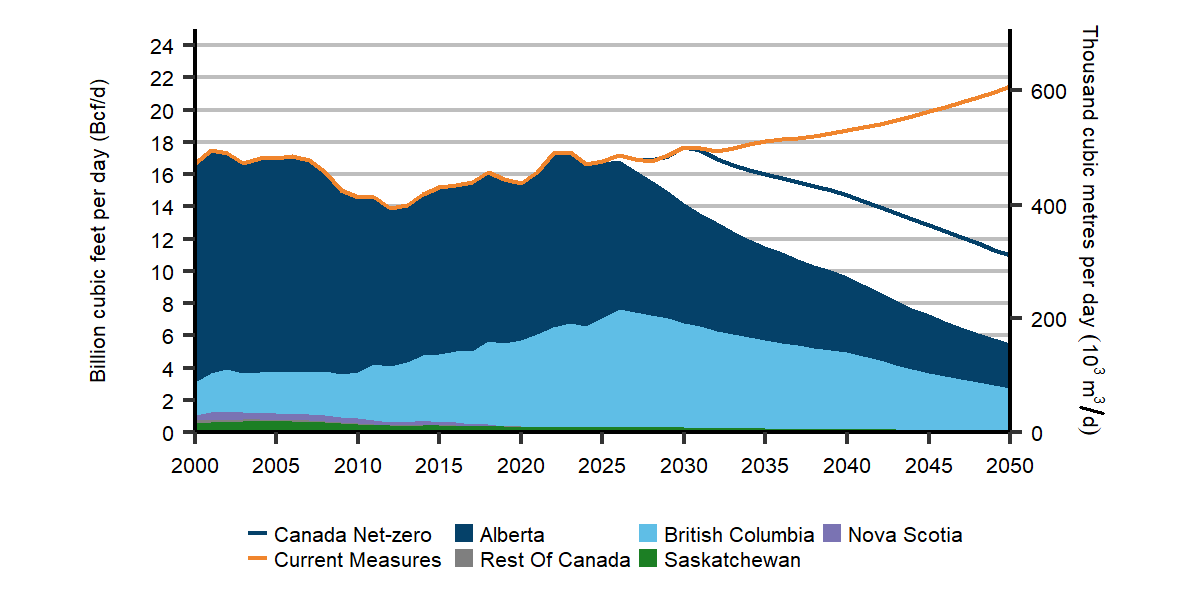
Description
Description: This chart shows natural gas production in the Global Net-zero Scenario compared with the Canada Net-zero and Current Measures scenarios. Production is broken down by region, which are Alberta, BC, Nova Scotia, Saskatchewan, and the Rest of Canada for the Global Net-zero Scenario as a stacked area chart. The total production from the other two scenarios is represented by line charts.
Natural gas production plateaus in the first half of the 2020s in the Global Net-zero Scenario, after which it declines gradually over the projection period. The Canada Net-zero sees a similar pattern, with the plateau reached in the mid-2030s instead. The Current Measures Scenario sees production increases throughout the projection period. Alberta and BC account for most of the future natural gas production.
Figure R.36: Natural gas production by type, Global Net-zero Scenario, and total production, Canada Net-zero and Current Measures scenarios

Description
Description: This chart shows natural gas production by type in the Global Net-zero scenario, compared with total production in the Canada Net-zero and Current Measures scenarios. Production is broken down by type, and includes coal bed methane, conventional, Duvernay shale, Montney tight, other tight, other WC shale, and solution gas for the Global Net-zero scenario as a stacked area chart, and the total production from the other two scenarios is represented by line charts.
Total production plateaus in the early 2020s in the Global Net-zero Scenario, and then declines gradually. Production follows a similar pattern in the Canada Net-zero Scenario, but plateaus in the early 2030s. Production in the Current Measures Scenario keeps growing over the projection period. Montney tight production accounts for most natural gas production in the projection period.
Emissions from natural gas production continue to decline in the net-zero scenarios
GHG emissions from the production and processing of natural gas peaked in 2007. In the Global Net-zero Scenario, emissions decline to 8 MT in 2050, a decrease of almost 90% from 2021 levels. This is largely because of falling natural gas production, but also because of various climate policies, including federal regulations aiming to reduce methane emissions by 75% by 2030. Electrification of the sector, where feasible, and the use of CCUS at larger natural gas-processing plants also contribute to declining emissions. The Canada Net-Zero Scenario follows a similar trend, with emissions falling to 9 MT in 2050. In the Current Measures Scenario, emissions decline to 2030 before rising to 42 MT in 2050 as production grows, and because policies do not become more stringent after 2030.
Key uncertainties: natural gas
The pace of global climate action: Canada exports much of its natural gas production, meaning producers depend on markets outside of Canada to buy our gas supply. Demand for Canadian gas depends very strongly on how aggressively the world pursues emission reductions.
Technology used to decarbonize the oil sands: We project that CCUS is key to decarbonizing the oil sands, which allows natural gas to remain the main fuel supply for in-situ oil sands production. However, other potential technologies exist to decarbonize the oil sands, like solvents and SMRs, which do not consume natural gas. We do not project that these technologies are applied in the oil sands but if they become more attractive, western Canadian demand for natural gas could significantly fall, reducing natural gas prices and production. On the other hand, increased demand for solvents like propane and butanes could increase demand for NGLs, therefore increasing drilling for natural gas as a result.
Discounts for western Canadian natural gas: Differentials for western Canadian natural gas relative to Henry Hub could be affected by many things, including pipeline bottlenecks.
LNG exports: Small changes to economics can alter which projects are built and when, or when projects might shut down. In the Global Net-zero Scenario, the rapid decline in LNG exports from 2044 to 2046 could happen earlier if Canadian LNG exports are more costly relative to remaining global LNG supply, or exports could continue past 2050 if secured through long-term contracts.
How do gas prices change over the projection?
Discover the data for yourself using our interactive visualization tool. View projected natural gas production and prices.
Natural gas liquids
NGLs are produced along with natural gas, as well as from oil sands and refinery processes. Natural gas production is the main source of NGL production in Canada. Demand for certain NGLs adds value to natural gas production and is a driver of natural gas drilling. Raw natural gas at a wellhead is comprised primarily of methane, but often contains NGLs such as ethane, propane, butanes, pentanes, and condensate.
Key trends: NGLs
In the Global Net-zero Scenario, production rises to 1.29 MMb/d (205 10³m³/d) by 2026 before falling to 0.46 MMb/d (73 10³m³/d) in 2050 following natural gas production trends.
NGL production is higher in the Canada Net-zero Scenario, increasing to 1.45 MMb/d (230 10³m³/d) by 2030 before falling to 0.86 MMb/d (136 10³m³/d) in 2050.
NGL production declines in the net-zero scenarios and grows in the Current Measures Scenario
Figure R.37 shows total NGL production by type in the Global Net-zero Scenario along with total combined NGL production in the Canada Net-zero and Current Measures scenarios. Production grows around 4% from 2022 to 2026 in the Global Net-zero Scenario, reaching 1.29 MMb/d (205 10³m³/d). Much of this production growth is condensate and pentanes plus. Condensate and pentanes plus are added to bitumen as a diluent to enable it to flow in pipelines and be loaded on to rail cars. Steady demand for condensate encourages natural gas drilling to focus on NGL-rich areas.
Figure R.37: NGL production, by type, Global Net-zero Scenario, and total NGL production, Canada Net-zero and Current Measures scenarios
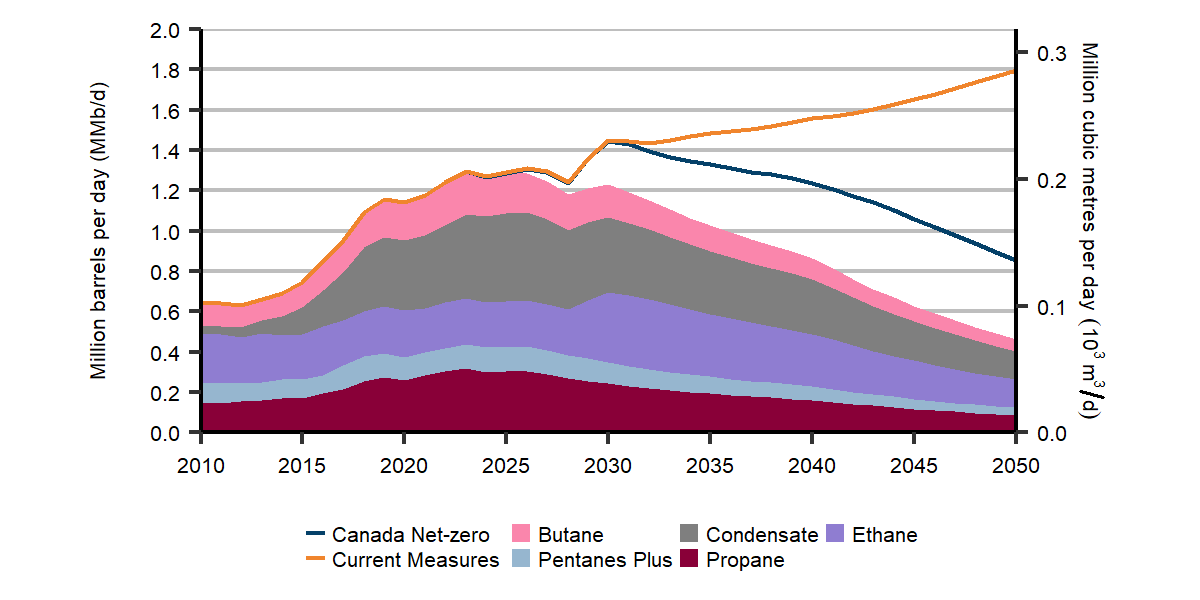
Description
Description: This chart shows NGL supply by type in the Global Net-zero Scenario, compared with total NGL production the Canada Net-zero and Current Measures scenarios’ total production levels. For the Global Net-zero Scenario, production is broken down by type, and includes butane, condensate, ethane, pentanes plus, and propane in a stacked area chart. Total production in the other two scenarios is represented by line charts.
Production plateaus in the mid-2020s in the Global Net-zero Scenario, after which it declines gradually over the projection period. Production plateaus in the early 2030s in the Canada Net-zero Scenario, and then follows a similar pattern. Production in the Current Measures Scenario keeps growing over the projection period.

As low gas prices reduce gas drilling and gas production, total NGL production declines after 2030 in the Global Net-zero scenario. NGL production continues to fall, reaching to 0.46 MMb/d (73 10³m³/d) in 2050, 63% lower than in 2022.
In the Canada Net-zero Scenario, NGL production grows by 16% from 2022 to 2030, and declines gradually through the remainder of the projection period. Like the Global Net-zero Scenario, NGL production growth is dominated by condensate, though propane and butanes production grow as well. In the Current Measures Scenario, total NGL production grows 45% from 2022 to 2050, reaching 1.80 MMb/d (286 10³m³/d). In this scenario, NGL production growth is a result of natural gas production growth.
Key uncertainties: NGLs
Natural gas production and LNG exports: NGLs are a byproduct of natural gas production, and as such, any uncertainty discussed in the natural gas section applies for NGL projections.
Oil sands production: The rate at which production grows in the oil sands, and the amount of diluent blending required, will affect the demand for condensate. Likewise, if solvents are widely adopted in the oil sands to reduce GHG emissions, demand for propane and butanes would increase.
Petrochemical development: There is potential for ethane recovery to expand if there is an increase in the ethane extraction capacity and petrochemical facilities. This increase could be spurred by government programs, such as royalty credit incentives for petrochemical facilities in Alberta’s Petrochemicals Diversification Program.
Global exports: Several large-scale facilities have been approved by provincial and federal regulators to export some NGLs from the BC coast. The amount and composition of the NGLs exported at proposed and existing terminals could impact domestic NGL prices and the attractiveness of drilling for NGL-rich natural gas.
Energy use in the oil and gas sector
Canadian crude oil, natural gas, and NGLs are large sources of energy for domestic and international markets. However, the process of producing, processing, transporting, and refining these products requires a significant amount of energy. In 2021, the sector used around 3,000 petajoules (PJ) of energy, 27% of total Canadian end-use energy consumption.Footnote 18 Most of this energy was natural gas, not only in the oil sands, but to power oil and gas wells, natural gas processing, petroleum refining, and gas pipelines. Propane or electricity is often used to fuel operations at oil and gas wells, and electricity typically powers oil pipelines.
Over the projection period, the amount of energy used in each scenario is driven by the amount of future production, how fast energy efficiency improves, and additional energy used to run CCUS equipment, if any. Also, energy use to refine petroleum products and transport natural gas to end-users is driven largely by the domestic demand for those commodities.
In all three scenarios, energy use in the oil and gas sector grows in the near term
Energy use in the sector peaks in 2023 in the Global Net-zero Scenario and then falls by 75% by 2050 from 2021 levels, largely in line with falling production levels. In the Canada Net-zero Scenario, demand falls 47% from 2021 to 2050, as higher crude oil production results in higher demand for energy in the sector compared to the Global Net-zero Scenario. In both net-zero scenarios, falling Canadian demand for RPPs and natural gas reduce energy use for refining and transporting energy to end-users. Increased deployment of CCUS technology impacts energy use in both net-zero scenarios. Capturing, compressing, and transporting CO2 from the exhaust stream of facilities takes energy. By 2050, energy used to power CCUS makes up 5% of oil and gas sector demands in the Global Net-zero Scenario, and 7% in the Canada Net-zero Scenario. In the Current Measures Scenario, efficiency improvements offset increased production levels and energy required for CCUS, and energy use in 2050 is 6% lower than in 2021. Figure R.38 shows total energy use in the oil and gas sector.
Figure R.38: Energy use in the oil and gas sector by fuel, 2021 and all scenarios in 2050
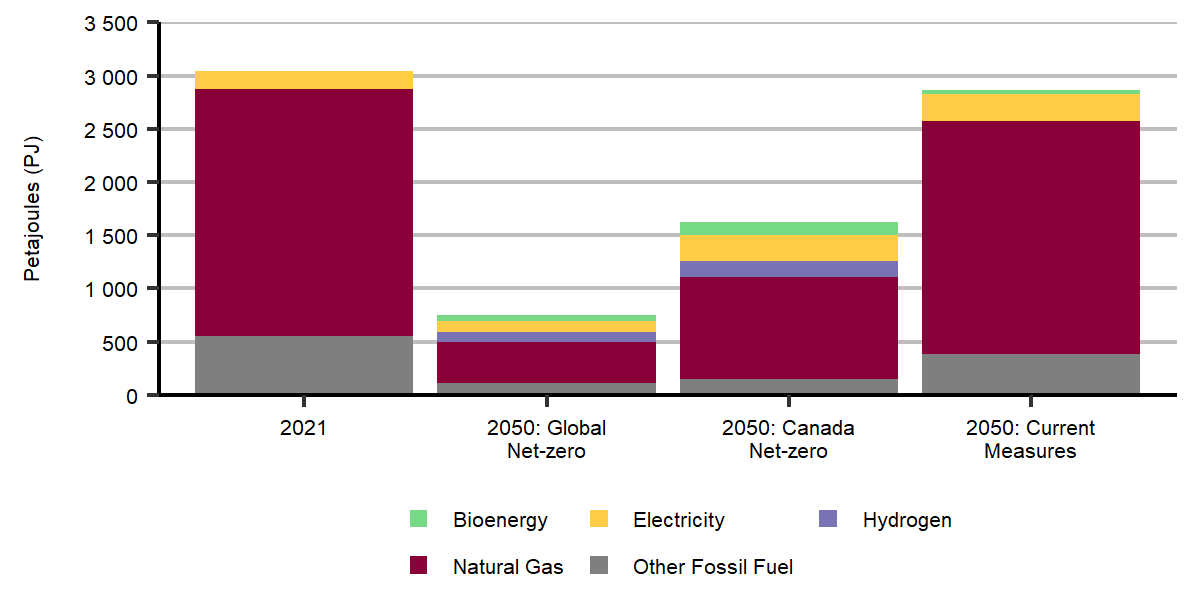
Description
Description: This stacked column chart shows oil and gas end-use demand in 2021 and in 2050 in the three scenarios. Demand is broken down by fuel type, and includes bioenergy, electricity, hydrogen, natural gas, and other fossil fuel.
Oil and gas end-use demand is lower in 2050 than in 2021 in all scenarios. The Global Net-zero Scenario sees the largest decrease, followed by the Canada Net-zero Scenario and the Current Measures Scenario.
GHG emissions from the oil and gas sector
We describe the trends driving GHG emissions from the oil and gas sector in the previous sections of this chapter. In total, we project that GHG emissions from the oil and gas sector in the Global Net-zero Scenario fall from 189 MT in 2021 to 17 MT in 2050, a 90% decrease. In the Canada Net-zero Scenario, emissions fall to 32 MT in 2050, or 83% lower than 2021 levels. This includes GHG emissions from the production and transmission of oil and natural gas, and liquefaction of natural gas, refining of crude oil, and distribution of natural gas to end-users.
In both net-zero scenarios, CCUS and methane mitigation play an important role reducing emissions in the oil and gas sector. In the Canada Net-zero Scenario, CCUS is particularly important because production of oil and natural gas is higher due to higher global demand and oil and gas prices. We also project some electrification of conventional oil and natural gas production currently met by fossil fuels. Some GHGs are still emitted in both net-zero scenarios by 2050 but Canada achieves net-zero because of negative emissions occurring in other sectors.
In the Current Measures Scenario, emissions from the oil and gas sector decline moderately over the projection to 149 MT in 2050, 21% lower than in 2021. This scenario has the highest oil and natural gas production. At the same time, our assumption of limited future climate action in Canada in that scenario means the industry applies less emission reduction technologies compared to the net-zero scenarios.
Figure R.39: GHG emissions in the oil and gas sector, all scenarios
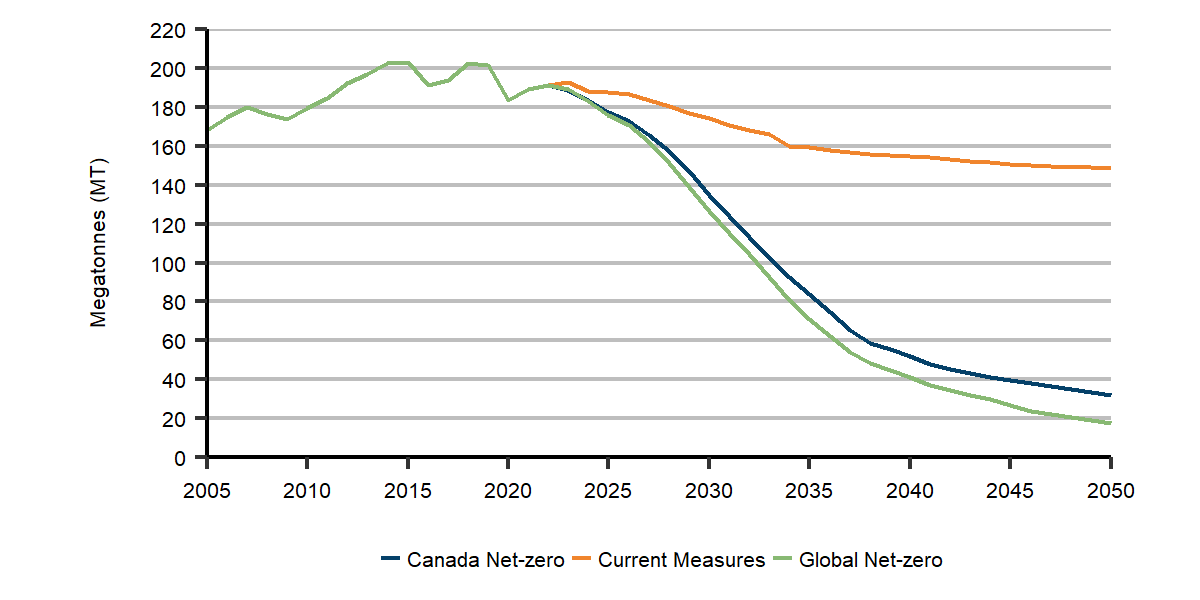
Description
Description: This line chart shows oil and gas emissions in all three scenarios over the projection period.
Emissions decline rapidly until 2050 in both net-zero scenarios. Emissions decline at a slower rate in the Current Measures Scenario.
Hydrogen
There is increasing interest in using low-carbon hydrogen as a fuel in both Canada and globally. Like electricity, hydrogen can be an energy carrier that transports useable energy created elsewhere to another location. When consumed, hydrogen does not result in GHG emissions. For more information on the fundamentals of hydrogen, see the Government of Canada’s Hydrogen Strategy, released in late 2020. Our focus in this section is on hydrogen use as an energy carrier and its production by methods that emit little or no CO2.
We make projections about hydrogen use by simulating the energy choices of households and businesses, including the energy technologies and fuels they choose to use. We model hydrogen production to meet hydrogen use and export requirements. The type of hydrogen produced to meet that demand is based on technology costs, and the fuel availability and cost in different regions.

We project that low-emitting hydrogen use reaches over 8.5 MTFootnote 19 in 2050 in the Global Net-zero Scenario, about 12% of total energy use demand. In the Canada Net-zero Scenario, hydrogen use is slightly higher at nearly 9.5 MT. In the Current Measures Scenario, low-emitting hydrogen demand is less than 1 MT by 2050, as fossil fuels remain an economically attractive energy source for many applications suitable for hydrogen.
We assume some hydrogen exports in all scenarios, reaching 5 MT in the Global Net-zero Scenario in 2050, 4.5 MT in the Canada Net-zero Scenario, and 2.5 MT in the Current Measures Scenario.
Key trends: hydrogen
Hydrogen becomes a significant part of energy use in the net-zero scenarios, especially in the industrial and transportation sectors.
Production of low-emitting hydrogen comes from a mix of technologies, including natural gas with CCUS, electrolysis, and biomass gasification.
Hydrogen use
There are a wide variety of potential uses for hydrogen as an energy carrier in the energy system, ranging from transportation fuel, energy for building or industrial heat, or for electric power generation. Canada currently uses about 3 MT of hydrogen for industrial applications like oil sands upgrading and chemicals and fertilizer production. This existing hydrogen is counted as natural gas in Canada’s energy balances, and in our data appendices. This production uses natural gas as a feedstock and results in CO2 emissions that are not captured.
As discussed in the Energy Demand section of this chapter, we project hydrogen to become a key fuel in the heavy freight and industrial sectors in both net-zero scenarios. In the Global Net-zero Scenario, hydrogen use in transportation reaches nearly 5 MT by 2050, or nearly 30% of energy use in the transportation sector. Hydrogen primarily fuels long-haul transportation in heavy trucks, marine shipping, and hydrogen-based fuels are used to help decarbonize aviation. Hydrogen is used in industries like chemicals, iron and steel, and petroleum refining. Total industrial hydrogen use reaches 2.5 MT in the Global Net-zero Scenario, and 3 MT in the Canada-Net-zero Scenario, by 2050.
In both net-zero scenarios, hydrogen use grows modestly to 2035 and accelerates thereafter
We also project some use of hydrogen for building heating in both net-zero scenarios, but uptake is limited to blending with natural gas to be used in a natural gas furnace. However, the market share of natural gas furnaces declines over the projection period in the net-zero scenarios. As discussed in the Electricity section, we do not project any hydrogen use in the power sector in the Global Net-zero Scenario, and a small amount in the Canada Net-zero Scenario, reaching 0.13 MT by 2050. We also project that hydrogen produced from natural gas without capturing CO2 declines and is replaced by low-emitting hydrogen sources. Figure R.40 shows hydrogen demand by end-use in the Global Net-zero Scenario. In total, hydrogen’s role in Canada’s energy system is modest until 2035, at which point it accelerates and grows steadily to 2050 in the net-zero scenarios.
Figure R.40: Hydrogen demand by end-use, Global Net-zero Scenario
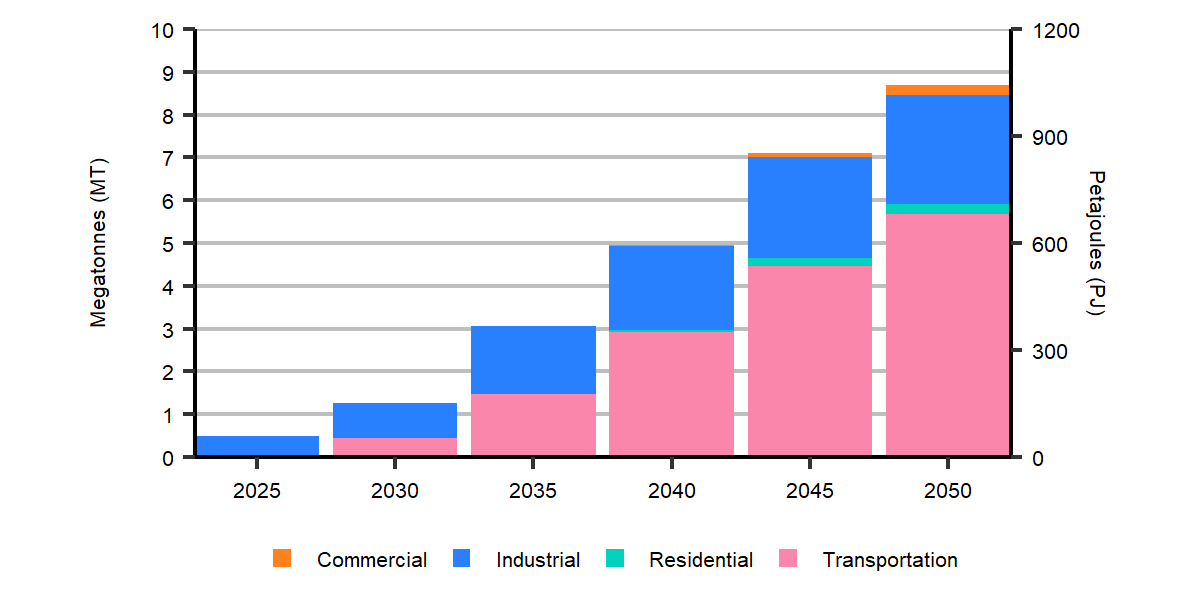
Description
Description: This stacked column chart shows hydrogen demand in the Global Net-zero Scenario over the projection period, broken down by sector. The sectors are commercial, industrial, residential, and transportation.
In 2025, virtually all demand comes from the industrial sector. Starting in 2030, transportation takes up an increasing share of total hydrogen demand, and most of it in 2050. Demand from the commercial and residential sectors remains marginal over the projection period.
What if the technologies to enable wide-scale adoption of hydrogen are more or less costly?
Canada is already one of the world’s largest producers and users of hydrogen. Most of this occurs in Alberta where hydrogen is produced from natural gas and is used as a feedstock in various industrial applications. Alberta’s Hydrogen Roadmap states 55% of production is used for heavy oil upgrading, 38% in the chemicals sector, and 7% for oil refining. At present, this hydrogen is produced using natural gas as a feedstock, a process which releases CO2 emissions. According to the Alberta Energy Regulator, 19% of the hydrogen produced in Alberta in 2021 was from facilities equipped with CCUS, with the remaining at facilities venting the CO2 to the atmosphere.
Many companies are actively expanding the production and use of hydrogen in Canada. An example of a recent project nearing completion is the Varennes Carbon Recycling plant, currently under construction in Quebec and aiming to be operational by 2025. The plant will produce biofuels and chemicals and will include an 87 MW electrolyzer to supply the hydrogen required for the process. Another example is the Air Products’ Canada Net-Zero Hydrogen Energy Complex in Alberta, which will use natural gas as a feedstock to produce low-emission hydrogen using auto-thermal reforming technology, coupled with CCUS.
Federal and provincial governments are supporting the expansion of hydrogen as a fuel
The federal government, British Columbia, Alberta, Ontario, and Quebec have all recently developed hydrogen strategies or roadmaps. The federal government is working to implement an investment tax credit for clean hydrogen and, along with many provinces, is supporting various proposed projects through technology funds and incentive programs.
In EF2023, we make assumptions about the cost of the technologies used to produce hydrogen
Along with prices for inputs like natural gas and electricity, these technology costs translate into the cost of hydrogen we rely on for modeling in our scenarios. Production costs range from $1.50/kg to 10.50/kg in 2030, and $1.00/kg to 7.00/kg by 2050, depending on production technologies and region. Our energy use model then considers how the relative costs of different fuels impacts household and business decision-making when investing in new energy-consuming devices. We also make assumptions about technology that use hydrogen, such as medium- and heavy-duty freight trucks, the amount of hydrogen blended into natural gas networks, and hydrogen exports.
“What if” hydrogen supply and demand is higher or lower than in the Global Net-zero Scenario?
We project hydrogen use in Canada reaches 8.5 MT in 2050 in the Global Net-zero Scenario. However, there is a wide range of factors that could result in different hydrogen supply and demand in the future, including different costs for technologies to produce and use hydrogen, and different amounts of hydrogen produced for export. In this “What if” analysis, we explore the impact on our projections if the drivers of hydrogen supply and demand are higher or lower than in the Global Net-zero Scenario. To do so, we modeled the Low and High Hydrogen cases, each with unique assumptions on hydrogen supply and demand technology costs, as well as hydrogen produced for export. These are summarized in Table R.6.
Table R.6: Hydrogen-specific assumptions, Global Net-zero Scenario and High and Low Hydrogen cases
| Global Net-zero Scenario | Low Hydrogen Case | High Hydrogen Case | |
|---|---|---|---|
| Electrolyzer capital cost | Capital costs declines 84% by 2050. | Capital costs declines only 15% by 2050. | Capital costs are 10% lower than the Global Net-zero scenario in 2050. |
| Hydrogen production from natural gas using CCUS capital cost | Capital costs declines 40% by 2050. | Capital costs falls 25% by 2050. | Capital costs falls 50% by 2050. |
| Hydrogen in transportation | Fuel cell truck costs fall steadily, approaching parity with diesel vehicles in 2035-2050 period. | Fuel cell truck costs are less competitive with battery-electric trucks. Hydrogen-based fuels play a lesser role in shipping and aviation. | Fuel cell truck costs are more competitive with battery-electric trucks. Hydrogen-based fuels play a greater role in shipping and aviation. |
| Hydrogen blending in natural gas networks | Hydrogen blending is 15-20% by volume for most provinces. | Hydrogen blending limited to 5% by volume. | Hydrogen blending limited to 20% by volume. |
| Hydrogen produced for export | Hydrogen produced for export is 1 MT by 2030 and 5 MT by 2050. | Hydrogen produced for export is 1 MT by 2030 and 2.5 MT by 2050. | Hydrogen produced for export is 2.5 MT by 2030 and 8 MT by 2050. |
The results of this “What if” analysis suggest that there is a wide range of possible levels of hydrogen use in the future. The Low Hydrogen Case shows a future where hydrogen plays a smaller role in Canada reaching net-zero by 2050. The High Hydrogen Case shows what could happen if hydrogen plays a bigger role in getting to net-zero. Figure R.41 compares hydrogen use and exports, as well as the technology used to produce it, in the Low and High Hydrogen cases and the Global Net-zero Scenario. In 2050, the Low Hydrogen Case shows demand and exports totaling 5 MT, 60% lower than in the Global Net-zero Scenario. The High Hydrogen Case shows demand and exports of 20 MT, 55% higher than in the Global Net-zero Scenario.
Figure R.41: Hydrogen use and production in 2050, Global Net-zero Scenario, and High and Low Hydrogen cases

Description
Description: These stacked column charts show hydrogen use and production in the Global Net-zero Scenario, the High Hydrogen Case, and the Low Hydrogen Case in 2050. Use is broken down by domestic use and exports. Production is broken down by electrolysis, biomass, and natural gas with CCUS.
The High Hydrogen Case sees the most significant growth in both production and use, followed by the Global Net-zero Scenario and the Low Hydrogen Case. Much of the additional production in the High Hydrogen Case is supplied by electrolysis.
Higher or lower hydrogen use has implications for the overall end-use demand mix. Figure R.42 compares the end-use demand mix in 2050 for the Global Net-zero Scenario and the two hydrogen cases. In the Global Net-zero Scenario hydrogen makes up 12% of end-use demand in 2050, but this increases to nearly 20% in the High Hydrogen Case and falls to around 4% in the Low Hydrogen Case. At the end-use level, more hydrogen use in the High Hydrogen Case reduces electricity and bioenergy demands, while less hydrogen in the Low Hydrogen Case increases demands for electricity and bioenergy. Of course, energy is also needed to produce hydrogen, so compared to the Global Net-zero Scenario, overall demands for electricity and natural gas increase in the High Hydrogen Case and decrease in the Low Hydrogen Case.
Figure R.42: End-use demand in 2050, Global Net-zero Scenario and High and Low Hydrogen cases
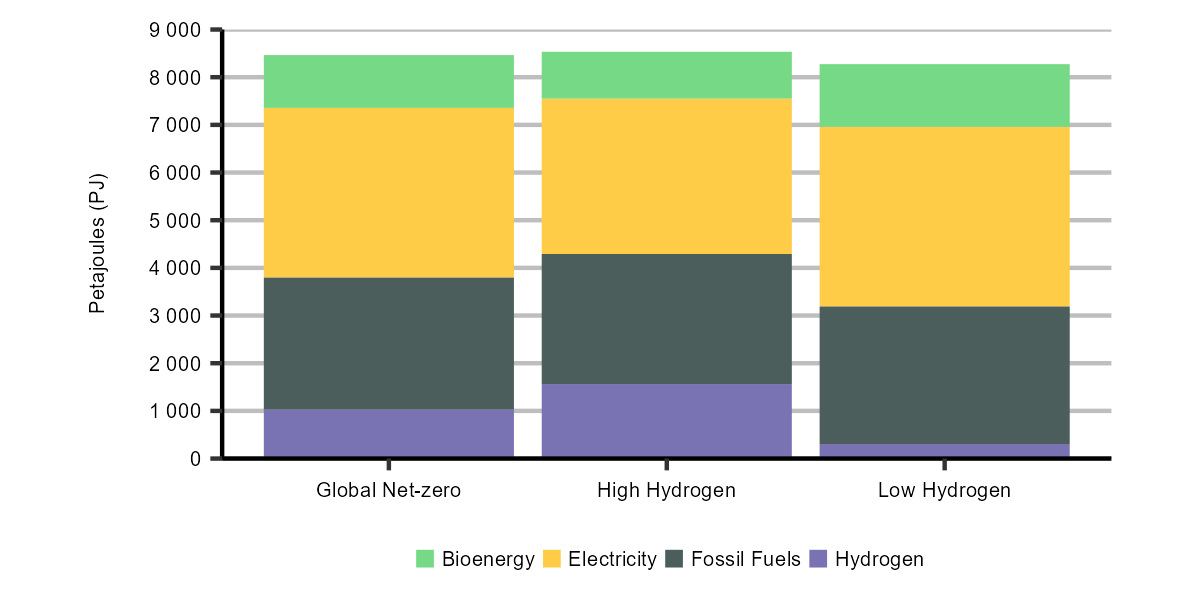
Description
Description: This stacked column chart shows total end-use energy demand in the Global Net-zero Scenario, the High Hydrogen Case, and the Low Hydrogen Case in 2050. Total energy demand is broken down by fuel source, including bioenergy, electricity, fossil fuels, and hydrogen.
Hydrogen occupies the largest share of total energy demand in the High Hydrogen Case, followed by the Global Net-zero Scenario. The Low Hydrogen Case sees a marginal role for hydrogen in total energy consumption.
Hydrogen is a versatile fuel that plays a key role in Canada’s energy mix in the Global Net-zero scenario. At the same time, the adoption of hydrogen within Canada, and development of export markets for Canadian hydrogen is uncertain. This “What if” analysis projects a range of potential levels of Canadian hydrogen demand, and shows that there are important implications for other energy use trends, including electricity and natural gas.
Hydrogen production
In EF2023, we model hydrogen production from three technologies:

- Natural gas-based production, which uses steam methane reformation or autothermal reformation processes. The CO2 resulting from these processes is then captured and stored using CCUS. This process is sometimes referred to as blue hydrogen.
- Electrolysis, which uses water as a feedstock and emission-free electricity as an energy source. This process is sometimes referred to as green hydrogen.
- Biomass-based production, which uses biomass gasification to produce hydrogen. The CO2 resulting from these processes may or may not then be captured and stored using CCUS.
For more information about different types of hydrogen production methods in Canada and around the globe see the CER Market Snapshot: Hydrogen could be part of the global path to net-zero.
In the Global Net-zero Scenario, low-emitting hydrogen production is about 2 MT by 2030, increasing to around 14 MT by 2050, with similar trends in the Canada Net-zero Scenario. By 2050, 32% of hydrogen production is natural gas-based, 58% is via electrolysis, and the remaining 10% is from biomass. The relatively high amount of electrolysis production is due to very large reductions in electrolyzer costs that we assume in the net-zero scenarios, which makes hydrogen produced from electricity the most cost-effective option in many regions. In the Current Measures Scenario, hydrogen production growth is limited, and largely from natural gas with CCUS. Figure R.43 shows hydrogen production by type of feedstock in both net-zero scenarios.
Figure R.43: Hydrogen production by technology, Global and Canada Net-zero scenarios

Description
Description: These stacked column charts show hydrogen production by type in 2030 and 2050 in both net-zero scenarios. Production is broken down by type, which includes biomass, electrolysis, and natural gas with CCUS.
Production is slightly higher in the Canada Net-zero Scenario in 2030 and 2050, with more production from natural gas with CCUS.
Hydrogen created with bioenergy and using CCUS results in negative emissions
Biomass-based production of hydrogen increases to 1.5 MT in 2050 in the Global Net-zero Scenario. When coupled with CCUS, biomass hydrogen production results in negative emissions by permanently storing carbon that would otherwise be temporarily stored in plant matter. In the Global Net-zero Scenario, biomass hydrogen production results in 23 MT of negative GHG emissions by 2050.
Types of hydrogen production depend on local resources
We project that hydrogen production occurs in many provinces, with large volumes from Ontario, Alberta, Quebec, and BC. Hydrogen tends to be produced by electrolysis in regions rich with hydroelectric power, from natural gas in regions with lower cost natural gas and suitable CCUS storage reservoirs, and from biomass in regions with large biomass supplies. Notably, while electricity and hydrogen are both energy carriers, electricity itself is used to create hydrogen in our scenarios. There are energy losses in the electrolysis process but in some instances, there are benefits to using hydrogen instead of electricity. This is because hydrogen is more energy-dense compared to electricity stored in a battery. This makes it potentially attractive as a fuel for heavy freight compared to EVs, although this will ultimately depend on the future costs of both hydrogen and batteries.
Hydrogen exports are supplied with a mix of electrolysis and natural gas with CCUS
In the Global Net-zero scenario, we assume over 3 MT of hydrogen is provided by dedicated on- and off-shore wind electricity in Atlantic Canada. These exports use over 165 TWh of wind electricity per year to produce hydrogen for export in 2050.Footnote 20 In the Global Net-zero Scenario, energy used to produce hydrogen increases to about 20% of total primary energy demand by 2050. Of this energy use, 60% is electricity (including dedicated renewable projects that produce hydrogen for our assumed exports), 25% in natural gas, and the remaining 15% is biomass.
GHG emissions associated with hydrogen production
We project that GHG emissions from hydrogen production for use as an energy carrier are slightly positive from 2024 to 2032, a result of the fraction of emissions that are not captured by CCUS when hydrogen is produced from natural gas. By 2035, some biomass-based hydrogen production is coupled with CCUS and net emissions from the hydrogen sector become net-negative in both net-zero scenarios. By 2050, the net emissions from hydrogen production are -21 MT in the Global Net-zero Scenario and -25 MT in the Canada Net-zero Scenario.
Key uncertainties: hydrogen
Domestic hydrogen markets and infrastructure: The use of hydrogen as a clean fuel, as projected in our net-zero scenarios, is currently in the early stages of development. The evolution of how and where hydrogen is adopted, the cost of production and end-use technologies, market pricing, and transportation infrastructure is uncertain. This could lead to different patterns of adoption than we project.
Hydrogen exports: There are various proposed projects aimed at producing hydrogen for export. Our scenarios include varying levels of hydrogen produced for export as well as associated dedicated offshore wind generation built to power hydrogen production. However, export volumes could be different than we assume depending on how global and domestic markets develop.
Negative emissions

In most global and Canadian net-zero scenario analyses, net-zero outcomes include both positive and negative emissions that balance to zero at some point in the future. For some sources of GHG emissions, eliminating all emissions or reducing them at a pace sufficient to achieve zero emissions by 2050 may be very costly or impossible. In both of our net-zero scenarios, we project slightly positive emissions in 2050 in several sectors, including buildings, heavy industry, oil and gas, and transportation. These are balanced by negative emissions. Negative emissions can be realized in several ways, but all aim to remove CO2 from the atmosphere on a permanent or long-term basis.
Key trends: negative emissions
Negative emissions play a key role in offsetting remaining emissions from other sectors.
BECCS, direct air capture, and land use, land-use change and forestry (LULUCF) all play important roles in reaching net-zero.
Nature can act as a carbon sink capable of storing carbon through natural processes
Managing natural processes to capture and store GHG emissions is often referred to as nature-based solutions.Definition* An example of a nature-based solution is the federal government’s 2 Billion Trees Commitment, which aims to plant two billion trees over 10 years to address both climate change and biodiversity loss.
LULUCF emission reductions are uncertain
We do not model nature-based solutions in EF2023. Instead, we make assumptions about the emissions and removals from natural processes, which we account for in our assumptions about land-use, land-use change and forestry (LULUCF). We describe these assumptions in the previous chapter, Scenarios and Assumptions. We assume negative emissions from the LULUCF of 50 MT by 2050 in both net-zero scenarios, and 13 MT in the Current Measures Scenario. However, there is some uncertainty on whether carbon stored through nature-based solutions will be permanent. Wildfires, infestations from insects like the pine beetle, or natural decay could release stored carbon and result in reduced impact from LULUCF in the future. Lower negative emissions from LULUCF would mean that greater emissions reductions from other sectors, or more negative emissions from other sources, would be needed to achieve net-zero emissions.
A second source of negative emissions in both net-zero scenarios is the use of bioenergy with carbon capture and storage technology (BECCS). We describe our projections for BECCS in the electricity and hydrogen sections earlier in this chapter. BECSS delivers negative emissions through the combustion of biomass such as trees or crop waste to generate electricity, and then uses CCUS to permanently store the emissions. We project that the use of BECSS results in around 60 MT of negative emissions in both net-zero Scenarios.
DAC is used to achieve negative emissions in both net-zero scenarios
DAC technology, which we describe in more detail in the following text box, is another option to achieve negative GHG emissions. In our analysis, we model DAC based on our assumptions about its costs and the profitability of capturing CO2 emissions directly from the atmosphere. We assume DAC facilities are compensated for capturing emissions by emitters who want to offset their own emissions.
In the Global Net-zero Scenario, we project that DAC facilities begin capturing emissions in the late 2030s, and by 2050, DAC results in negative emissions of 46 MT. In the Canada Net-zero Scenario, DAC captures 55 MT of emissions by 2050 and in the Current Measures Scenario, no DAC facilities are constructed.
DAC technology requires significant energy to draw in air and separate, compress and store CO2
There are a variety of DAC processes being tested and commercialized; in our modeling we assume DAC operations require both electricity and natural gas to power the process. Emissions from the natural gas used in the process are also captured and stored. By 2050, energy used to power DAC facilities makes up 4% of all end-use energy consumption in the Global Net-zero Scenario, and 5% in the Canada Net-zero Scenario.
Figure R.44 shows our assumptions about negative emissions from LULUCF and the negative emissions resulting from our modeling of BECCS and DAC, compared to total GHG emissions from the rest of the economy, in the Global Net-zero Scenario.
Figure R.44: Net emissions, Global Net-zero Scenario

Description
Description: This stacked column chart shows net GHG emissions in the Global Net-zero scenario over the projection period. Emissions are broken down by remaining emissions, LULUCF, DAC, and BECCS.
LULUCF is a net-negative emitter throughout the projection period. BECCS and DAC become noticeable negative emitters in the mid- to-late 2030s.
What if direct air capture (DAC) technology matures more quickly and is less costly?
DAC is an emerging technology that extracts CO2 directly from the atmosphere through a mix of physical and chemical processes. The CO2 can then be injected and stored in deep geological formations or be used as feedstock for different products such as synthetic fuels. By removing CO2 directly from the atmosphere, DAC has the potential to offset emissions from the activities whose emissions are hardest or most expensive to avoid.
According to a recent report by the IEA on Direct Air Capture, there are 18 small-scale DAC plants operating in the world today, capturing a combined 0.01 MT CO2 per year. Interest in DAC is growing; for example, by late 2024, U.S. oil producer Occidental Petroleum Corp aims to complete construction of the world’s largest DAC plant, which could remove up to 1 MT CO2 per year. This is the largest of a growing list of proposed DAC plants across North America and Europe.
DAC costs are uncertain, but may fall with time
While existing DAC plants demonstrate the technical feasibility of the technology, costs remain uncertain. Some estimates put the costs at between US$325 and US$785 per tonne of CO2 captured for a plant built today.Footnote 21 In comparison, Canada’s federal backstop carbon price is currently $65 per tonne of CO2e.
DAC deployment will depend on building and operation costs, as well as prices for emissions captured
As with many emerging technologies, it is possible that DAC costs will fall as new projects come online. Similarly, a higher price on carbon could present an incentive to build DAC facilities, either through direct compensation for captured CO2 or selling offsets to other industries looking to reduce their emissions. The role of DAC in Canada’s net-zero pathways will depend on the future of climate policies and the extent to which its costs will decline.
In the IEA’s Net Zero Emissions by 2050 Scenario, DAC facilities capture 90 MT of CO2 by 2030 globally, less than half a percent of the CO2 emissions the IEA projects to be emitted in that year. This number rises to 980 MT of CO2 in 2050. Many other international net-zero pathways from other organizations see DAC taking a larger role in the future. Ultimately, the extent of its deployment will largely depend on its cost relative to other decarbonization options, as well as the price DAC facilities receive for emissions they capture.
In EF2023, we rely on assumptions about the cost of DAC, including the cost to absorb, isolate, transport, and store the CO2. Our projections of DAC in different scenarios are based on its cost (as discussed in Table A.2) relative to other decarbonization technologies.
DAC deployment begins in the mid-2030s in the Global Net-zero Scenario
Given those assumptions, and the costs and characteristics of other carbon removal technologies, we project emission reductions from DAC to increase to 46 MT by 2050 in the Global Net-zero Scenario. We project most of the growth in DAC will occur starting in the mid-2030s once the most cost-effective decarbonization options are exhausted and the cost of DAC technology is lower.
DAC is an emerging and uncertain technology and could play a larger role in reducing Canada’s emissions to net-zero. In this “What if” analysis, we model the High DAC Case, where we assume that the cost of DAC falls to 2022$125 per tonne of CO2 by 2050, compared to 2022$230 per tonne of CO2 in the Global Net-zero Scenario.
In the High DAC Case, DAC sequesters 85 MTCO2 in 2050, nearly double that of the Global Net-zero Scenario. Figure R.45 compares the relative importance of DAC in reducing Canada’s emissions, relative to Canada’s net emissions of 732 MT in 2005.
Figure R.45: Negative emissions from DAC, as a % of total GHG emissions in 2005, all scenarios

Description
Description: This line chart shows negative GHG emissions from DAC as a share of total national GHG emissions in 2005 for both net-zero scenarios, as well as the High DAC Case.
In the High DAC Case, DAC exceeds 2% of total emissions reductions by the early 2040s, and it reaches the same level in the mid-2040s in both net-zero scenarios. The share of emissions then increases rapidly in both scenarios and the High DAC Case. By 2050, DAC accounts for around 5% of emission reductions in the Global Net-zero Scenario, 7% in the Canada Net-zero Scenario, and 12% in the High DAC Case.
Greater use of DAC also impacts the energy system. First, more negative emissions from DAC means that the pressure to reduce emissions in other sectors is lower compared to a net-zero scenario with few negative emissions. Second, DAC processes use a large amount of energy. In the High DAC Case, more natural gas and electricity is used to operate DAC facilities.
DAC use increases energy demand in the High DAC Case
Figure R.46 shows the difference in energy demand between the High DAC Case and the Global Net-zero Scenario in 2050. Additional use of DAC increases natural gas demand by 1.5 Bcf/d (42 106m³/d), and electricity by 3.5 TWh. In the rest of the economy, more natural gas and other fossil fuels are used in the High DAC Case in place of some electricity, bioenergy, and hydrogen. The net effect of these changes is an over 600 PJ increase in energy use by 2050 relative to the Global Net-zero Scenario, or about a 7% increase.
Figure R.46: Difference in energy use between the Global Net-zero Scenario and High DAC Case in 2050, by fuel

Description
Description: This stacked column chart shows the difference in end-use energy by fuel between the Global Net-zero Scenario and High DAC Case in 2050. The fuels are bioenergy, electricity, hydrogen, natural gas, other fossil, and the total of all fuels.
In the High DAC Case, more natural gas is used, much of which is associated with DAC energy needs. Other fossil fuel demands increase in the High DAC Case compared to the Global Net-zero Scenario, while the High DAC Case uses less bioenergy and hydrogen. The High DAC Case shows more electricity used for DAC operation, but less end-use electricity in other sectors.
It is also possible that DAC might be used less than in the Global Net-zero Scenario. Less negative emissions from DAC would mean achieving net-zero will require more emission reductions from other parts of the economy. This could include greater use of electricity, bioenergy and hydrogen-based fuels, additional nature-based solutions to offset emissions, or a greater need for energy efficiency and conservation.
DAC could account for an important share of Canada’s overall emission reductions. With faster technological advancement and increasing adoption, the High DAC Case shows a pathway where DAC accounts for over one tenth of the emission reductions required to reach net-zero. It also shows that greater DAC use could lead to significantly more natural gas and RPP demand than shown in the Global Net-zero Scenario.
Key uncertainties: negative emissions
Reliance on nature-based solutions: In our analysis, we limited the reliance on nature-based solutions in order to focus more on the potential energy technologies available to reach net-zero. However, some recent Canadian net-zero studies assume higher contributions of land-use change to reach net-zero.Footnote 22 The ultimate contribution of these emissions is uncertain and could be higher or lower than we assumed.

Direct Air Capture: There is considerable uncertainty around the ability of DAC to contribute to Canada’s emission reductions. Cost trends could be significantly higher than we assume in the Global and Canada Net-zero Scenarios, and lead to different outcomes.
Balancing remaining emissions with negative offsets: The balance of negative emissions versus remaining emissions in our scenarios is in line with other Canadian net-zero studies. If negative emission technologies progress less quickly than we assume, faster reductions will be needed in other areas of the economy, potentially involving stronger policy action. On the other hand, if negative emissions develop faster, it is possible less stringent policies will be needed to achieve net-zero emissions.
Macroeconomics
The economy is a key driver of the energy system. Economic growth, industrial output, inflation, exchange rates, global demand, and population growth all influence energy supply and demand trends. The way they evolve will have a direct impact on Canada’s transition towards net-zero.
Key trends: macroeconomics
Continued population and economic growth across all scenarios.
Slightly slower growth in the Global Net-zero and Canada Net-zero scenarios.
The long-term projections for key economic variables are in Figure R.47. Real (adjusted for inflation) economic growth averages 1.4% per year over the projection period in the Global Net-zero scenario. Growth is slightly higher in the Canada Net-zero and Current Measures scenarios, largely driven by stronger oil and gas prices, production, and export levels. The Canada-US exchange rate varies across the three scenarios, also related to the large variation in oil and gas activity and prices.
Economic growth over the projection is generally slower than the historical average in all three scenarios. Reasons for slower growth include an aging population and slower global economic growth.
Figure R.47: Economic indicators, annual % change from 2019 to 2050, all scenarios
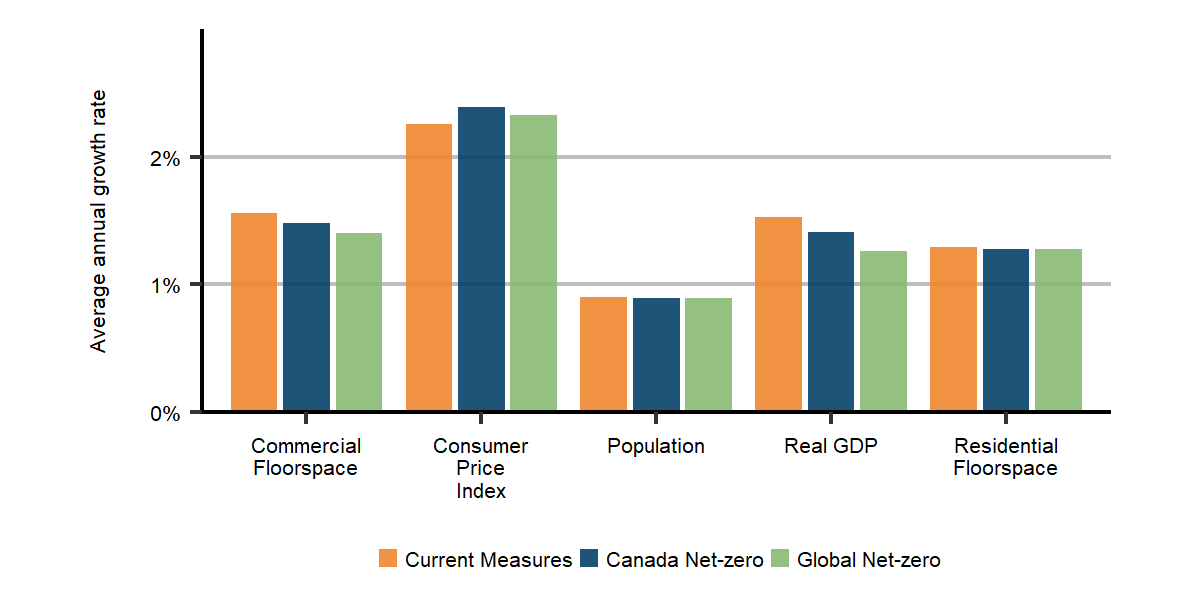
Description
Description: This column chart shows the average annual growth of different macroeconomic indicators over the projection period in all three scenarios. Those indicators include commercial floorspace, consumer price index, population, real GDP, and residential floorspace.
Those indicators remain comparable across the three scenarios. Commercial floorspace and residential floorspace increase by roughly 1.5% a year over the projection period. The consumer price index grows by slightly over 2%, while population increases by slightly less than 1% per year on average and real GDP by between 1% and 2%.
Key uncertainties: macroeconomics
Global economic growth: Future global uncertainties, such as demand for Canadian exports, technology development, and commodity prices could impact future Canadian economic growth. This is especially true for the Global Net-zero Scenario, as policies and technologies used to reduce global emissions could lead to different macroeconomic outcomes than shown here. Likewise, geopolitical events, such as the Russian invasion of Ukraine, could impact future growth trends.
Impacts of climate change: The three scenarios do not include macroeconomic estimates of damages related to climate change. These could significantly reduce economic growth, particularly in scenarios like Current Measures, where only limited measures to reduce climate change are included.
Cost of decarbonization: The net-zero scenarios assume declining costs for key technologies, such as EVs, heat pumps, electrolyzers, and DAC. If these cost reductions do not materialize, achieving net-zero by 2050 could be more costly and involve lower economic growth than shown here.
- Date modified: