ARCHIVED – Canadian Energy Overview 2014 - Energy Briefing Note
This page has been archived on the Web
Information identified as archived is provided for reference, research or recordkeeping purposes. It is not subject to the Government of Canada Web Standards and has not been altered or updated since it was archived. Please contact us to request a format other than those available.
ISSN 1917-506X
July 2015
Copyright/Permission to Reproduce
Preface
This is the ninth year that the National Energy Board (NEB) has published the Canadian Energy Overview (CEO) which provides basic data on Canadian energy supply and markets. The 2014 CEO complements the NEB analytical report, Canadian Energy Dynamics: 2014, which discusses a number of important energy developments that occurred in 2014. These products contribute to the transparency of Canadian energy markets and support Canadian energy literacy.
Table 1 - Key Canadian Energy and Economy Statistics
| 2013 | 2014 | % Change | |
|---|---|---|---|
| The energy industry's direct contribution to GDP (per cent) | 9.5 | 9.8 | N/A |
| Annual energy export revenues (billion $) | 113.4 | 128.7 | 13.5 |
| The energy industry's contribution to Canadian export revenues (per cent) | 23.7 | 24.4 | N/A |
| Average West Texas Intermediate (WTI) Crude Oil Price (US$ per barrel) | 97.91 | 93.26 | -4.7 |
Sources: Statistics Canada, WTI pricing: U.S. Energy Information Administration (EIA)
Text version
This table presents statistics about Canadian energy and the Canadian economy. Between 2013 and 2014, the direct contribution of the energy industry to Gross Domestic Product (GDP) was relatively stable at close to 10 per cent. Annual energy export revenues grew by slightly more than $15 billion from 2013 to 2014 to a total of $128.7 billion. The average WTI crude price was almost five per cent lower in 2014 than in 2013 at US$93.26/bbl.
Figure 1 - Net Energy Export Revenues
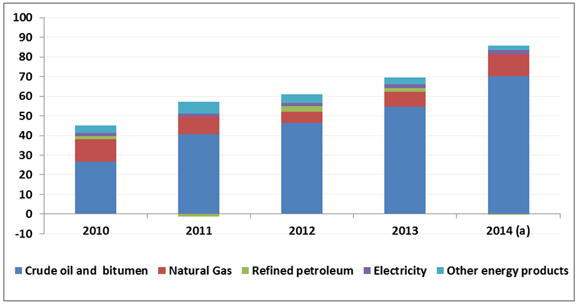
(a) Estimates
Source: Statistics Canada
Text version
This stacked bar graph illustrates net energy export revenues by energy commodity in billions of dollars from 2010 to 2014. In 2014, net energy export revenues totaled just above $85 billion, led by crude oil and crude bitumen at about $70 billion, with natural gas, electricity and other energy products contributing about $11 billion, $2.3 billion and $2.3 billion, respectively. In the case of refined petroleum, the value of imports exceeded that of exports by $0.45 billion in 2014.
Table 2 - Domestic Energy Production by Energy Source - Petajoules (PJ)
| 2010 | 2011 | 2012 | 2013 | 2014Note a | % Change (2013-2014) |
|
|---|---|---|---|---|---|---|
| PetroleumNote b | 7 090 | 7 506 | 8 057 | 8 795 | 9 283 | 5.6 |
| Natural gasNote c | 5 772 | 5 765 | 5 500 | 5 555 | 5 807 | 4.5 |
| Hydroelectricity | 1 253 | 1 339 | 1 356 | 1 397 | 1 350 | -3.3 |
| Nuclear Energy | 308 | 318 | 322 | 297 | 363 | 22.5 |
| Wind, Tidal and Solar ElectricityNote d | 32 | 37 | 42 | 42 | 33 | -22.4 |
| OtherNote e | 510 | 502 | 487 | 557 | 566 | 1.7 |
| TotalNote f | 14 964 | 15 468 | 17 268 | 16 642 | 17 402 | 4.6 |
| Annual Growth | 3.4 | 2.0 | 5.5 | 4.6 | ||
Note: totals and growth rates may not appear accurate due to rounding.
Sources: NEB, Statistics Canada and Natural Resources Canada
Text version
The table displays domestic energy production from 2010 to 2014 by energy source, including: petroleum; natural gas; hydroelectricity; nuclear electricity; coal; wind, tidal and solar electricity; and other. Between 2013 and 2014, domestic energy production increased for petroleum, natural gas, nuclear electricity and other and decreased for hydroelectricity and wind, tidal and solar electricity. It should be noted that estimates for 2014 coal production are unavailable and so the total domestic energy production for 2014 cannot be calculated.
Table 3 - Domestic Secondary EnergyNote 1 Consumption (Petajoules)
| 2010 | 2011 | 2012 | 2013 | 2014Note a | % Change, (2013-2014) |
|
|---|---|---|---|---|---|---|
| ResidentialNote b | 1 599 | 1 682 | 1 615 | 1 689 | 1 702 | 0.8 |
| Commercial | 1 339 | 1 380 | 1 455 | 1 502 | 1 519 | 1.1 |
| IndustrialNote b Note c | 5 081 | 5 224 | 5 381 | 5 506 | 5 625 | 2.2 |
| Transportation | 2 605 | 2 576 | 2 560 | 2 594 | 2 625 | 1.2 |
| Total | 10 624 | 10 862 | 10 011 | 11 291 | 11 471 | 1.6 |
| Annual % Change | 2.2 | 1.4 | 2.5 | 1.6 | ||
Sources: NEB and Statistics Canada
Text version
This table provides domestic secondary energy consumption by the residential, commercial, industrial and transportation sectors from 2010 to 2014. Total domestic energy consumption grew to a total of 11 492 petajoules in 2014. In the industrial sector, secondary energy consumption grew every year from 2010 to 2014.
Figure 2 - Number of Wells Drilled - Western Canada
Details
The overall number of wells drilled in western Canada in 2014 decreased relative to 2013. Oil drilling declined in response to the steady fall in oil prices in the latter half of 2014. Natural gas drilling increased from 2013, due to companies targeting prospects rich in natural gas liquids, which earn higher prices and thus generate more revenues.
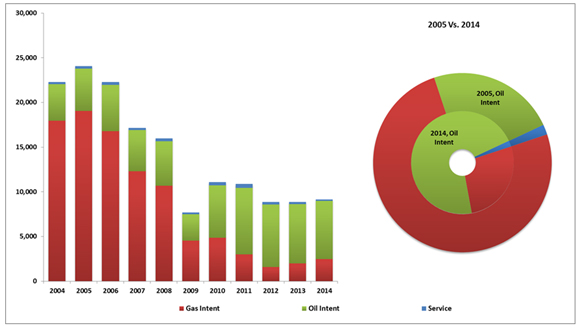
Source: NEB analysis of Divestco Inc. data
Text version
This figure includes a stacked bar and a pie graph. The bar graph illustrates the number of wells drilled in Western Canada from 2005 to 2014. In 2014, the total number of wells drilled was 7 864, of which about 25 per cent were for gas, 73 per cent were for oil and two per cent were for serviceFootnote 2. In comparison, the number of wells drilled in 2005 was 24 068 of which 79 per cent were for gas, 20 per cent were for oil and one per cent was for service.
Figure 3(A) - Western Canada Oil, Natural Gas and Oil Sands Rights Expenditures - Land Sales Revenues
Details
In Western Canada, provincial government revenues from the leasing of petroleum rights increased slightly in 2014 to $1.1 billion, but still remained well below the ten year average. Decreased revenues in Alberta were offset by increased revenues in British Columbia and Saskatchewan.
In 2014 the Canada–Newfoundland and Labrador Offshore Petroleum Board (CNLOPB) announced the results of recent calls for bids for work commitments in offshore Newfoundland. In the Flemish Pass, three companies placed the largest bid in CNLOPB history. In total, nearly $600 million was bid on a single 266,139 hectare parcel. Two other bids totaling over $37 million were also accepted.
Currently, there is an active call for bids from the CNLOPB for 11 parcels totaling 2 581 655 hectares which will close on November 12, 2015.
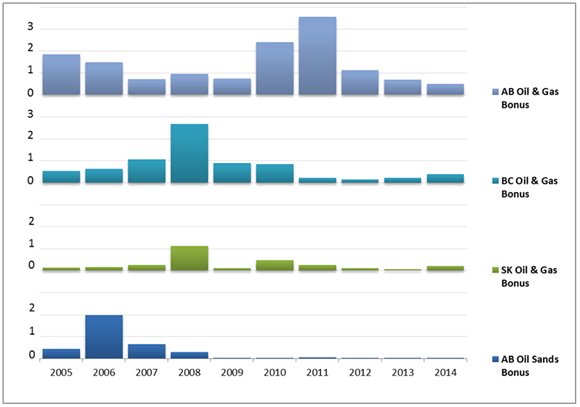
Source: Provincial governments
Text version
This graph illustrates revenues collected by provincial governments for leasing rights to explore for oil and gas, commonly referred to as “land sales” over the period of 2005-2014. In 2014, Alberta earned about $4.7 million in oil sands land sales, and revenues have been under $50 million since 2009. In oil and gas land sales in 2014, Alberta earned $489 million, Saskatchewan earned $198 million, and B.C. earned $383 million.
Figure 3(B) - Western Canada Oil, Natural Gas and Oil Sands Land Sales Activity
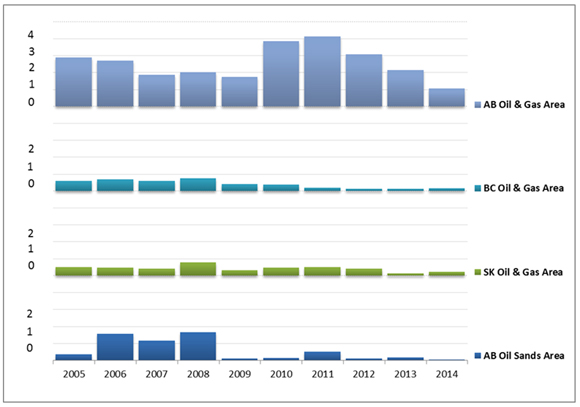
Source: Provincial governments
Text version
This figure illustrates the land holdings in hectares for oil and gas land sales in Alberta, British Columbia and Saskatchewan as well as oil sands land sales activity in Alberta from 2005 to 2014. British Columbia and Saskatchewan had small increases in oil and gas land sales activity from 2013 to 2014 while Alberta oil sands and oil and gas land sales activity declined in 2014.
Figure 4 - Average Annual Crude Oil Production
Details
Canadian crude oil production in 2014 increased by 7.9 per cent when compared to 2013, averaging an estimated 0.60 million cubic metres per day or 3.75 million barrels per day. This growth is largely attributed to increased oil sands production, including several new in situ bitumen projects coming on-line and increased tight oil production in the WCSB.
In 2014, oil sands oil production averaged an estimated 0.34 million cubic metres per day (2.17 million barrels per day), with synthetic crude oil output increasing by 2.0 per cent and non-upgraded bitumen production increasing by 20.0 per cent over 2013 levels.
Offshore Newfoundland and Labrador oil production decreased by 5.8 per cent from 2013 levels. The decrease in 2014 was related to a planned maintenance turnaround at the Terra Nova field, and a normal decline in producing fields.

Sources: Provincial energy agencies, Offshore Petroleum Boards and NEB
Text version
The figure contains three separate graphs. The first graph shows Canadian crude oil production from 2010 to 2014 which has been growing each year. Between 2010 and 2014, crude production grew from 450.4 106 m³/d (2.83 106 bbl/d) to 597.4 106m³/d (3.75 106 bbl/d), an increase of 33 per cent.
The pie graph shows the share of crude oil and equivalent production by province as a percentage of total Canadian production. In 2014, Alberta produced about 77 per cent of Canadian production followed by Saskatchewan at 13.8 per cent. Newfoundland, Manitoba, British Columbia, Northwest Territories/Nunavut, Nova Scotia and Ontario produced 5.8, 1.3, 1.3, 0.3, 0.08 and 0.04 per cent, respectively.
The final doughnut graph shows the 2014 production volumes, arranged by type of crude oil. Non-upgraded bitumen accounted for the greatest amount of production at 32.1 per cent, followed by conventional light and condensate at 30.0 per cent, synthetic crude at 25.5 per cent and conventional heavy crude at 12.4 per cent.
Figure 5 - Crude Bitumen Production, 2014
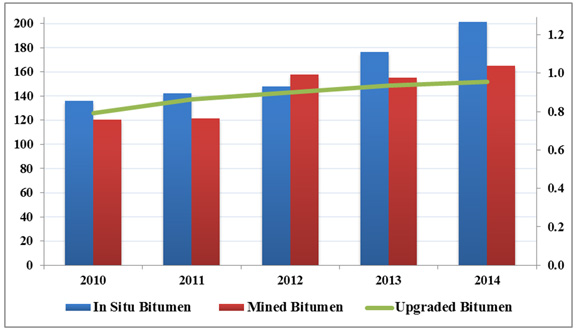
(a) Estimates
Source: Alberta Energy Regulator (AER)
Text version
This graph shows crude bitumen production from 2010-2014. In 2014, mining produced 170.6 thousand cubic metres per day (1.1 million barrels per day) of bitumen while in situ production yielded 193.7 thousand cubic metres per day (1.2 million barrels per day) and upgraded bitumen totaled 153.9 thousand cubic metres per day (0.97 million barrels per day).
Figure 6 - WTI and North Sea Brent Oil Price
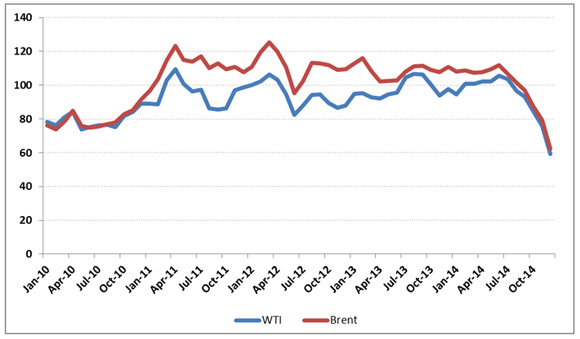
Source: EIA
Text version
This graph shows the prices for two light crude oil benchmarks: WTI at Cushing, Oklahoma and Brent (North Sea) from 2010 to 2014. In January 2014, the average price per barrel of WTI oil was US$94.62 and for Brent it was US$108.12. In December of the same year, the corresponding prices were US$59.29 and US$62.34.
Figure 7 - Mexican Mayan and Western Canadian Select Oil Prices
Details
The posted prices for two heavy crude oil benchmarks, Western Canadian Select (WCS) at Hardisty, Alberta and the similar quality Mexican Maya at the U.S. Gulf Coast, were comparable in the beginning of 2010. In the years following 2010, WCS prices began to drop relative to Maya, reflecting inadequate market access for Western Canadian heavy oil. In December 2013, the price differential between WCS and Maya was US$18.07 per barrel. The price differential began to narrow in 2014 and, as oil prices dropped over the course of the year, the differential fell to a level of US$9.28 in December 2014.

Sources: EIA and Government of Alberta
Text version
This graph shows the prices of WCS and Maya from 2010 to 2014.
Figure 8 - Average Annual Crude Oil Exports and Imports
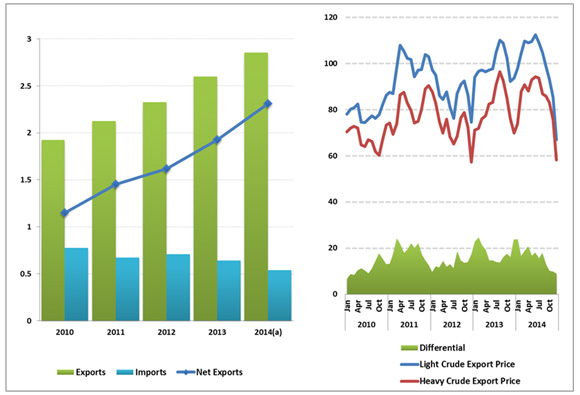
(b) Estimates
Sources: NEB and Statistics Canada
Text version
This figure contains two separate graphs. Graph A) illustrates the average annual Canadian crude oil exports and imports from 2010 to 2014. In 2010, exports were 306.4 thousand cubic metres per day (1.93 million barrels per day), imports were 123.5 thousand cubic metres per day (0.78 million barrels per day) and net exports were 182.9 thousand cubic metres of oil per day (1.15 million barrels per day). In 2014, Canada exported 453.5 thousand cubic metres per day (2.85 million barrels per day) and imported 86.2 thousand cubic metres per day (0.54 million barrels per day), for a net export total of 367.3 thousand cubic metres of oil per day (2.3 million barrels per day).
Graph B) illustrates the Canadian monthly light and heavy crude oil export prices, along with the differentials between the two prices, in dollars per barrel from 2010 to 2014. In 2014, the light crude export price average was $99.94 and the heavy crude export average price was $84.15 (Canadian $).
Table 4 - Canadian Crude Oil and Refined Product Prices
| Product | 2013 | 2014 | Change | % Change |
|---|---|---|---|---|
| Gasoline (cents/litre) | 127.9 | 128.1 | 0.2 | 0.1% |
| Diesel (cents/litre) | 128.6 | 133.9 | 5.3 | 4.1% |
| Furnace oil (cents/litre) | 120.4 | 125.1 | 4.7 | 3.9% |
| Canadian light crude blend ($/bbl)Note a | 92.8 | 94.0 | 1.2 | 1.3% |
| WCS (US$/bbl) | 71.5 | 73.6 | 2.1 | 2.9% |
Sources: Natural Resources Canada and Government of Alberta
Text version
This table shows the 2013 and 2014 average Canadian product prices for gasoline, diesel, furnace oil and Canadian heavy and light crude blend prices for oil.
Figure 9 - North American Gas Prices - Henry Hub (3-day average price)
Source: GLJ Publications Inc.
Text version
This graph illustrates monthly Henry Hub gas prices in U.S. dollars per million British thermal units from 2005 to 2014. Natural gas prices at Henry Hub averaged US$4.37 per million British thermal units in 2014, 19 per cent above the 2013 level of US$3.67. The natural gas price ranged between US$3.65 and US$5.15 per million British thermal units in 2014.
Figure 10 - Canada and U.S. Natural Gas Storage Inventories
Details
Natural gas storage serves as a balancing mechanism for the natural gas market. Gas is injected in the summer and withdrawn in the winter, when demand for space heating increases. The natural gas storage season runs from April to March.
In 2014, natural gas storage inventories in Canada and the U.S. were important in supplying natural gas to the market as the below average temperatures in the winter of 2013-14 increased demand for natural gas, resulting in large withdrawals from storage. By February and March 2014, inventories decreased significantly below the five-year average. The rest of 2014 was characterized by above average storage injection rates. Production remained resilient and inventories returned close to the five-year average by December 2014.
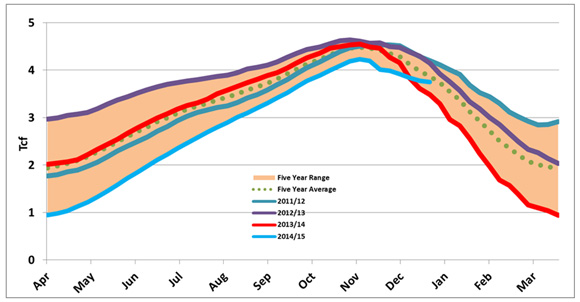
Sources: EIA and Enerdata
Text version
This graph illustrates the combined natural gas storage inventory levels in Canada and the U.S. in trillion cubic feet. This graph shows the levels of natural gas storage inventory levels for the 2014/2015 fiscal year, April to December of 2014, and the average, minimum and maximum storage levels of the past five years.
Figure 11 - Canadian Natural Gas Consumption
Details
Overall consumption of natural gas in Canada grew by 0.4 per cent in 2014 to 245 million cubic metres per day (8.6 bcf per day).
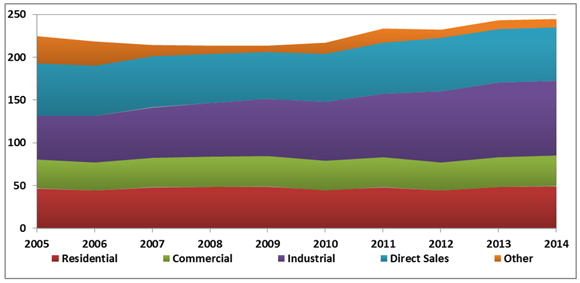
Source: Statistics Canada
Note: Statistics Canada defines Direct Sales as the deliveries of non-utility-owned natural gas to consumers.
Text version
This stacked area chart shows annual natural gas consumption by sector from 2005 to 2014. The sectors included in the chart are residential, commercial, industrial, direct sales and other.
Figure 12 - Annual Number of Heating Degree Days

Source: Canadian Gas Association (CGA)
Text version
This bar chart shows the annual number of heating degree days in Canada from 2005 to 2014. Heating degree days is a measurement designed to reflect the demand for energy needed to heat a building based on measurements of outside air temperature. Heating degree days are defined relative to a base temperature (the outside temperature above which a building needs no heating). Between 2005 and 2014, heating degree days have fluctuated between 3 762 and 4 305 per year.
Figure 13 - Average Annual Purchased Natural Gas Requirements for Oil Sands Operations
Details
Alberta oil sands operations use natural gas to generate electricity and steam. Steam is used for in situ oil production and for the production of hydrogen used to upgrade bitumen into synthetic crude oil. Total natural gas purchases for oil sands operations reached 55.2 million cubic metres per day (1.95 billion cubic feet per day) in 2014, a 18.2 per cent increase from 2013.

(a) Estimates
Sources: NEB and AER
Text version
This stacked area graph displays the annual natural gas purchased by type of oil sands operation: mining and upgrading, in situ, and cogeneration. This graph includes cogeneration for both mining and in situ production.
Figure 14 - Canadian Marketable Natural Gas Production
Details
In 2014, Canadian marketable natural gas production increased by 4.5% to 416 million cubic meters per day (14.7 billion cubic feet per day). Production continued to focus on liquids-rich plays in Alberta and B.C. Outside of Western Canada, EnCana’s Deep Panuke offshore facilities reported lower production than expected due to issues with water seeping into the reservoir. Deep Panuke is currently offline and will be moving to seasonal production starting in October 2015.

(a) Estimates for 2014 data
Sources: Governments of energy producing provinces and territories
Text version
This stacked area graph shows Canada’s annual marketable natural gas production by jurisdiction from 2005 to 2014. Total production was 151.7 billion cubic metres (5.4 trillion cubic feet) in 2014.
Figure 15 - Quarterly Canadian Natural Gas Exports and Imports

Source: NEB
Text version
This chart shows quarterly exports and imports of natural gas in Canada for 2013 and 2014. The bars illustrate the exports and imports of natural gas and liquefied natural gas (LNG) imports, while the line illustrates net exports (i.e., the total difference between exports and imports). Net exports averaged 147.8 million cubic metres per day (5.2 billion cubic feet per day) in 2014, down 0.6 per cent from 2013 levels.
Table 5 - Electricity Supply and Disposition (TW.h)
| 2010 | 2011 | 2012 | 2013 | 2014Note a | % Change (2013-2014) |
|
|---|---|---|---|---|---|---|
| Supply | ||||||
| Total Generation | 588.0 | 618.6 | 617.1 | 620.4 | 599.8 | -3.3 |
| Imports | 18.6 | 14.4 | 10.9 | 10.7 | 12.8 | 19.8 |
| Total Supply | 606.6 | 632.9 | 628.0 | 631.1 | 612.6 | -2.9 |
| Disposition | ||||||
| Demand | 563.0 | 581.9 | 570.3 | 568.5 | 553.5 | -2.6 |
| Exports | 43.6 | 51.1 | 57.6 | 62.6 | 59.1 | -5.6 |
| Total Disposition | 606.6 | 632.9 | 628.0 | 631.1 | 612.6 | -2.9 |
Sources: Statistics Canada and NEB
Note: Monthly electricity generation numbers are based on a survey that excludes smaller producers and certain isolated stations. Annual generation numbers are based on a different survey that includes these smaller producers. Because of this the summation of the monthly generation estimates has been on average 2.8 per cent lower than the numbers reported by the annual survey for the last 8 years. Therefore, the 2014 electricity generation estimates will almost certainly be revised upward upon release of the annual data.
Note: Totals and growth rates may have been rounded.
Text version
This table lists electricity supply and disposition from 2010 to 2014.
Table 6 - Electricity Production (TW.h)
| 2010 | 2011 | 2012 | 2013 | 2014Note a | % Change (2013-2014) |
|
|---|---|---|---|---|---|---|
| Hydroelectric | 348.0 | 372.1 | 376.9 | 388.0 | 375.1 | -3.3 |
| Nuclear | 85.5 | 88.3 | 89.5 | 82.4 | 100.9 | 22.5 |
| Thermal | 142.7 | 145.3 | 134.2 | 126.6 | 114.6 | -9.4 |
| Wind, Tidal & Solar | 8.8 | 10.4 | 11.6 | 11.8 | 9.2 | -22.4 |
| Other | 3.0 | 2.5 | 2.7 | 2.4 | 0.01 | -99.8 |
| Total | 588.0 | 618.6 | 614.5 | 611.2 | 599.8 | -1.9 |
Source: Statistics Canada
Note: Monthly electricity generation numbers are based on a survey that excludes smaller producers and certain isolated stations. Annual generation numbers are based on a different survey that includes these smaller producers. Because of this the summation of the monthly generation estimates has been on average 2.8 per cent lower than the numbers reported by the annual survey for the last 8 years. Therefore, the 2014 electricity generation estimates will almost certainly be revised upward upon release of the annual data.
Note: Totals and growth rates may have been rounded.
Text version
This table lists electricity production by source from 2010 to 2014. When compared to 2013, only nuclear electricity production increased in 2014 while production from hydroelectric, thermal, wind, tidal, solar and other generation sources declined. Data for 2014 is estimated and is expected to be revised upward.
Figure 16 - Canadian Residential Electricity Prices
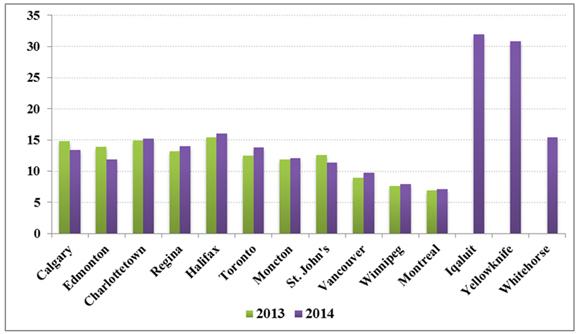
Sources: Hydro-Québec, Arctic Energy Alliance and Qulliq Energy Corporation
Note: Based on 1 April electricity rates in 2013 and 2014 and a monthly consumption of 1 000 kW.h for capital cities (excludes taxes).
Text version
This bar graph compares the electricity prices that households pay in various cities across Canada in 2013 and 2014. Prices generally increased over 2013 levels, with the exception of Calgary, Edmonton and St. John’s, where they decreased. Outside of Northern Canada, Halifax continued to have the highest electricity price in 2014 at 16.03 cents per kilowatt hour, followed by Charlottetown at 15.24 and Regina at 13.95. Montreal, Winnipeg and Vancouver continued to have the cheapest electricity with rates of 7.06, 7.89, and 9.71 cents per kilowatt hour, respectively. New data on electricity prices in Iqaluit, Yellowknife and Whitehorse show rates of 31.9, 30.9 and 15.5 cents per kilowatt hour in 2014, respectively. Comparable data for these three locations was not available for 2013.
Figure 17 - Annual electricity exports and imports (TW.h)
Details
In 2014, Canada exported 59.1 terawatt hours of electricity, a six per cent decrease from 2013 when exports were at an all-time high. For the most part, provinces that export large amounts of electricity are those with predominantly hydro-based generation.
Despite smaller export volumes in 2014, gross export revenue increased by 20 per cent. The majority of the revenue increase was recorded in the first quarter of 2014, which coincides with the cold weather in the main export markets and high gas prices. In 2014, Canadian exporters received $49.94 per megawatt hour compared to $39.30 per megawatt hour in 2013.
Electricity imports declined between 2010 and 2013. However, in 2014 Canada imported 12.8 terawatt hours of electricity, up by 20 per cent from a year earlier.
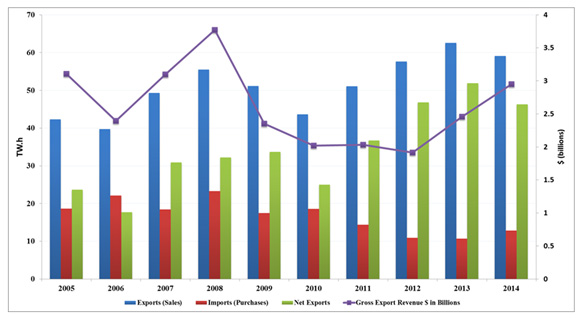
Source: NEB
Text version
This bar chart shows annual Canadian electricity exports, imports, net exports, and gross export revenue from 2004 to 2014. In general, Canadian net exports have been steadily growing since 2010 with a small decline in 2014. Gross export revenue started to decline in 2009 and remained relatively flat from 2009 to 2012. However, gross export revenue grew in 2013 and 2014.
Appendix 1
Canadian Oil Reserves at 31 December 2013 (million cubic metres)
| Crude Oil Reserves | |||
|---|---|---|---|
| Initial Reserves | Cumulative Production | Remaining Established Reserves | |
| Conventional Crude Oil | |||
| Light | |||
| British Columbia | 136 | 117 | 19 |
| Alberta | 2 564 | 2 347 | 217 |
| Saskatchewan | 331 | 281 | 50 |
| Manitoba | 65 | 56 | 10 |
| Subtotal - WCSB | 3 097 | 2 801 | 296 |
| Ontario | 16 | 15 | 2 |
| Nova Scotia Offshore | 7 | 7 | 0 |
| Newfoundland Grand Banks | 464 | 233 | 231 |
| Mainland NWT & Yukon | 53 | 44 | 9 |
| Arctic Islands | 1 | 1 | 0 |
| Subtotal - Frontier | 524 | 284 | 240 |
| Subtotal - Light | 3 637 | 3 100 | 537 |
| Heavy | |||
| Alberta | 406 | 340 | 66 |
| Saskatchewan | 759 | 615 | 144 |
| Subtotal - Heavy | 1 165 | 955 | 210 |
| Total - Conventional | 4 821 | 4 095 | 726 |
| Oil Sands | |||
| Mining Projects | 6 157 | 931 | 5 226 |
| In Situ Projects | 21 935 | 596 | 21 339 |
| Total - Oil Sands | 28 092 | 1 527 | 26 565 |
| Total Canada | 32 894 | 5 582 | 27 312 |
| Note: Totals and growth rates may not appear accurate due to rounding. | |||
Sources:
CNLOPB for Newfoundland
NEB for estimates of reserves in the Mainland Territories and Arctic Islands
AER ST-98 for Alberta
Saskatchewan Ministry of the Economy
BCOGC for British Columbia
CAPP for Manitoba and Ontario
Canadian Oil Reserves at 31 December 2013 (million barrels)
| Crude Oil Reserves | |||
|---|---|---|---|
| Initial Reserves | Cumulative Production | Remaining Established Reserves | |
| Conventional Crude Oil | |||
| Light | |||
| British Columbia | 851 | 730 | 121 |
| Alberta | 16 056 | 14 697 | 1 359 |
| Saskatchewan | 2 076 | 1 761 | 315 |
| Manitoba | 409 | 349 | 59 |
| Subtotal - WCSB | 19 391 | 17 537 | 1 854 |
| Ontario | 100 | 91 | 10 |
| Nova Scotia Offshore | 44 | 44 | 0 |
| Newfoundland Grand Banks | 2 903 | 1 458 | 1 445 |
| Mainland NWT & Yukon | 331 | 276 | 55 |
| Arctic Islands | 3 | 3 | 0 |
| Subtotal - Frontier | 3 281 | 1 782 | 1 500 |
| Subtotal - Light | 22 773 | 19 410 | 3 363 |
| Heavy | |||
| Alberta | 2 542 | 2 129 | 413 |
| Saskatchewan | 4 753 | 3 853 | 899 |
| Subtotal - Heavy | 7 295 | 5 982 | 1 313 |
| Total - Conventional | 30 192 | 25 643 | 4 549 |
| Oil Sands | |||
| Mining Projects | 38 555 | 5 830 | 32 725 |
| In Situ Projects | 137 357 | 3 732 | 133 625 |
| Total - Oil Sands | 175 912 | 9 562 | 166 350 |
| Total Canada | 205 980 | 34 954 | 171 026 |
Appendix 2
Canadian Natural Gas ReservesNote a at 31 December 2013
| Natural Gas Reserves | |||
|---|---|---|---|
| Initial Reserves | Cumulative Production | Remaining Established Reserves | |
| Western Canadian Sedimentary Basin | |||
| British Columbia | 1 732 | 709 | 1 023 |
| Alberta | 5 421 | 4 523 | 898 |
| Saskatchewan | 259 | 215 | 44 |
| Total | 7 411 | 5 447 | 1 965 |
| Ontario | 43 | 36 | 7 |
| Frontier | |||
| New Brunswick | 4 | 1 | 3 |
| Nova Scotia Offshore | 55 | 51 | 4 |
| Newfoundland | 106 | 0 | 106 |
| Mainland NWT & Yukon | 32 | 20 | 13 |
| Mackenzie Delta | 0 | 0 | 0 |
| Subtotal - Frontier | 198 | 72 | 126 |
| Total Canada | 7 653 | 5 556 | 2 097 |
Source: NEB
Canadian Natural Gas ReservesNote a at 31 December 2013 (billion cubic feet)
| Natural Gas Reserves | |||
|---|---|---|---|
| Initial Reserves | Cumulative Production | Remaining Established Reserves | |
| Western Canadian Sedimentary Basin | |||
| British Columbia | 61 137 | 24 013 | 36 124 |
| Alberta | 191 351 | 159 668 | 31 684 |
| Saskatchewan | 9 143 | 7 600 | 1 542 |
| Total | 261 631 | 192 281 | 69 350 |
| Ontario | 1 526 | 1 288 | 238 |
| Frontier | |||
| New Brunswick | 145 | 47 | 98 |
| Nova Scotia Offshore | 1 942 | 1 807 | 135 |
| Newfoundland | 3 749 | 0 | 3 749 |
| Mainland NWT & Yukon | 1 144 | 694 | 450 |
| Mackenzie Delta | 11 | 7 | 4 |
| Subtotal - Frontier | 6 990 | 2 555 | 4 434 |
| Total Canada | 270 146 | 196 124 | 74 022 |
- Date modified: