Market Snapshot: Crude oil imports declined in 2021, while refined petroleum product imports rose modestly
Connect/Contact Us
Please send comments, questions, or suggestions for Market Snapshot topics to snapshots@cer-rec.gc.ca
Release date: 2022-03-30
Crude Oil Imports
Canadian crude oilDefinition* imports decreased by nearly 20% in 2021, from 579 000 barrels per day (b/d) in 2020 to 473 000 b/d in 2021.Footnote 1 This is the lowest amount of crude oil imported since 1988.
Where does our imported oil come from?
The United States (U.S.) continues to be the largest source of Canada’s imported crude oil. In 2021, 66% of Canada’s oil imports came from the U.S., compared to 75% in 2020. 2021 marked the first drop in the proportion of Canada’s imported oil from the U.S., relative to the rest of the world, since 2016. This drop was due to a variety of market factors, including pipelines flowing more domestic crude oil into Ontario/QuebecFootnote 2 and the Come-by-Chance Refinery in Newfoundland remaining idle.
Saudi Arabia was the second largest supplier of imported crude in 2021 at 15% of Canada’s total, and Nigeria was the third largest at 13%. Imports of crude oil from Nigeria increased by nearly 40 000 b/d in 2021, reflecting the largest year-over-year change of imports from any country.
Canada did not import crude oil from the Russian Federation in 2020 or 2021. Over the past decade, imports of crude oil from the Russian Federation have been relatively low, reaching a ten-year high of about 18 000 b/d in 2019. This represented only 3% of Canada’s total crude oil imports that year and 1% of Canada’s total crude oil demand.Footnote 3
Which provinces import the most crude oil?
Crude oil is used as feedstock for refineries to produce refined petroleum productsDefinition* (RPPs) such as gasoline, diesel, heating oil, and jet fuel. Canada produces more crude oil than needed by Canadian refineries, yet some provinces in Canada still import crude oil. Generally, provinces located near domestic crude oil production and with a direct pipeline connection to domestic supplies do not need to import crude oil. Refining provinces located further from the major production sources in western Canada, namely Ontario, Quebec, New Brunswick, and Newfoundland and Labrador, consistently rely on some imported crude oil.
New Brunswick, home of the Irving Oil Saint John Refinery, imported the most crude oil of any province in 2021, making up 56% of Canada’s total imports. New Brunswick imports more than other provinces because it has the country’s largest refinery and is not connected by pipeline to the rest of the country. Quebec imported the second largest amount of crude oil. Quebec’s largest refinery, the Valero Jean Gaulin Refinery, also is not well connected by oil pipelines and relies on marine shipments for its crude oil. Prior to 2016, Quebec imported the largest volumes of crude oil.
What does imported crude oil cost?
The total cost of all imported crude oil was $14.7 billion in 2021, an increase of 30% from 2020 when the cost was $11.3 billion. This increase is primarily because global crude oil prices recovered in 2021, following historic lows seen in 2020 at the onset of the COVID-19 pandemic. The average cost of an imported barrel was about $85Footnote 4 in 2021.
Figure 1: Annual Crude Oil Imports
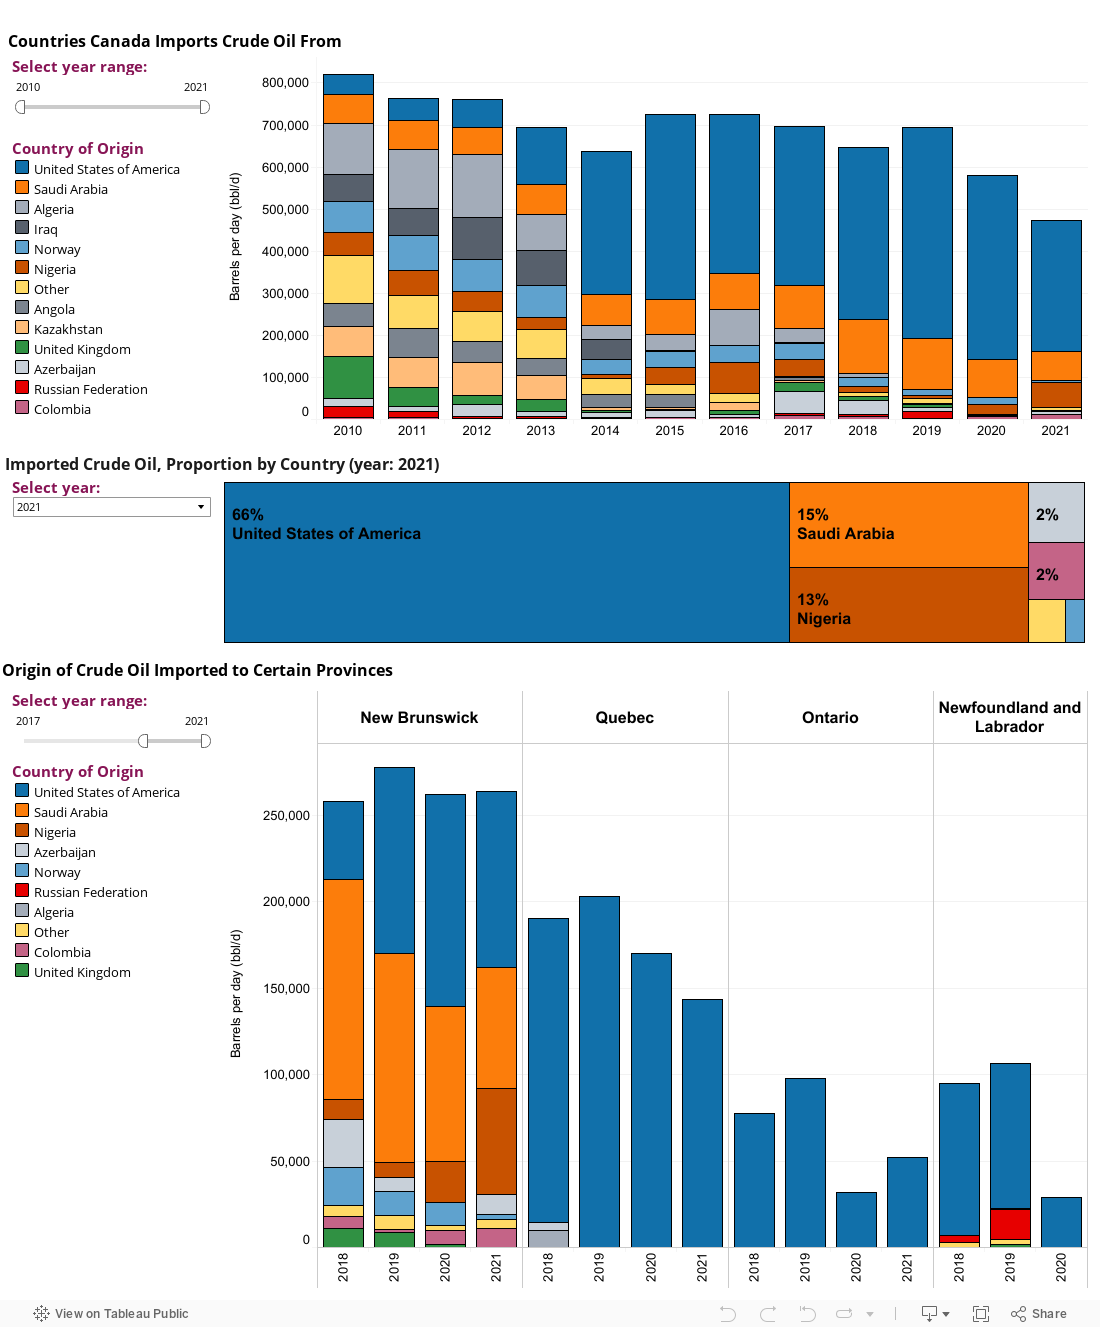
Source and Description
Source: Canadian International Merchandise Trade database (CIMT) – HS 2709
Description: The top chart displays the amount of crude oil (in barrels per day) that Canada imported from various countries from 2010 to 2021. The middle chart displays the proportion (as a % of total imports) of crude oil imported from various countries. The bottom chart shows the amount of crude oil (in barrels per day) that certain Canadian provinces import, including New Brunswick, Quebec, Ontario, and Newfoundland and Labrador.
Refined Petroleum Product Imports
Canada imported 450 000 b/d of refined petroleum products (RPPs) in 2021. This is a 7% increase from the 422 000 b/d imported in 2020. Since 2010, imports of RPPs have roughly tripled.
Where do our imported RPPs come from?
The U.S. supplies the vast majority of Canada’s imported RPPs, with 76% (340 000 b/d) coming from the U.S. in 2021, while the Netherlands provided 8% (35 000 b/d). The remainder came from several different countries around the world, including the Russian Federation, which supplied about 2% (10 000 b/d) of Canada’s total RPP imports. Over the past decade, RPPs imported from the Russian Federation have been relatively flat, making up 3% of total imports in 2010, and even less since then.
Which provinces import the most RPPs?
While Canadian refineries produce more RPPs than Canadians consume, Canada still imports these products because some parts of Canada do not produce enough RPPs to supply local needs. These areas are often not well-connected by transportation infrastructure to parts of Canada that have excess RPPs to spare.
Alberta imports nearly half of Canada’s total imported RPPs.Footnote 5 These RPPs are mostly diluent componentsFootnote 6 used for blending with bitumenDefinition* extracted from the oil sands to allow it to flow through pipelines. This blended crude oil is transported for consumption in Canadian refineries, as well as for export on CER-regulated pipelines, rail, and to a lesser extent, truck.
Quebec is the next largest importer of refined products, making up nearly 20% of total Canadian imports, followed by Ontario at 10%. These two provinces are home to the majority of Canadians; therefore, they have some of the highest demands for refined products.
What do imported RPPs cost?
The total cost of all imported RPPs was $16.8 billion in 2021, an increase of 50% from 2020 when the cost was $11.2 billion. This increase is because of the higher volumes of RPPs imported and the higher global RPP prices in 2021, compared to 2020. The price of RPPs tends to relate closely to crude oil prices, as RPPs are made from crude oil.
Figure 2: Annual Refined Petroleum Product Imports
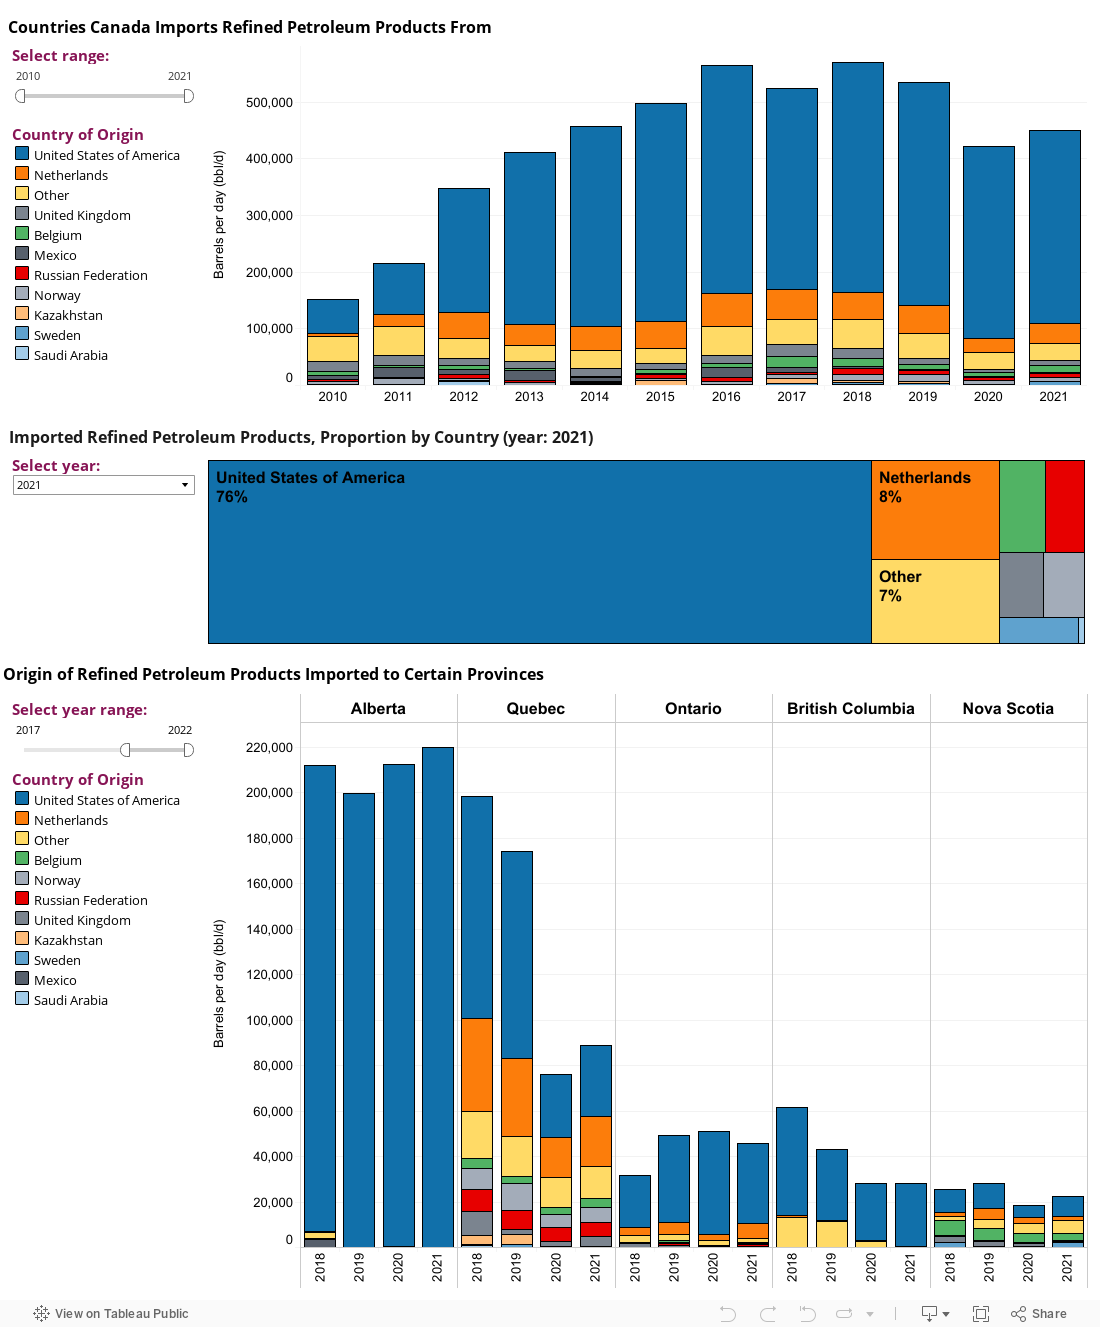
Source and Description
Source: Canadian International Merchandise Trade database (CIMT) – HS 2710
Description: The top chart displays the amount of refined petroleum products (in barrels per day) that Canada imported from various countries from 2010 to 2021. The middle chart displays the proportion (as a % of total imports) of refined products imported from various countries. The bottom chart shows the amount of refined products (in barrels per day) that certain Canadian provinces import, including Alberta, Quebec, Ontario, British Columbia, and Nova Scotia.
- Date modified: