Market Snapshot: Public transit has gained momentum in Canada in the last 20 years
Release date: 2018-08-29
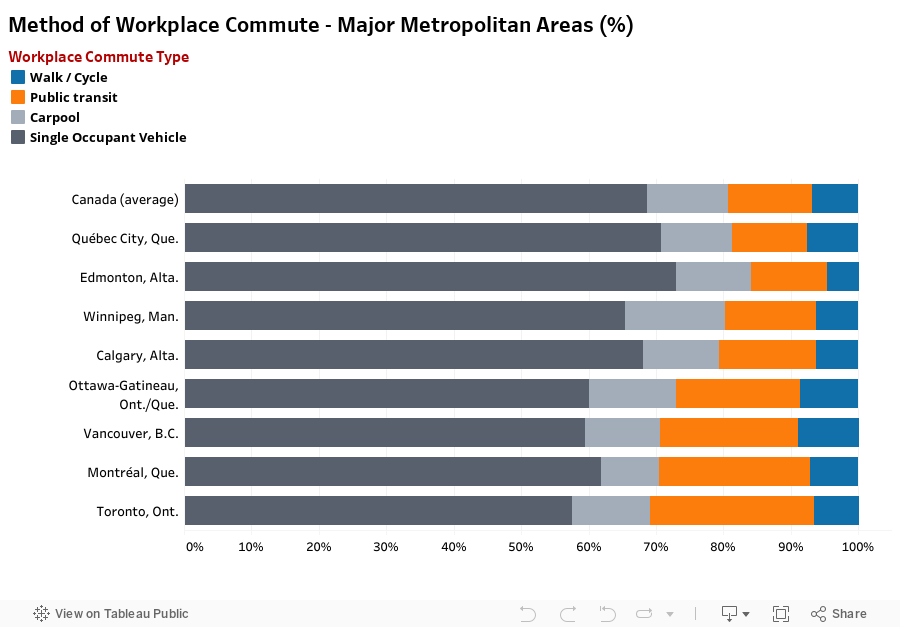
Most Canadians travel to and from work in single-occupant vehicles (SOVs). However, over the last 20 years in major metropolitan areas, workplace commute on public transit has grown by 59% to 12.4% of total workplace commute. During the same time period, the total number of people commuting has grown by 36%.
Source and Description
Source: Statistics Canada 2017 Census “Commuting”
Description: The bar graph shows share of commutes by single occupant vehicle, carpool, public transit, and walking or cycling by national average and major metropolitan area. The Canadian average for public transit is 12.4% of commuters. It is 11.1% for Québec City, QC, 11.3% for Edmonton, AB, 13.6% for Winnipeg, MB, 14.4% for Calgary, AB, 18.3% for Ottawa-Gatineau, ON /QC, 20.4% for Vancouver, BC, 22.3% for Montréal, QC, and 24.3% for Toronto, ON.
Over 80% of Canada’s population lives in urban areas and approximately 50% lives within six major metropolitan areas.Footnote 1 These major metropolitan areas have experienced the largest growth rate in the last decade, and are expected to draw the majority of new residents in the future. This geographic shift tends to increase urban density and facilitate the development of public transit and other sustainable ways of commuting.
Overall, changing demographics, technology, and consumer behavior are among the factors that are changing the way Canadians commute to work. The factors affecting the way Canadians commute are considered in an integrated context in the NEB’s Canada’s Energy Future 2017 report.
- Date modified: