ARCHIVED - Canada’s Energy Transition: Historical and Future Changes to Energy Systems – Update – An Energy Market Assessment

3. Global Energy Use and the Current Transition
ENERGY UNITS USED IN THIS REPORT
A joule is a unit of energy. Because a joule is a very small unit of energy, it is often expressed in multiples such as:
- One megajoule (MJ) = one million joules
- One gigajoule (GJ) = one thousand MJ
- One terajoule (TJ) = one thousand GJ
- One petajoule (PJ) = one thousand TJ
- One exajoule (EJ) = one thousand PJ
One GJ is equal to slightly more than two 20 pound propane cylinders or 30 litres of gasoline. The average Canadian household consumes 93 GJ of energy each year.
One EJ is equivalent to the energy content in 174 million barrels of oil. In 2017, the world consumed 98 million barrels of oil per day (or 0.56 EJ per day).
A watt is a unit of power equal to one joule per second. Similar to joules, watts are also expressed as a multiple, such as megawatts (MW), gigawatts (GW), and terawatts (TW). A typical on-shore wind turbine has a capacity of around two to four MW, the Robert-Bourassa hydro station has a capacity of 5.6 GW, and the Bruce Power Generating Station has a capacity of 6.3 GW.
A watt hour is a unit of energy defined as the power in watts delivered over an hour, and is equal to 3 600 joules. Common multiples include the kilowatt hour (kW.h), megawatt hour (MW.h), gigawatt hour (GW.h), and terawatt hour (TW.h). A clothes dryer running for an hour consumes an average three kW.h. The average Canadian household consumes 12 MW.h of electricity each year. In 2017, Canada generated 650 TW.h of electricity.
See the NEB’s Energy Conversion Calculator to convert between units.
Global energy use has grown substantially over the last 50 years. Technological improvements since the early 20th century have resulted in the discovery and eventual use of new forms of energy. Use of energy sources such as coal shifted from transportation (for example, in steam locomotives), space heating, and industrial processes to use in electricity generation. Developments in marine shipping—including speed, efficiency, and economies of scaleFootnote 8 – resulted in the establishment of a global crude oil trade. Developments in the liquefaction of gasses, in combination with shipping developments, later resulted in the establishment of a global liquefied natural gas (LNG) trade. This movement of energy around the globe allowed, and continues to allow, energy resource-poor societies to develop and grow their economies. To illustrate the impact that the global energy trade can have on an economy, natural gas from LNG now accounts for the source of almost 50% of Japan’s electricity production mix.Footnote 9
This rapid growth in the production and global trade of crude oil and natural gas also allows nations wealthy in energy resources to monetize their resources and build their economies, and enables nations poor in energy resources to import the fuels required to build modern, developed societies. This abundant supply of energy, coupled with continually growing demand, resulted in the continual growth of global energy consumption. In 2017, global energy consumption reached a record high 566 exajoules (EJ).
Global energy use and economic growth is highly unbalanced. Historically, developed nations (nations who are members of the OECD) were the largest consumers of energy in absolute terms. However, developing (or “non-OECD”) nations became the largest consumers of energy after 2007. This change came as a result of industrialization, motorization, economic reforms, urbanization, and other structural transformations that occurred in many of these developing nations in recent decades. This is illustrated in Figure 2.
As economic and population growth in developing nations continues to surpass growth in developed nations, energy demand growth in developing nations is expected to continue outpacing energy demand growth in developed nations.
Figure 2: Energy Consumption: OECD and Non-OECD Nations, 1965-2017
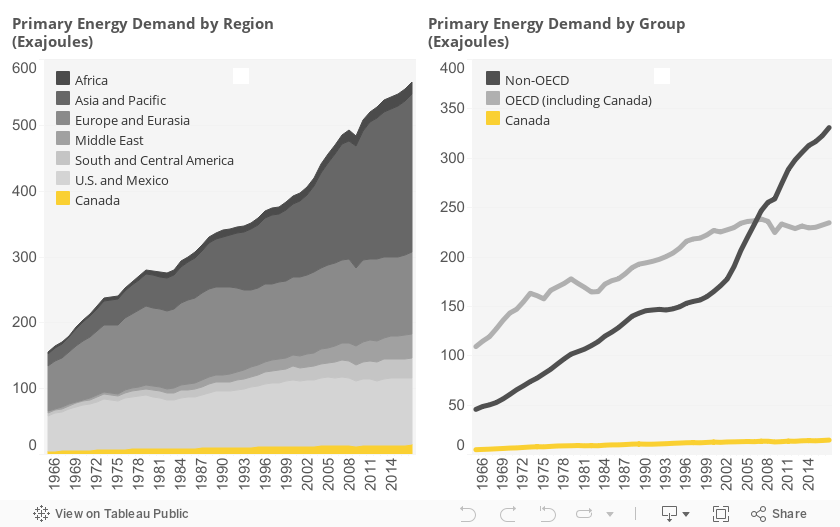
Source: BP Statistical Review of World Energy (2018)
Description:
These two graphs illustrate global trends in energy consumption from 1965 to 2017. The stacked area graph on the left illustrates global energy consumption by region. In 2017, global primary energy consumption was 566 EJ. Of this amount, Canada consumed 15 EJ (or 2.5% of the total). The largest consuming region was Asia Pacific, which consumed 240 EJ (or 43% of the total).
The line graph on the right illustrates the growing rate of energy consumption by OECD and non-OECD nations between 1965 and 2017. In 2007, non-OECD nations became the largest group of energy consumers as energy consumption by OECD nations began to flatten. As of 2017, non-OECD nations consumed 331 EJ of energy while OECD nations consumed 234 EJ.
Why Transition?
In addition to a strong link between energy use and social and economic development, there is also a strong link between energy use and the environment. Carbon dioxide (CO2) is a GHG that results from the combustion of biomass and fossil fuels. GHGs also result from the conversion of land from natural vegetation to urban, industrial, or cultivated land. GHGs are the main cause of climate change, and the shift from carbon-emitting fuels towards non-carbon-emitting fuels is what defines the current energy transition.
Not all carbon-based fuels are equal. Different fuels contain different amounts of energy and consequently, have differing levels of CO2 after combustion as illustrated in Table 2. Wood and lignite coal are light on energy densityFootnote 10 (as measured in megajoules (MJ) per kilogram (kg)), but are heavy on emissions relative to refined petroleum products (such as diesel and gasoline) and natural gas.
Table 2: Energy Density and Carbon Emissions from Various Fuels
| Fuel | Energy density (MJ per kg) |
CO2 emissions from combustion (grams per MJ) |
Emissions difference relative to lignite coal |
|---|---|---|---|
| WoodFootnote 11 | 15 to 22 | 109.6 | +8% |
| Coal (lignite or ‘brown coal’) | 15 to 19 | 101.2 | - |
| Coal (anthracite or ‘hard coal’) | 27 to 30 | 94.6 | -7% |
| Diesel | 42.8 (or 36.4 MJ per L) |
74.1 | -27% |
| Gasoline | 43.8 to 47.9 (or 32.0 to 35.0 MJ per L) |
69.3 | -32% |
| Natural Gas | 53.8 (or 23.0 to 26.0 MJ per L of LNG) |
56.1 | -55% |
Source: University of Washington, Volker Quaschning, NEB calculations
Figure 3: Global Primary Energy Consumption by Fuel, 1850 – 2017
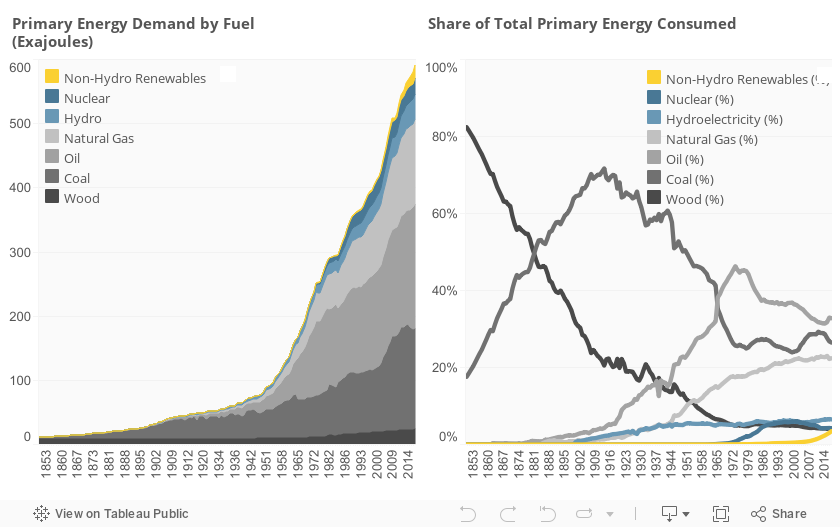
Source: BP Statistical Review of World Energy (2018); Dr. Arnulf Grübler (data appendix from Technology and Global Change)
Description:
These two graphs illustrate global primary energy consumption by fuel type between 1850 and 2017. The area graph shows the growth in primary energy consumed, from 11 EJ in 1850 to 580 EJ in 2017.
The line graph illustrates the share of total primary energy consumed by fuel between 1850 and 2017. In 1850, wood and biomass provided over 80% of the world’s energy needs while coal provided the majority of the remainder. By 2017, wood and biomass provided less than 5% of the world’s energy needs while coal’s share was 27%. The remaining shares of primary energy consumed in 2017 were crude oil at 32%, natural gas at 23%, hydroelectric at 7%, nuclear at 4%, and non-hydro renewables at 3%.
Figure 3 illustrates a 167 year global history of energy consumption by fuel. Since the 1950s, the majority of growing global energy needs have been met using carbon-emitting fuels (biomass, coal, crude oil, natural gas). Currently, carbon-based fuels account for 85% of the world’s primary energy needs. Non-emitting sources, such as hydroelectricity, nuclear, wind, and solar have historically accounted for only a small percentage of the primary energy consumed globally.
The global economy’s growing demand for energy, particularly from abundant and affordable carbon-emitting fuels, has resulted in global GHG emissions reaching new heights with each year. Between 1850 and 2014, GHG emissions grew from an estimated 198 megatonnes of CO2 equivalentFootnote 12 (MT of CO2e) to over 44 000 MT of CO2e.Footnote 13
Figure 4: Global GHG Emissions and Canada’s Share, 1990 – 2014
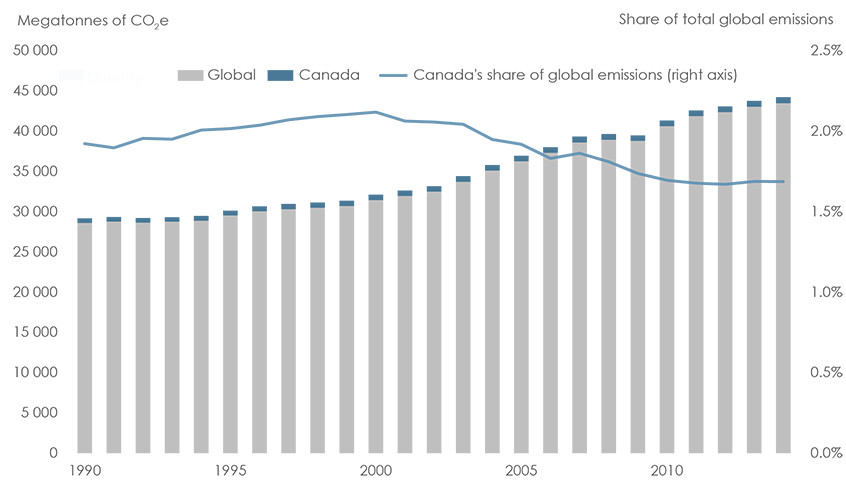
Source: CAIT Climate Data Explorer
Description:
This combined stacked column and line graph illustrates total global GHG emissions, and Canada’s share of global GHG emissions, from 1990 to 2014. From 2000 to 2014, total global GHG emissions increased from 29 151 MT of CO2e to 44 204 MT. Canada’s share of global emissions have decreased from 2.1% to 1.7%, though Canada’s emissions increased from 560 MT of CO2e to 745 MT.
Figure 4 illustrates the trend in GHG emissions between 1990 and 2014. Over this period, Canada’s emissions increased 33% to 745 MT of CO2e. Though Canada remains a relatively small contributor to global GHG emissions, Canada is one of the most emission-intensive nations in the world. This will be explored more in the next section.
The Current Transition
Figure 3 also illustrates that energy transitions, historically, have occurred slowly. Prior to 1880, biomass was the largest source of primary energy globally. Coal, a major driver of the Industrial Revolution, was more abundant and less labour intensive than wood/charcoal. Coal’s share as a primary energy continued to grow as a source of fuel, and peaked in the 1910s when it met 70% of the world’s energy needs. While the use of coal grew five-fold over the next century, coal’s share as a primary energy source declined to 28% in the 2010s. Starting in the 1930s, global energy needs were being met through increasingly abundant and affordable hydrocarbons.
Nuclear energy, first used for electricity generation in the 1950s, has accounted for 4% to 6% of global primary energy demand since the mid-1980s.Footnote 14 As of 2016, there were 450 nuclear reactors operating world-wide and another 60 under construction.Footnote 15
A fundamental component of the current energy transition is increased energy from renewables. Figure 3 illustrates that energy from non-hydro renewables, such as wind and solar, has increased from 2 EJ in 2000 to 20 EJ in 2017. This may seem small, but it is worth noting that no other primary energy source has experienced a ten-fold increase in growth, or has grown in share by that amount in a 17-year timeframe. The growth in non-hydro renewable use is similar to the rise of nuclear in the 1970s and 1980s and many international energy forecasting agenciesFootnote 16 see the share of renewables continuing to grow into the future. Advancements in technology and improvements in economics have resulted in non-hydro renewables competing with traditional energy systems on a cost per energy generated basis.
What Figure 3 does not illustrate is the pace at which individual economies transition from one energy source to another. Historically, not all societies have transitioned at the same speed, or with the same magnitude. Coal, despite being inferior to oil and natural gas in terms of energy density, still remains an abundant and affordable source of primary energy for many developing and developed nations. Biomass use – higher now than in 1900 – continues to be used as a cooking fuel by over 2.5 billion people globally; primarily in rural areas of developing nations.
A History of Global Efforts
FROM KYOTO TO PARIS
The Paris Agreement is similar to the Kyoto Protocol in that both build on the goals set out in the UNFCCC, and were developed with the aim of curbing the rise of global temperatures through a reduction in GHG emissions.
The Kyoto Protocol entered into force in 2005 with 192 parties signing on, including Canada.
Canada’s Kyoto target was a 6% reduction below its 1990 emissions by 2012. However, by 2010, Canada’s emissions had increased 15% from 1990 levels. In 2012, realising it was unable to meet its commitments, Canada withdrew from the agreement.
The Paris Agreement was adopted in 2015 and entered into force in 2016. Paris differed from Kyoto because instead of internationally binding emissions targets, countries set voluntary, nationally determined targets. The targets are expected to represent best efforts and are to be strengthened over time. As well, under the Paris Agreement, both developed and developing countries are required to set emissions reductions targets. In contrast, the Kyoto Protocol only requires targets to be set by developed nations with developing nations given the opportunity to voluntarily comply.
The rapid increase in energy-related GHG emissions and the effects of these emissions on the climate are the underpinning of national governments reaching agreements to take action. Typically, these agreements involve governments adopting policies designed to change the behaviours of consumers and producers.
International policies have been the impetus for change, and Canada has a history of involvement in environmental treaties and agreements. The Montreal ProtocolFootnote 17 is one such international treaty that Canada was party to. Finalized in 1987 and implemented in 1989, the Montreal Protocol resulted in the phasing out of substances that deplete of the ozone layer (primarily chlorofluorocarbons or CFCs). In addition to being the first environmental agreement to achieve universal ratification by all countries, the agreement is widely acknowledged as a success and it illustrated that international cooperation towards a common environmental goal was in fact possible. Three decades later, the Montreal Protocol became an instrument against climate change in 2016 with the Kigali Amendment.Footnote 18
In 1992, the United Nations (UN) Framework Convention on Climate Change (UNFCCC) was adopted at the Earth Summit in Rio de Janeiro, Brazil by 154 signatories. It has since been ratified by 197 countries. The treaty set out a goal to stabilize GHG concentrations “at a level that would prevent dangerous anthropogenic interference with the climate system.” Under the UNFCCC, the Kyoto Protocol (1997) was the first agreement to set emissions reductions targets, though only for a limited number of parties.Footnote 19
The Paris Agreement was the outcome of the 21st Conference of the Parties (COP21) of the UNFCCC in Paris in December 2015. To date, the Paris Agreement has been signed by 197 nations and ratified by 185.Footnote 20,Footnote 21 The central goal of the Paris Agreement, which includes emissions reduction commitments by a much larger group of parties than the Kyoto Protocol, is to keep the global temperature increase to well below 2º Celsius above pre-industrial levels this century, and to pursue efforts to limit the temperature increase even further to 1.5º Celsius above pre-industrial levels.
As the effects and the costs of climate change increase, the push for action on climate change has also increased. This has resulted in the current energy transition being the first transition where environmental factors are a primary driver of the transition. The transition is being further supported by technological, economic, and political factors.
The Pan-Canadian Framework on Clean Growth and Climate Change
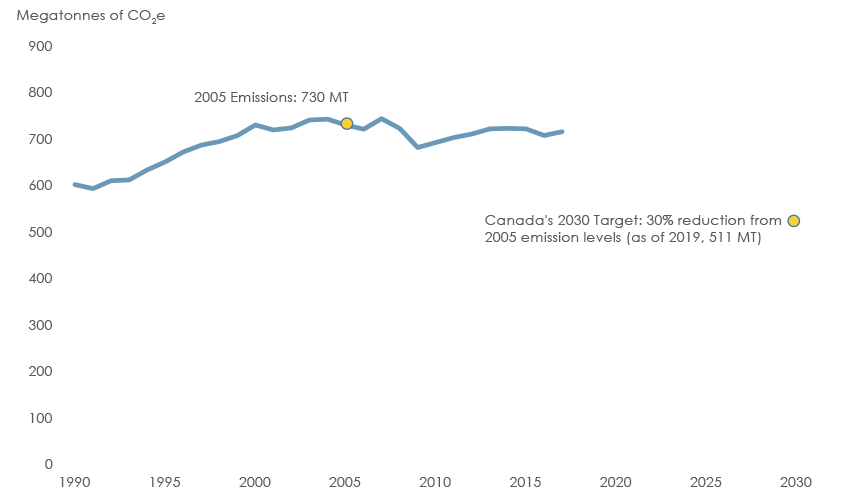
Canada’s commitment under the Paris Agreement involves a 30% reduction of its GHG emissions from 2005 levels (730 MT of CO2e) by 2030, which equates to a target of 511 MT. Canada’s emissions in 2017 were 716 MT, which represents a net decrease of 1.9% from 2005 levels. On a per capita basis, GHG emissions have declined from 22.7 tonnes of CO2e per person to 19.5 tonnes per person, a net decrease of 14.1%.
Figure 5: Canada’s Historical GHG Emissions and 2030 Target
Source: ECCC – National Inventory Report 1990-2017
Description:
This line chart illustrates Canada’s historical GHG emissions from 1990 to 2017. The chart also includes Canada’s 2030 GHG target of 511 MT of CO2e.
Note: GHG emissions, including 2005 levels and the 2030 target, are subject to revision.
The Pan-Canadian Framework was developed in 2016 and represents Canada’s commitment to fighting climate change.Footnote 22 Placing a price on carbon pollution is central to the Framework. Carbon pricing is an efficient way to reduce emissions, drive innovation, and encourage people and businesses to pollute less.Footnote 23
In addition to placing a price on carbon pollution, the Pan-Canadian Framework also includes complementary actions that aim to reduce emissions by addressing market barriers where pricing alone is insufficient or not timely enough to reduce emissions in the pre-2030 timeframe. These actions, for example, include increasing the stringency of energy efficiency standards and codes for vehicles and buildings. The Pan-Canadian Framework also includes actions to help Canadians adapt and become more resilient to the effects of a changing climate and foster clean technology solutions.
Environment and Climate Change Canada’s (ECCC) 2018 GHG emission projections estimate that Canada’s GHG emissions in 2030 will be 223 million tonnes lower than projected prior to the Pan-Canadian Framework. ECCC estimates that once the Pan-Canadian Framework is fully implemented, it will put Canada on a path towards meeting its 2030 target and to continue to achieve emission reductions beyond 2030.
Placing a Price on Carbon
OVERVIEW OF PAN-CANADIAN FRAMEWORK ACTIONS
IIn addition to the pricing of carbon pollution, there are numerous other actions that help shape the Pan-Canadian Framework, including:
- The phase-out of coal-fired electricity by 2030.
- Reducing the reliance on diesel-fired generation in northern, remote, and Indigenous communities.
- Improving vehicle efficiency, developing a Clean Fuel Standard, and placing more zero-emission vehicles on the road.
- Reducing methane emissions from the oil and gas sector.
- Improving energy efficiency in all sectors.
- Protecting and enhancing carbon sinks (that is, carbon stored in forests, wetlands, and agricultural areas).
The Framework also includes collaboration with Indigenous Peoples and incorporates drawing from their Traditional Knowledge, particularly in the context of adaptation and climate resilience.
A carbon price places a cost on activities that result in GHG emissions. In practice, a government can impose a fixed charge based on actual emissions, based on the embedded carbon in fuel, or based on the carbon emitted to produce a product. Therefore, the more an individual or organization emits, the more they pay. Carbon pricing is transparent and predictable and provide an incentive for energy efficiency and emissions reductions innovations. Decisions about how to return the revenue from carbon pricing can have important impacts, including helping alleviate any regressive effects and further supporting research and development or investments in energy efficiency.Footnote 24
Emissions permit trading and cap-and-trade systems operate differently from a tax, though the objective of reducing emissions remains the same. Under permit trading, governments can set a limit on GHG emissions and issue a fixed number of permits equal to the cap. The trade component allows for polluters to trade permits with other polluters. This trading mechanism allows for polluters who can decrease their emissions most cheaply to sell and profit from the sale of their permits to other polluters who need to increase their emissions or are unable to reduce cost effectively. When governments reduce the cap over time, it is possible to reduce total emissions while creating an incentive to drive lower cost-emissions reductions first.
The main benefits of permit trading are the certainty of reductions and the ability to link with other permit trading systems in other jurisdictions. The drawbacks of permit trading are higher administrative costs and price uncertainty for emitters.
Other Policy Tools
As recognized by governments party to the Pan-Canadian Framework, multiple actions will be needed in addition to carbon pricing for Canada to reach its 2030 Paris Agreement target and to continue to further decarbonize its economy by mid-century. In the move towards electrification and clean energy, significant investments will be required, as well as a deeper understanding by end-users as to how we produce and use energy.
Complementing market-based instruments are a variety of other policies that contribute to reducing emissions. These policies and regulations typically work by encouraging or discouraging behaviours through non-monetary means. These include, but are not limited to: policies and regulations related to improved practices and standards, investments in research and development for energy efficiency and clean technology, and electricity sector initiatives (such as renewable portfolio standards and coal phase-outs).
Policies are an important part of energy trends. As Canada’s energy systems evolve, it will continue to be guided by policy decisions. Furthermore, given the long lifespans of energy-consuming equipment and projects, current policy developments will play a large role in future trends.
- Date modified: